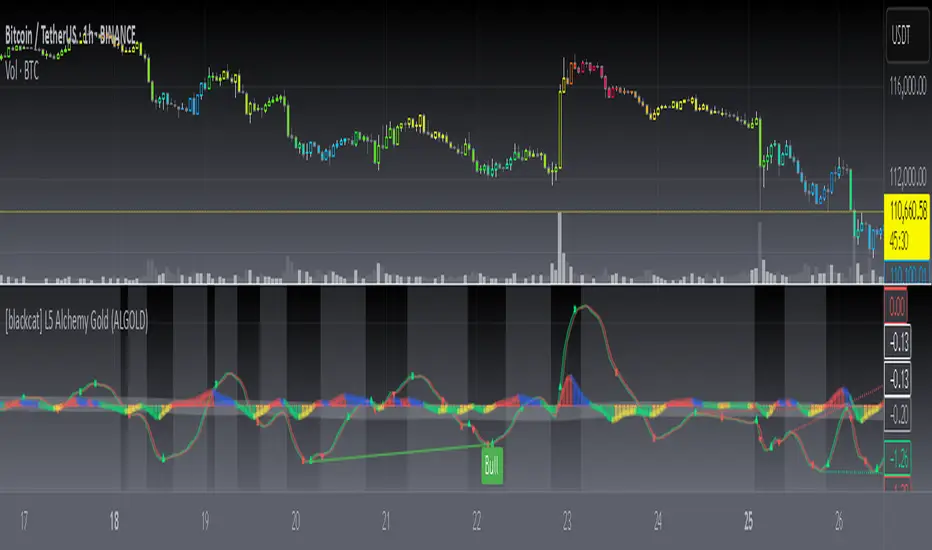
[blackcat] L5 Alchemy Gold (ALGOLD)" L5 Alchemy Gold (ALGOLD)" indicator is a trend-following indicator that blends volume and price data to create a MACD-like oscillator, aiming to address the lagging issue typical in price-only indicators. The integration of leading volume information with lagging price data is a smart approach to create more timely signals. Additionally, incorporating a volatility filter to reduce false signals during sideways markets is a thoughtful enhancement.
It is shaping up to be quite comprehensive. It includes:
- An adaptive filter for smoothing price and volume data.
- A volatility filter based on Average True Range (ATR).
- A trigger moving average for generating smoothed price information.
- An ALMA (Arnaud Legoux Moving Average) for further filtering of price and volume.
- A divergence detector to identify potential trend reversals.
Entry Criteria : A composite crossover and crossunder of the fast and slow lines of the ALGOLD oscillator.
Exit Criteria : A crossover and crossunder of the fast and slow lines of the ALGOLD oscillator, but using a lower time frame for more sensitivity.
The input parameters of " L5 Alchemy Gold (ALGOLD)" indicator, are categorized into three groups:
Group 1, Alchemy Setting:
Alchemy Sharpness (Default: 7) - Controls the sharpness of the adaptive filter.
Alchemy Period (Default: 55) - Determines the smoothness of the oscillator.
Group 2, DVATAR Setting:
DVATR Length (Default: 11) - Sets the period length for the DVATR, similar to ATR's Length.
DVATR Threshold (Default: 0.07) - Adjusts sensitivity for sideways market detection.
Smooth Length (Default: 21) - Smoothens the DVATR output, balancing with volatility detection.
Group 3, Divergence Setting:
Parameters like Pivot Lookback, Max/Min of Lookback Range - Sets the sensitivity for divergence detection.
Options to enable or disable plots for various types of divergence (Bullish, Hidden Bullish, Bearish, Hidden Bearish).
" L5 Alchemy Gold (ALGOLD)" indicator are vivid and intuitive:
Candle Bar Color :
Gradient color changes to indicate trend strength, with warmer colors for bullish and cooler colors for bearish trends.
Line Colors and Shapes :
Green color represents the fast line, red for the slow line.
Crosses of these lines signal entries (triangles) and exits (cross shapes).
A band is created between these lines, filled with green for uptrends and red for downtrends.
Histogram :
Red histogram for above 0 and uptrend.
Blue histogram for above 0 and retracement.
Green histogram for below 0 and downtrend.
Yellow histogram for below 0 and bounce-up.
"algo" için komut dosyalarını ara
YinYang MomentumOverview:
YinYang Momentum is a Price, Volume and Momentum Oscillator. Its job is to help you see swings in momentum and the strength of it. It also creates signals (Blood Diamond (Bear) and Support Cross (Bull)) where these momentum swings may occur. YinYang Momentum features 3 Price and 3 Volume 'Mountains with Ice'. There are Predictive, Regular and Confirming Mountains. You have the ability to overlay them on top of each other which helps to decipher momentum swings. The Volume Mountains are very important for showing the strength behind the Price Mountains and their Signals. If you look, you'll notice, as the 'Ice' starts to curve into the 'Mountains' it signals a potential shift in Momentum. The green Mountain is the Predictive, the Blue is the Regular and the Purple is the Confirming. You'll also notice that the Predictive Mountains movements happen first and move much more drastically. When you notice the regular starts to follow suit, there is a potential for a momentum shift. Shortly after, a signal will occur if this shift is actually happening. You can also check the Confirming Mountain for more confirmation (however, leaving the Confirming Mountain active can be a little confusing and make it harder to read signals). YinYang Momentum also features Information Tables. These tables display how the Blood Diamonds and Support Cross' are fairing on different Timeframes. This way, you'll be able to see if it's in a Bullish or Bearish state on critical Time Frames no matter what Timeframe you're trading on.
Before we move onto the tutorial, let's discuss what each of these Mountains and Ice are and how they work. All of our Mountains and Ice are calculated using the same algorithm but with varying sources, lengths and multipliers. We are essentially calculating differences in movement and then sending those differences into an EMA for the Mountain Base and SMA for the mountain Ice. The values we use for the Predictive are much lower and therefore occur much quicker as they aren’t averaged out on longer lengths/time frames; this helps to make it more of a leading Indicator which may predict momentum changes. Our Regular is over a medium length and multipliers that result in a smooth but generally also gradual movement that helps reliability; this helps it act as more of an ‘in the now’ Indication of momentum changes. Our Confirming uses lengths and multipliers that are of a higher value and longer span; this makes it more difficult to use for determining entry / exit locations as it's more of a lagging indicator, but it helps to add confirmation as to whether the momentum change has occurred and wasn't a false signal.
Tutorial:
YinYang Momentum may look like a lot is going on.. And well that’s cause there is.. But that doesn’t mean it's confusing or hard to read once you know what you’re looking for!
To make this tutorial a little easier to understand, let's turn off a few settings and dissect this indicator one thing at a time. YinYang Momentum features Price and Volume mountains. Currently in the photo above we have 2 Price Mountains and 1 Volume Mountain turned on (this is how it's set by default and how we recommend using it), however there are 3 Mountains available for both Price and Volume:
Predictive
Regular
Confirming
We are going to deactivate everything so it's the Regular Price Mountain + Ice enabled.
Now that it is just the Regular Price Mountain and Ice it is much easier to teach and understand. As you can see there are two different colors on the mountain. The dark blue is the Mountain and the light blue is the Ice.
The Ice moves before the mountain does and when the momentum happens it is larger than it (below or above). When the momentum starts to change however, the Ice curves inside of the mountain. As you can see here, where the BUY signal (red cross) is, the Ice curves into the mountain; also where the SELL signal (red circle) is, the Ice curves into the mountain. The Ice curving into the mountain is a very important leading indication that momentum is changing and the Signals (crosses and diamonds) help solidify this momentum change.
The Index levels for YinYang Momentum is a little different than most oscillators that range from 0-100. Instead YinYang Momentum’s neutral level is 0 and it ranges from -100 to 100. For these reasons, the Viable Range for Buying is -40 to -70 and the Optimal Range for Buying is -70 to -100. For Selling, the Viable Range is 40 to 70 and the Optimal Range is 70 to 100.
If you look at the example above, you can see whenever it has been in the optimal range and the signal occurred, it may potentially be an amazing time to buy or sell. However, when it is within the Viable Range it can be hit or miss. The reason for this is because we are only looking at the Regular Price Mountain and Ice. Once we turn on the Predictive Price and Regular Volume we will have a much clearer idea as to what is noise and what is a true purchase signal. Why don’t we turn on Predictive Price Mountains and Ice so you can see what we’re talking about:
So there are 2 big things that changed when we added the predictive price mountains + ice.
We can see that where the orange circle is, is just noise, it isn’t a viable buy signal.
We can see that where the red circle is, is actually a better spot to sell than the previous marked white circle slightly to the right of it.
We will explain why both above are true, but first let's explain how we were able to deduce this information.
There are 5 rules when deciphering if the signal is a true signal or just noise.
You want the predictive mountain to be decently spaced out from the regular mountain. Refer to the example above how that should look. Remember it's predictive so with parabolic movements it will get quite spaced out. If the price went up but slowly, it generally won’t be as spaced and isn’t as strong of a signal predictor.
You want the Ice to be of a decent size and to curve in on both the Predictive and Regular Mountains. Both arrows (red and white circle arrows) are pointing to Ice that does just that. The Predictive mountain is of decent size and spaced out and the Ice curves in sharply on the Predictive, before curving in sharply on the Regular and then we get both Predictive and Regular Support Cross on the Same Bar.
When you get the Signals (Predictive and Regular) the amount of bars between them matters a lot! On the same Bar is ideal, however 1-2, max 3 bars between them is acceptable. Any more than 3 bars spacing and it's too risky of a signal because that means momentum change was happening but then stopped before picking back up. This doesn’t mean it can’t be a good signal, it just means it is much more risky and we don’t recommend it.
You don’t want Signal Clustering. You can see an example of this from the picture above. Signal Clustering is where signals are back to back over and over. During this time the momentum is in a consolidation phase and easily swaps back and forth between signals. These signals are not reliable and should not be traded on. We only want to act on clear momentum based signals.
Last but certainly not least, actually, the most important! Ensure that the Mountain + Ice for both the Predictive and Regular is at the bare minimum touching (preferably inside) the Viable Range. The Optimal range is best, but most mountains don’t make it that far. Viable Range is where you will make most of your trades from. Sometimes a great signal happens with all 5 of these rules but it is only touching the Viable Range right at 40 or -40. This CAN be okay, but is also much more risky than if it was at 50 to 60 or -50 to -60.
Based on the 5 rules mentioned, take a second and look back at the photo where we initially added the Predictive Price mountains and Ice, can you decipher why the orange circle is just noise, and can you see why the red circle is a better sell location than the white circle slightly to the right of it?
Let’s bring that photo back up now and let’s discuss this:
Let's start with the orange circle:
This orange circle, without the predictive, was hard to tell if it was a good location to buy or not, but the second we turned it on we could clearly see it was just noise.
The spacing between the Predictive mountains and the Regular is almost non-existent.
There was signal clustering shortly before this signal.
Remember, there doesn’t have to be many rules broken for a signal to be either too risky or not valid at all. The safest trades are ones where it meets the requirements of all 5 rules (6 once we talk about volume, but 5 price rules).
Now, let's discuss the red circle:
This red circle, although it could have been chosen with just the regular, was much more noticeable with the predictive added on top.
It has a perfect spacing between the Predictive and the Regular all the way to the peak.
The Ice is large and both curve in very nicely towards the mountains.
The signals are within 2 bars apart from each other.
There is no signal clustering.
The Predictive is within the Viable Range and the Regular is just touching it.
For these reasons, the red circle actually would have been where you sold and not the white circle beside it.
This pretty much covers the Price Mountains, but wait! The most important Cherry on Top to your decision making process is coming next!
We have just enabled our Regular Volume Mountains and Ice (which are the black mountains + ice). As you can see, we have circled what we call the ‘Perfect Combo’. This Perfect combo is when you have all 5 Price rules met COMBINED with a high volume mountain. The Volume Mountain and Ice act as strength. They aren’t biased towards bulls or bears, they simply show strength to whatever signal is present with it.
For example, if all 5 rules are met with Price on a Blood Diamond (Bear) Signal and there is a High Volume Mountain then this is also a ‘Perfect Combo’. That Blood Diamond signal will potentially have great strength behind it. The Viable and Optimal Ranges don’t apply to volume mountains. Any volume mountain, even close to the Viable Range, is considered to be a very high mountain. High volume is when the mountain is above 0 and low volume is when it's below 0. Any signal with low volume has less of a chance of being correct, regardless of whether it abides by all 5 price rules.
You can see here that the 5 Price rules are achieved but the volume mountain is low. It is at -25. Since the 5 Price rules are right, there is still a decent amount of accuracy to this signal and the price did plummet after, but not nearly as much as it would have if the volume mountain was high with it.
We have turned our Confirming Price Mountain on here so you can get an idea of what it looks like and how it’s used. If you refer to the Support Crosses and Blood Diamonds circled in white, you’ll see that although they both received their signals on the Predictive and Regular, neither of them received it on the Confirming. This shows that these signals lost momentum shortly after. However if you look at both the red and green circles, you’ll see that they both received their confirming signals and that it helped give those signals momentum. The Confirming Price Mountain is meant to help confirm if the momentum change is still on track and the max 3 bars from the regular signal rule still applies to it. However its height within the viable and optimal range is important, just not as relevant
Before we move on to our Information Tables we want to take a second just to discuss our Volume Mountains and Ice. We haven’t had a chance yet to discuss the Predictive or Confirming Volume. When it comes to our Volume Mountains + Ice, we don’t recommend having more than 1 on at a time. The reason we have included the Predictive and Confirming is in case you find they suit your Trading Style best, not necessarily to be used the same way the Price Mountains and Ice are. The main reason for this is due to the fact that the Volume Mountains are much smaller and when overlaid on top of each other can make a confusing blur that is hard to decipher.
In this example above we have enabled both Predictive and Regular Volume just so you can understand what we are talking about. The two together can be rather confusing and actually interfere with your decision making process. For this reason, we highly recommend finding the Volume Mountain that suits your trading style best and solely sticking to that.
Our Predictive Volume Mountains and Ice may help sense volume changes before they’ve even happened. This can be very useful if your Trading Style revolves around heavy volume changes.
Our Confirming Volume Mountains and Ice are much slower and smaller, but they help show the movement of volume that has occurred already. This can be used to help see the movement of volume without fearing it may or may not happen.
Our Information Tables are there to show you valuable information on whether it is in a state of Support Cross or Blood Diamond on 6 different Time Frames at the same time. The % it shows you displays how much of a price change has occurred since that signal has happened. It is important to note, if for instance you see it is in a state of Support Cross but the % is negative, this generally means it is going to switch to Blood Diamond soon and vice versa. Therefore if you are in a trade, especially on a lower Time Frame and you are watching the 1 Day or a higher Time Frame and notice that the % is getting less and less, it may be a good time to get out.
We will conclude our Tutorial here. If you have any Questions, Concerns, Suggestions or Comments please don’t hesitate to contact us.
Settings:
1. Show Predictive to Confirmed Trendline:
The Predictive to Confirmed Trendline is very useful for seeing when the predictive (Support Cross or Blood Diamond) has hit the confirmed (It’s a strong confirmation that the trend may be shifting). This trendline also features a Moving Average which helps give you a solid marker for when the Regular / Predictive mountains cross under or over it that a momentum swing may occur. Somewhat like when the RSI crosses above/below its Moving Average it dictates momentum change, that is likewise how to interpret when it happens with the mountains and this trendline.
2. Show Price Ice and Mountains based on:
The Price Ice and Mountains are very important when it comes to deciphering signal strength. For example, When the mountains are very low (regular and predictive) and are between the 2 red line (undervalued) or even possibly below the bottom red line, and the Ice on the mountains starts to curve into the mountains and then the Predictive and Regular Support Cross occur; this is a very strong Bullish Signal. But wait, that's not all, the cherry on top is when the volume mountain (black) is ALSO high while this occurs; the Volume Mountain adds Strength to the signal. When the volume mountain is high too during this ‘Perfect Combo’ this may potentially lead to very bullish price movement occurring soon. Here is an overview of each mountain:
2.1. Predictive: Are the least reliable, but they move first and nothing will move without the predictive moving first, and getting you ready.
2.2. Regular: Are the most accurate, they don't signify strength on its own, but they sure show some momentum.
2.3. Confirming: Are slightly behind when it comes to displaying data, and therefore shouldn't be used for entry / exit, but rather to show if the trend movement has truly been confirmed or not.
When the Ice starts to curve into the Mountain, (either upward or below) it signifies possible momentum change. There are Crosses (Bull), and Diamonds (Bear) to show when they've crossed. Cross' and Diamonds balance each other out and therefore there can never be more than 1 in a row (of the same type). When the Ice and Mountain size is very large (between 40 and 70), and the predictive Ice starts to curve into its mountain, and then the predictive curves into the Regular, and the Regular Ice is curving into its Mountain, then it may have some strong weight behind that signal.\nIMPORTANT: refer to Volume tooltip below for how to increase the signal strength even more.
3. Show Volume Ice and Mountains based on:
The Volume Ice and Mountains are for giving strength to the Price's signals and Size. When there is the perfect combo (described above) AND the Volume Ice + Mountain is high, then there may be a lot of strength to that Price signals (whether it is Cross (Bull), or Diamond (Bear)).
IMPORTANT: High volume mountains, unlike Price, don't mean good or bad. Volume shows strength to the Price, and therefore if there are high Volume mountains during a Diamond (Bearish), then there may be a lot of strength to that signal and vice versa.
4. Show Information Tables:
Information tables are used to display 6 different Time Frames and whether or not each time frame is in a state of Blood Diamond (red) or Support Cross (green). They also show how much % in price has changed since the current signal happened. These are very useful for seeing how the price is fairing on different Time Frames without having to constantly change your timeframe. For instance, maybe you base your entry off the 1 day time frame but then you swing trade on the 15 minute. Well, after you’ve confirmed your entry position and are sitting on the 15 minute, you can stay on the 15 minute and see how it is fairing on the 1 day, 5 minute or whatever time frame you choose. This way you aren’t distracted from the trade at hand. All of these Time Frames can be adjusted in the Settings (GUI) to whatever resolution you wish.
5. Res1 / Res2/ Res3 / Res4 / Res5 / Res6:
These represent the different resolutions (Time Frames) being used in your information tables and can be modified to display whatever resolution works best for your trading style. By default they are:
Res1: Current Timeframe
Res2: 15 Minute
Res3: 1 Hour
Res4: 4 Hour
Res5: 1 Day
Res6: 1 Week
Backup Res (not changeable): 5 Minute (this is only used if your Current Timeframe in Res1 is a duplicate of one of the other resolutions)
HAPPY TRADING!

BE - Volume Scalping ProDear Traders,
Here with presenting the new Indicator (Strategy) for scalping which is primarily built based on the the Volume Analysis.
Idea behind this Indicator: I am sure every trader would agree that Volume is one of the Leading indicator along with Price, and hence thought to use the same for scalping the trades. There is a direct co-relation between the price and volume and thereby used this as a base for arriving at strength of the volume pumped in. Indicator is working on the Logic of "What is the ROC in price for the volume dumped in and does ROC quantify the same which is happened in the recent past of x candles." In order to be successful in scalping trade, Accuracy, Risk to reward and Money Management is very much crucial and hence thought so much on this to make it happen.
Note: Accuracy here being profitable in the trade and not hitting the bulls eye all the time.
What this indicator is providing:
Based on the volume, ROC & Candle Thresholds and using the inputs provided for RISK and Money Management options, Indicator continuously scans for trading opportunities and provides alerts for possible trades.
Alerts & Notifications:
There are basically 3 types of Alerts provided one with General Notification and Other with Dhan HQ notifications to support Algo Trades and AlgoJi for supporting Algo trades too.
Self Declaration:
I have been testing the performance in 30 seconds and 1 min chart and I haven't faced any issues yet. I strongly recommend users to use the same in timeframe less than 10 Min only.
Enjoy!
DISCLAIMER: No sharing, copying, reselling, modifying, or any other forms of use are authorized for our documents, script / strategy, and the information published with them. This informational planning script / strategy is strictly for individual use and educational purposes only. This is not financial or investment advice. Investments are always made at your own risk and are based on your personal judgement. I am not responsible for any losses you may incur. Please invest wisely.
Happy to receive suggestions and feedback in order to improve the performance of the indicator better.

Ratings AlgoThe ratings algo is my discount version of the many paid-for algorithms put out by numerous different companies. A technical "rating" (by default between -10 and 10) is produced for each candle, telling the user when to buy, sell, or hold. I took 11 of my personal favorite indicators to develop a rating system. They are:
50/200 SMA crossover
10/20 SMA crossover
10/20 LSMA crossover
10/20 EMA crossover
"Arnold" a rate-of-change analysis of a smoothed LSMA
PVT and OBV momentum
MACD
RSI
DMI
Fisher Transform
The ratings system is very basic (a more complex, detailed version will be coming in the future!) where each indicator returns -1, 0, or 1, and the MAs and Oscillators are stratified with a user-defined weighting. The total calculation is based on the function:
maweight * (average of MA ratings) + oscillator weight * (average of osc ratings)
If the total value > user-defined threshold, the bar is teal, and if > 2.5 * threshold, is green, and vice versa for orange/red respectively. Purple is given if the total value is close to zero.
"Strong" signals are printed if the bar changes to either green or red and exits are printed if the bars change from green/red to any other color.
A table is also produced showing what each indicator is indicating, either "Buy" "Sell" or "Hold.
Reversal Bands are printed, intended to be used as areas where a trade might be exited if the market is sideways. If a Strong Buy signal is produced, it may be a good idea to enter the trade, and hold until the price enters the reversal bands, then hold until a candle closes outside the band for the first time.
This indicator truly shines in trending markets (like most indicators), but with very fast-acting exit signals and reversal zones, will facilitate minimal losses and possibly even profits in sideways markets.

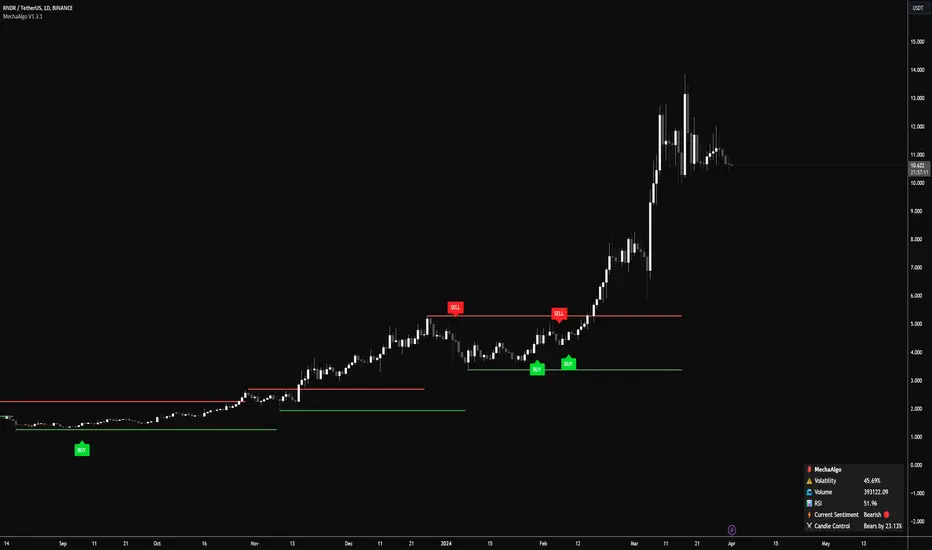
MechaAlgoWhat is MechaAlgo?
MechaAlgo was created to assist any type of trader on a day to day basis. Our intelligent and accurate algorithms turn complex charts into profitable plays, minimizing losses and maximizing profits. We hope that you will find use in the tools and resources we provide, and we will continue to improve on our products in order to take your trading to new heights!
Any Time, Any Market
Our indicators work with real time data on any market. This means that any kind of trader will find our tools useful, regardless of what you are trading.
Feature List
Multiple Signal Modes
Numerous Candle Coloring Modes
Reversal Cloud Overlay
Auto Support & Resistance
Auto Trendlines
Auto Profit Targets
Real Time Informational Dashboard
Multi-Timeframe Trend Panel
Future Trend Projection
Many More Features to Come!
By using this script you acknowledge that MechaAlgo cannot guarantee you profit, and that this product was only created in attempt to benefit traders. You also acknowledge that past performance is not indicative of future results, and that the experience of other users or what you see online may not always be your experience.
MM DonBased on the nnfx trading style this algorithms has many different calculations to provide the best signal and confirmations
1. The SuperSmooth Forecast Moving Average
2. TrendLine Moving Average
3. Smoothed Heiken Ashi Moving Average
4. Baseline that can change between 15 different moving averages
Buy/Sell Alarms for all the moving averages
Exit buy/sell Alarms
Entry
3 TP
ATR x1.5 Stop Loss auto generated per signal.
Also be able to set tp alarms for both buy/sell entries. so you place your trade and be alerted when your take profits have been hit.
works on all timeframes for scalpers, intraday, or even swing.
effective on binary as well.
Directions are simple
combine simple Market Structure & as long as everything matches (Buy Signal & everything is blue + baseline is white) (Sell Signal & everything is Red + Baseline is Red) you can enter the signal generated, exit the trade when told to exit and Manage your trade.
this was made to make trading easy and create confidence with in the trader.
Link below or PM us for access to this indicator Happy Trading

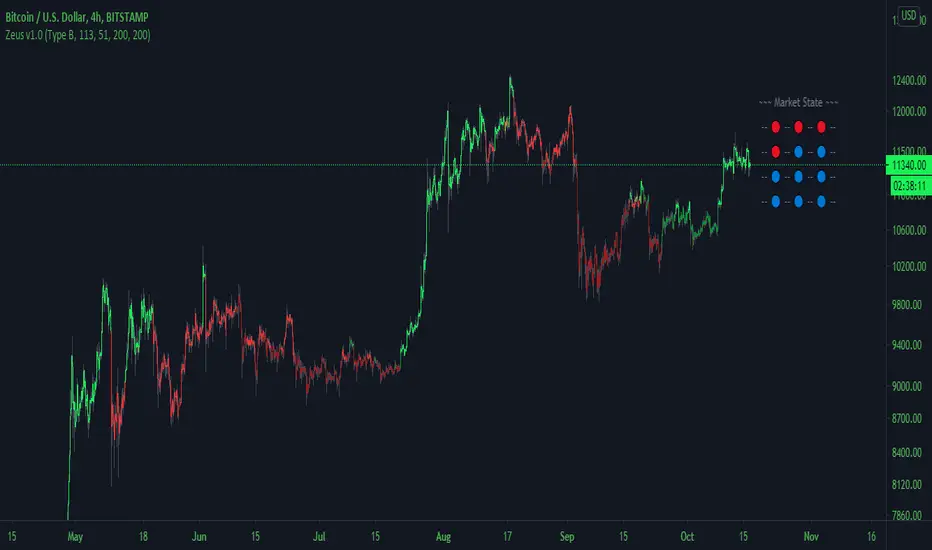
Zeus Trend DetectorAn exclusive trend detecting algorithm.
Contains the following addons, which can be activated or deactivated in the settings:
-- Zeus Cloud (Further Trend Analysis)
-- Market State Panel
-- Grey Indecision Zones
This is a premium script, that can be rented on a monthly basis.
PM if you are interested.
-Hawk
Optional Cloud Mode:
[GM PRO] VolatilityA highly customizable yet simple to use volatility indicator designed for algorithmic traders in mind.
Trend traders seek volume when entering a trade. Price action without volume is like a rocket without fuel -- it won't go very far.
In the Forex world, the actual volume is unknown, however with a good volatility indicator, we can more or less predict high/low volume periods relative to recent price action with a reasonable degree of accuracy.
This indicator uses standard deviations and moving averages to calculate when there is a strong price action, or weak/sideways price action.

(JS) Multi-Time Frame Pivot Point Detector 2.0So here's an updated version of my automatic Pivot Point detector.
If you don't like having a bunch of Pivots on your chart at once, or having to cycle through various resolutions to see different ones, this is for you!
What does this indicator do? It automatically detects the nearest daily, weekly, and monthly pivot points both above and below the current price and automatically plots them for you. It's really just as simple as that.
You select how far back you want it to plot with the "Pivot Point Look Back Period" option.
I also have transparency options for each type of pivot so its easy to find the opacity you prefer and save it as a default setting.
With "Turn Off Each Pivot Point On All Time Frames" turned on, as an example, if you were to uncheck "S1/R1" then it turns S1/R1 plots off across all 3 pivot resolutions. By default however, I have it set where you can pick and choose each one individually.
I also added the default "VWAP Periodic" script from TradingView in there with it (not in prior version). This works identical to the built in indicator (because it is identical).
Trading algorithms like to target pivot points and liquidity, so I figured they would pair together nicely for active trading.

Super AlgorithmIf you make a loss, I am not responsible for it. Please use this with caution that includes proper risk and money management.
When I see a sell signal, I may short &/or close my long.
When I see a buy signal, I may long &/or close my short.
The signal is most relevant for the exact time it comes on the chart. When the bar closes, it does not repaint.
The signal can show up and disappear on a running bar. It DOES NOT repaint once the bar is closed.
Do realize that on bar close, the price may have moved significantly, and the signal may not be relevant anymore. So, it needs to be used with caution whether one uses this as soon as a signal appears or on bar close. This is not suitable for the highly large timeframe (ake over 1day). I use it on 1 day and monthly on the lower timeframe.
My primary motivation for building this was three -
1) To ensure I am not addicted and not looking at the chart 24/7
2) To ensure I do not spend a lot of time & resources on multiple indicators
3) I have a consistent profit that can help me in my poor living expenses.
4) Recently, during the huge drawdown, I noticed that my other indicator () was unable to act as quickly as needed as the volatility happened in the lower timeframe. It made me realize that I need to do something to protect my capital in the future. Hence, the idea for this indicator.
5) I use this indicator alongside my other indicators that are showing the chart as well.
In the chart above, I am using
*
*
*
*
* And this indicator
You do not need to use all of these indicators. I have them always on my chart as I showed above.
The buy and sell shown with a blue background is the one coming from this indicator. The only thing that one can customize is colour.
This indicator differs significantly from my other indicators. This indicator prints less signal as careful work went in to reduce noise as much as possible and is to be used for 1 day or less tf.
I use it alongside other indicators for confirmation bias. The other indicators I use are the ones that come from me as well as shown on the chart.
This can possibly be used for other instruments. As I only use it for trading BTCUSD, I have crudely tested for BTCUSD after the dump and has been doing ok so far.
The code is written in Version 4 of pine script. If there are bugs, please let me know.
For info on gaining access see the ⬇ link below ⬇ in our signature field & direct message me. I have a busy schedule at my own workplace. Trading is my hobby. Hence, please be kind to me if I am late in replying

[GM ELITE] Dynamic - Setup AssistantAdditional Tool for Customers of Dynamic. Over 20 indicators built in. Separate Indicator windows to help setup GM Dynamic Algorithm. Toggle which indicator you want to view.

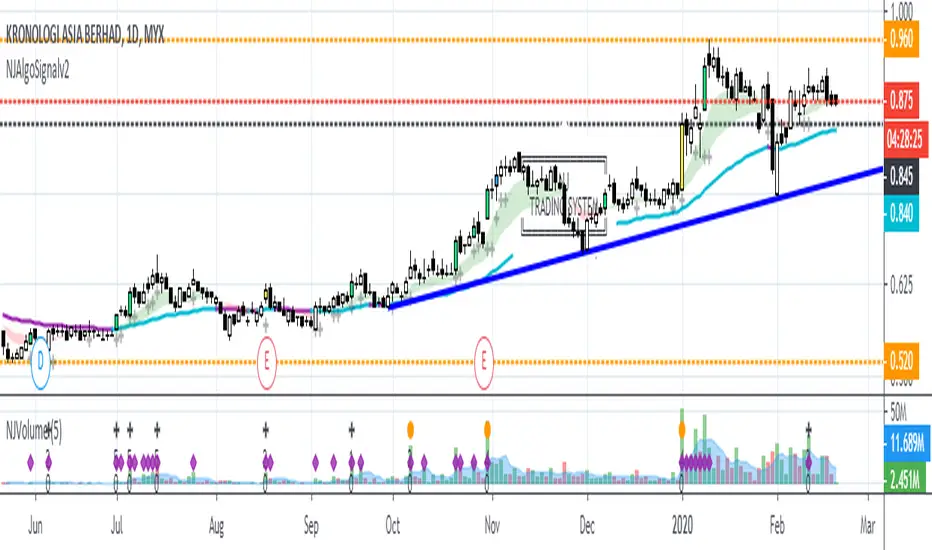
NJAlgoSignalv2NJ-ALGO-SIGNAL
Combination of Price Breakout with Volume
Bar Color
Yellow = Breakout with Volume and Trend Change
Lime = Breakout with Volume
Blue = Breakout without Volume
Black Line = Trailing Stop Line
Sell when price break the Stop Loss Line.
Try to entry on Yellow and Lime Candle.
Can consider to exit when Blue Candle occur. Sign of weakness on uptrend.
Label
Shows only when bar color condition meet
Calculate risk level based on the current price and trailing stop loss line (Black Line).
52W High
By default is off.
Background Color
To Indicate Bullish or Bearish zone.
Green = Bullish zone
Red = Bearish zone
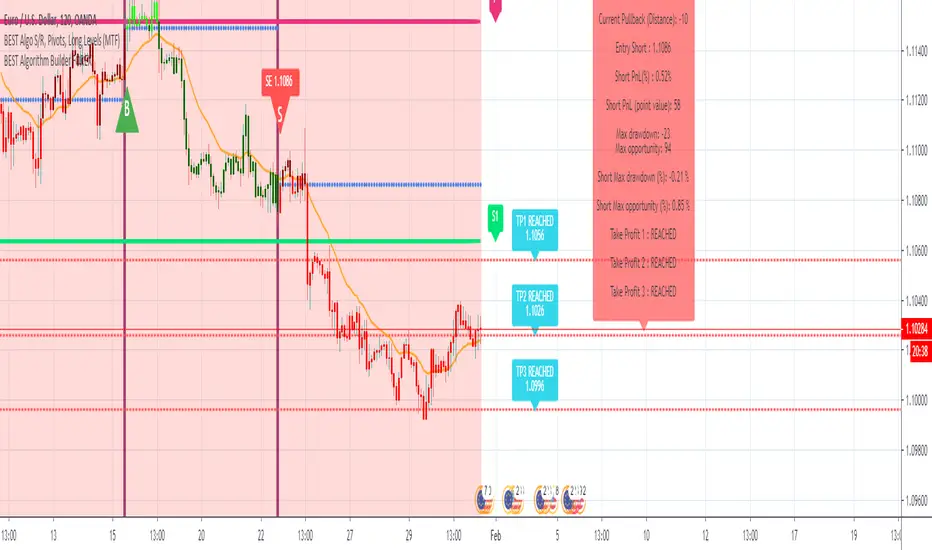
BEST Algorithm Builder FOREXHello traders 👋
I. 💎 SCRIPTS ACCESS AND TRIALS 💎
1. Every trial request access has to be done through my website.
2. My website URL is in this script signature at the very bottom (you'll have to scroll down a bit and going past the long description) and in my profile status available here: Daveatt
3. Many video tutorials explaining clearly how all our indicators work are available on our website > guides section and also on Discord + Youtube
4. You may also contact me directly for more information regarding the trading method included in the indicator or how to access it
II. Forewords
This indicator is for the Intraday FOREX traders looking for fixed entries based on our proprietary trading method.
We've been working on it for months and releasing now for our subscribers.
We designed this framework for FOREX major/minor/exotic pairs.
III. Optimized system for lowering risk/capturing most of the opportunities
We worked hard on reducing the risk as much as we could.
The built-in hard-exit (also called invalidation) system does a huge job in exiting a position way before a Stop Loss will get hit
EUR/USD
USD/CAD
IV. Trade Manager and compatible with dynamic alerts
It includes :
- our proprietary method with fixed entries
- a hard exit system (built-in stop-loss)
- multiple options for user-defined stop-loss/take-profit settings (price value, distance in pips, percentage, trailing, ...)
- 🔔 Compatible with dynamic alerts 🔔
Dynamic alerts are bringing automated trading to a whole new level. The third-party solutions capturing TradingView alerts are able to use them.
- Algorithmic Supports and Resistances used as safeguards and take profit zones
Final words
We made it as simple as we could (to be honest it's a very simple system for the end-user) - even with several hundreds of calculations in the indicator.
Please hit me up for any questions/feedbacks/comments
Become the BEST trader you deserve to be
Dave
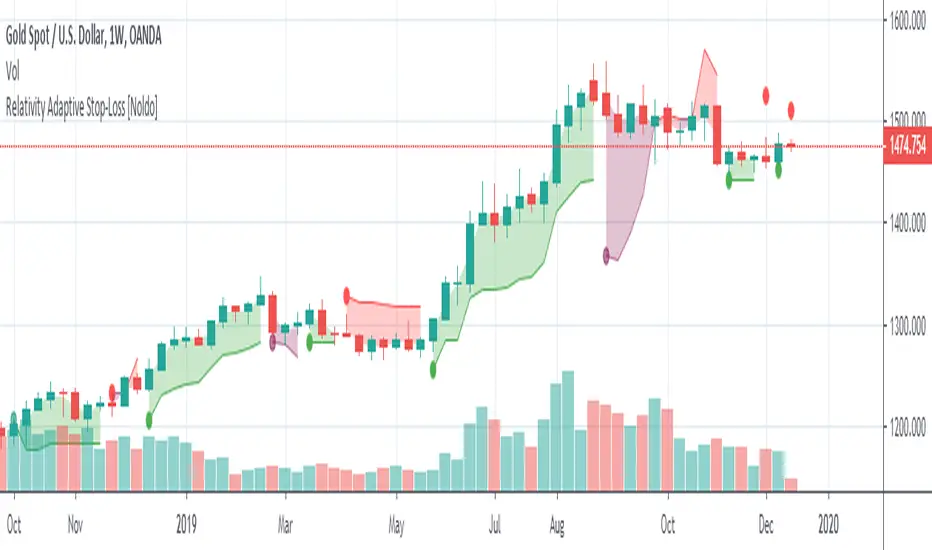
Relativity Adaptive Stop-LossRelativity Adaptive Stop-Loss is a stop-loss technique that uses the Relativity Autonomous Distribution Blocks algorithm.
For detailed info about Relativity Autonomous Distribution Blocks :
*** Features
This structure is different from standard stop-losses.
The base frame is based on "Market Adaptive Stop-Loss" script.
For detailed information about Market Adaptive Stop-Loss:
This script uses the Relativity Autonomous Distribution Blocks as cross method.
Tradeable / Non Tradeable Region Detector :
This script separates tradeable and non-tradeable regions with a coloring method.
Plotting Rules :
* Maroon : Uncorfirmed Short Positions
* Teal : Unconfirmed Long Positions
* Green : Confirmed Long Positions
* Red : Confirmed Short Positions
This script can be used in only 1W time frame. (TF = 1W )
Does not repaint on 1W and larger time frames. ( Source = close )
*** Settings :
The only option here is the ATR multiplier.
The default use value of this ATR multiplier, which is of the standard of stop-loss, is 2.You can set it from the menu.
No alert is set.
Because the positive and negative regions are the same as Relativity Autonomous Distribution Blocks.
Since the traders can trade according to the support and resistance outside the definite regions, the unnecessary signal was confused and the alerts were removed.
*** USAGE
The Stop-Loss indicator can slide on the chart.
So you have to make sure you put it in right place.
Using this script in a new pane below will radically solve slip problems.
Stop-Loss values do not slip definitely.The values can select from the alignment.
NOTE :
Some structures (Market Adaptive Stop-Loss) and design in this script are inspired by everget's Chandelier Exit script :
Best regards.
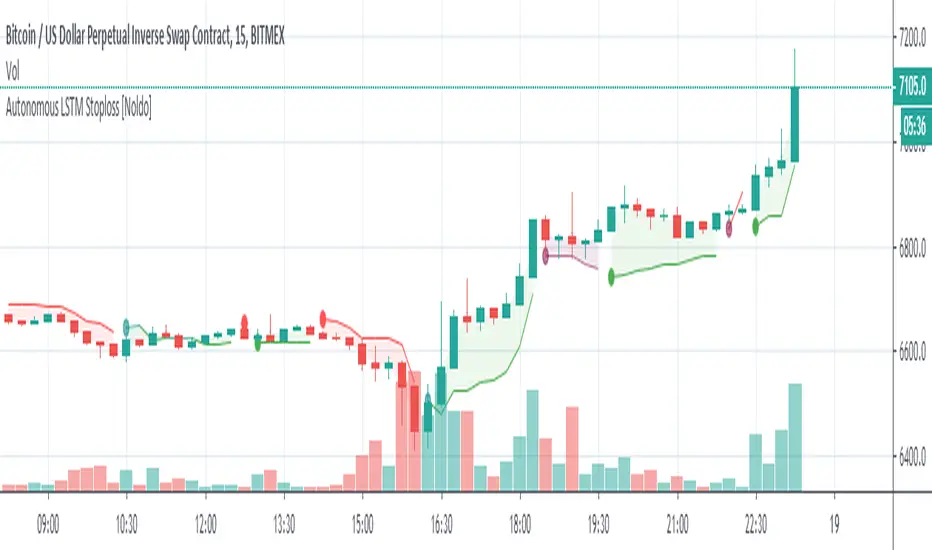
Autonomous LSTM Stop-LossStructure
Autonomous LSTM Stop-Loss is a stop-loss technique that uses the Autonomous LSTM algorithm.
For detailed info about Autonomous LSTM :
*** Features
This structure is different from standard stop-losses.
The base frame is based on "Market Adaptive Stop-Loss" script.
For detailed information about Market Adaptive Stop-Loss:
This script uses the Autonomous LSTM as cross method.
Tradeable / Non Tradeable Region Detector :
This script separates tradeable and non-tradeable regions with a coloring method.
Plotting Rules :
* Maroon : Uncorfirmed Short Positions
* Teal : Unconfirmed Long Positions
* Green : Confirmed Long Positions
* Red : Confirmed Short Positions
This script can be used in all time frames.
Does not repaint. ( Source = close )
*** Settings :
The only option here is the ATR multiplier.
The default use value of this ATR multiplier, which is of the standard of stop-loss, is 2.You can set it from the menu.
No alert is set.
Because the positive and negative regions are the same as Autonomous LSTM.
Since the traders can trade according to the support and resistance outside the definite regions, the unnecessary signal was confused and the alerts were removed.
*** Usage
The Stop-Loss indicator can slide on the chart.
So you have to make sure you put it in place.
Since this is a region scan from the OHLC levels, indicator contains small blue dots to the ohlc levels and made it serve as a guide.
However, since we cannot know the OHLC values precisely, it is best to use them as follows:
Because it is often forgotten to put it in place:
(OHLC : Average of Open, High, Low, and Closing prices for each period)
Using this script in a new pane below will radically solve slip problems.
Stop-Loss values do not slip definitely.The values are selected from the alignment.
NOTE :
Some structures (Market Adaptive Stop-Loss) and design in this script are inspired by everget's Chandelier Exit script :
Best regards.
Any MA bands (TMA bands V2)Hi everyone
Website will be opening very shortly :) Sorting out the last details and we're so excited to finally roll-out our different Algorithm Builders for you guys
Forewords
This present script is an evolution of the TMA bands . I would never have expected that script to become so popular to be honest
This is not only a study or idea but a really proven method and I'm glad that many of you are using it already. But please, whenever you see a new script out there, even if it looks cool and promising, please test it on a demo account for a week or on a LIVE account but with tiny amounts every time.
Many times, what you see on the chart is not what will happen in reality. I know that most of you will agree and I know exactly why we see this behavior... I'll give more details in a later post
I have plenty of methods like that one and I'll detail them on my website (and a bit on TradingView) starting next month
TMA bands on steroids
Someone asked me privately to make a generic version of the TMA bands and make it compatible with other standards Moving Average types. That's it for the specifications really as I didn't do much than re-using some piece of my own code
Suggested (but not mandatory) methodology
1) The Take Profit 1 is the middle line, Take Profit 2 is the opposite band.
2) Once the TP1 is hit, set your Stop Loss to breakeven
3) Once the TP2 is hit, if you still want to stay in the trade, set your Stop Loss to the TP1
It will be a powerful tool in your arsenal for some scalp/intraday trades
Wishing you all of you a great and profitable day
PS
It's strictly forbidden to republish this script without my explicit approval. All my posts are copyrighted from now on
Obviously you can use but not republish and get the credit or even worse... some money from your own clients
Dave
____________________________________________________________
Be sure to hit the thumbs up. Building those indicators take a lot of time and likes are always rewarding for me :) (tips are accepted too)
- If you want to suggest some indicators that I can develop and share with the community, please use my personal TRELLO board
- I'm an officially approved PineEditor/LUA/MT4 approved mentor on codementor. You can request a coaching with me if you want and I'll teach you how to build kick-ass indicators and strategies
Jump on a 1 to 1 coaching with me
- You can also hire for a custom dev of your indicator/strategy/bot/chrome extension/python
Disclaimer:
Trading involves a high level of financial risk, and may not be appropriate because you may experience losses greater than your deposit. Leverage can be against you.
Do not trade with capital that you can not afford to lose. You must be aware and have a complete understanding of all the risks associated with the market and trading. We can not be held responsible for any loss you incur.
Trading also involves risks of gambling addiction.
Please notice I do not provide financial advice - my indicators, strategies, educational ideas are intended to provide only some source code for anyone interested in improving their trading
The proprietary indicators and strategies developed by Best Trading Indicator, the object of intellectual property rights are and remain the exclusive property of Best Trading Indicator, at the exclusion of images and videos and texts free of rights or provided by the Company or external legal or physical person.
No assignment of intellectual property rights is carried out through these Terms and Conditions.
Any total or partial reproduction, modification or use of these properties for any reason whatsoever is strictly prohibited without the express written authorization of the Company.

RAT 3.0 Realtime Algo Trades/SignalsThis is the script which generates automatic signal for Buy and Sell in Stocks, Index , Crypto, Forex.
By using these signals we can execute the trades easily.
We can also combine this script to broker platform for placing the orders automatically when the signal gets generated.
It can be converted to fully automatic trading tool.

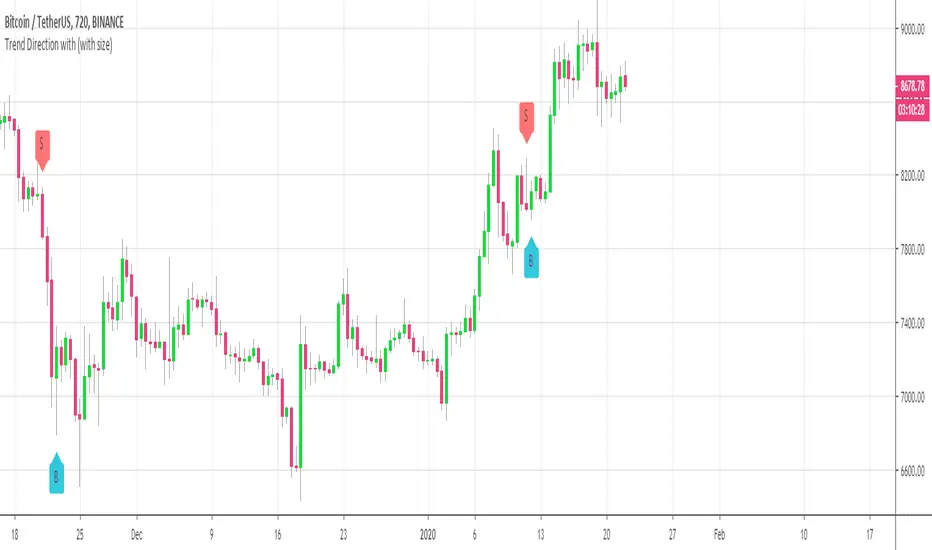
Customizable Trend Direction (Open-Source)Hello everyone
I received a ton of requests for this script so I decided to share it
I did it for a client who didn't want to pay (you can all blame... or even thank him for this script) in the end and I don't want to sell it on my website.
Not because it's not interesting but because my website will be a place to showcase and rent the Algorithm Builders mostly
What is it about?
Basically, it shows how you could convert a plotshape into a label.new object. Very interesting if you want someday to convert your V3 script into V4
With this script, it shows that you can in V4 ( but couldn't do in V3 ) do the followings :
- change dynamically the size (from tiny to huge) of any object
- change dynamically the text (from whatever to whatever) of any object
Screenshot of the user interface
imgur.com
Other use cases
I did it with the Trend Direction but could work with anything really.
- Any indicator with a visual signal. You can know personalized from a user interface the text, size and also the vertical shift. I didn't do it for that one but label.new takes a (x,y) coordinates so playing with y is fairly easy to achieve a dynamic vertical shift
- Even with this script Plotchar-How-to-draw-external-symbols-on-a-chart/ but would require to be updated with a label.new object and with a shape.none parameter so that we'll only see the icon/symbol displayed
- The colors also can be change dynamically using presets Presets-Selector-FRIDAY-NIGHT-CHALLENGE/ . If you have an indicator showing a BULLISH and a BEARISH signal, then you could, for instance, configure colors presets according to the timeframe of the chart or the indicator input, etc (sky is the limit ^^)
Be sure to hit the thumbs up at it motivates me to research what Pinescript can offer and share with the community
Dave
____________________________________________________________
- I'm an officially approved PineEditor/LUA/MT4 approved mentor on codementor. You can request a coaching with me if you want and I'll teach you how to build kick-ass indicators and strategies
Jump on a 1 to 1 coaching with me
- You can also hire for a custom dev of your indicator/strategy/bot/chrome extension/python
Momentum Signal Moving AverageThis is a script with one modified indicator that mainly tracks and executes positions openings by calculating volume and "enthusiasm" from the exchanges coin pairs. I recommend that it is used on a 15m chart.
When it is a bullish trend it is configured to take profit, but this is of course something you can set values or disable. In bearish trends, the script opens bigger positions, and when a bounce happens the script starts taking profit.
In stagnation, the script used to be week, and made losses. However, with the added scalping feature it seems to at least even it out, or even make profit as I have seen now.
It's still a very 1.0 script and will get updated to make sure the profit keeps getting higher percentage.
I use the Alerts Trader extension to execute orders from Tradingview in Chrome via Bitmex API.
I use it on Bitmex, but surely you can use it on other exchanges that are supported in the Alerts Trader extension, which is extensive.
Important : You will be able to add this script to your chart, but you won't be able to se the source code, so to make it work you need to set the alerts right, with correct code for it to work.
Here is where I come in:
I'll give each user 3 day trial, and after that, if you are satisfied and want to run it longer, you can subscribe for $49/month.
And if you have bigger capital, I will install it and configure it to match the amount of contracts you wish to have.
If you are a person with big capital, you can get 1 week of trial.
And for people with big capital, you can get personal support from me when needed to alter settings or create new alerts. This will cost $50 each time.
But remember, you can also run the trial on the Bitmex testnet, but the volume is very low there so the bot does not preform as well on the testnet as it does on the mainet with big volume.
I am willing to let someone, a 3rd party, with good reputation test it for a few days and make an honest review after.
Disclaimer: I cannot guarantee that this script will make you rich, but after a week of testing, both on testnet and mainnet, the results are good enough for me. (I am no financial expert or professional trader. Any losses from the algorithm is not my issue, use it at your own risk. Always run the script/bot with money you can afford to lose)
All payments to me are made in bitcoin.

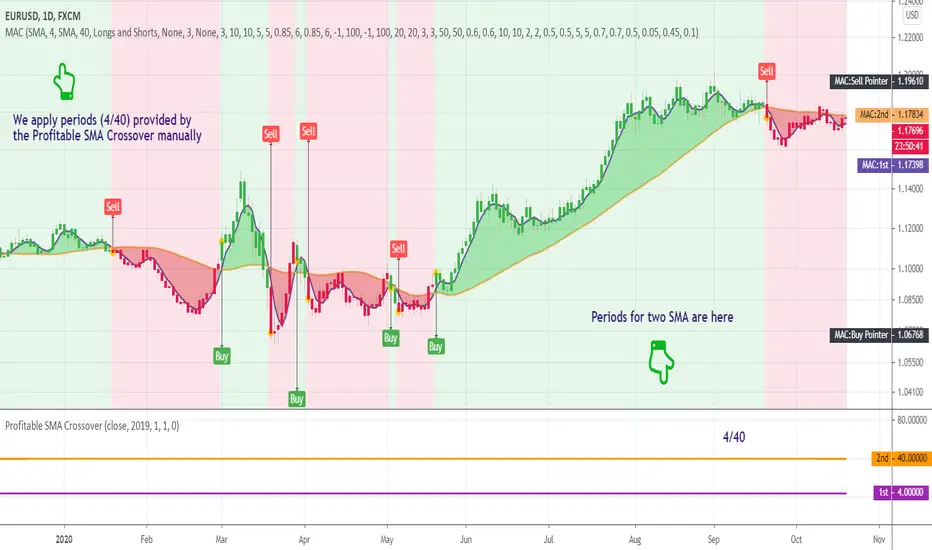
Profitable SMA CrossoverWhat is this tool?
This tool is a performance scanner of the crossover trading system that is based on the two simple moving averages (SMA). It uses a decision tree-based algorithm under the hood to find and plot the most profitable periods of the SMA combination.
It analyzes the range of periods between 4 to 45 and backtests each combination across the entire history of an instrument. If the more profitable periods were detected the indicator will switch periods of the moving averages immediately.
This is an add-on for the Ingenious SMA Crossover but can be used standalone.
Alerts
It has an alert that notifies when the more profitable periods were detected.
NOTE : It does not change what has already been plotted.
Good luck!
Ingenious SMA CrossoverIntroduction
A popular use for moving averages is to develop simple trading systems based on moving average crossovers. A trading system using two moving averages would give a buy signal when the shorter (faster) moving average advances above the longer (slower) moving average. A sell signal would be given when the shorter moving average crosses below the longer moving average. The speed of the systems and the number of signals generated will depend on the period of the moving averages.
What is this tool?
This tool is a crossover system of two simple moving averages. I called it "Ingenious" because it uses a decision tree-based algorithm under the hood to find and plot the most profitable SMA combination.
It analyzes the range of periods between 4 to 45 and backtests each combination across the entire history of an instrument. If the more profitable periods were detected the indicator will switch periods of the moving averages to the found ones immediately.
NOTE : It does not change what has already been plotted.
Good luck!

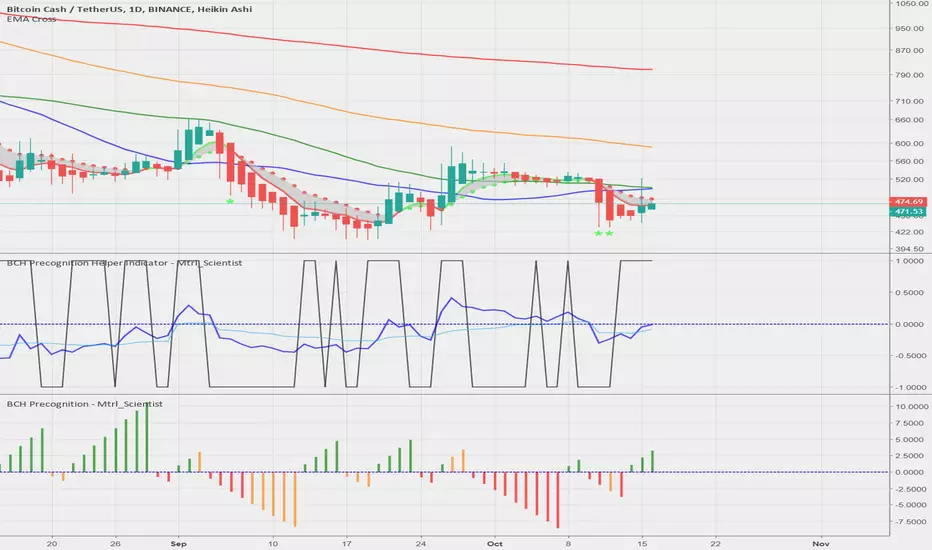
BCH Precognition - Mtrl_Scientist (study version)Hey everyone!
As requested, this is the study version of the improved 'BCH- Precognition' algorithm, meaning you'll only see the indicator and not have 'longs/shorts' painted on your chart.
- Works better with normal candles now, as internal calculations are forced to be done on Heikin Ashi, regardless of chosen candle format
- Turned into a study, rather than strategy, as not to interfere with strategies that are already in place
- Added Overbought/Oversold conditions (orange) with adjustable threshold, based on normalized price action helper indicator
Green means buy condition is valid, red mean short condition is valid, and orange means overbought/oversold (adjustable in settings).
Reminder: Only for use with BCHUSD, as it draws data for that coin from specific exchanges!
These changes were also added to the strategy version.
Please let me know what you would like to see improved!
Fibonacci Algo - LongAutomatic Fibonacci retracement entry, stop loss and extension target level as apart of a customisable strategy.
Automatic plots of 23.6% 38.2%, 50%, 61.8%, 65%, 78.6% and -23.6, -61.8% and -100% levels.
Customisable Fib Length - Time period over which max and min pivots are chosen.
Customisable Offsetfib - Offsets the pivots and sell zone as your entry position
will be some time after the upper and lower pivots are set.
Vegas Wave - Automatic plot. Shows price relative to wave and EMA crossover - See my 'Vegas Wave' code for more of an explanation.
A strategy based off buying the 50-618 with a defined stop loss the other side of the 65 or 786 can easily be formulated.
This tool will automatically plot those points but a defined Risk Management strategy will always be needed.
The 236 and 382 region can also be plotted, allowing for lesser retracements coinciding with wave 4 pullbacks ( Elliott Wave Traders).
Works best in Bullish trends but will work on all timeframes (Bullish correction in an downtrend also possible).
Previous pivots shown but be careful to identify which of the several pivots you are using.
Start at a larger timeframe and move down. (Entries consistent on several timeframes are golden)
Pivots and retracements are dynamic. Be sure to note your entry and targets.
Works well when used in combination with an oscillator which highlights Divergence.
Also refer to my other 'Fibonacci' Codes for more context.
