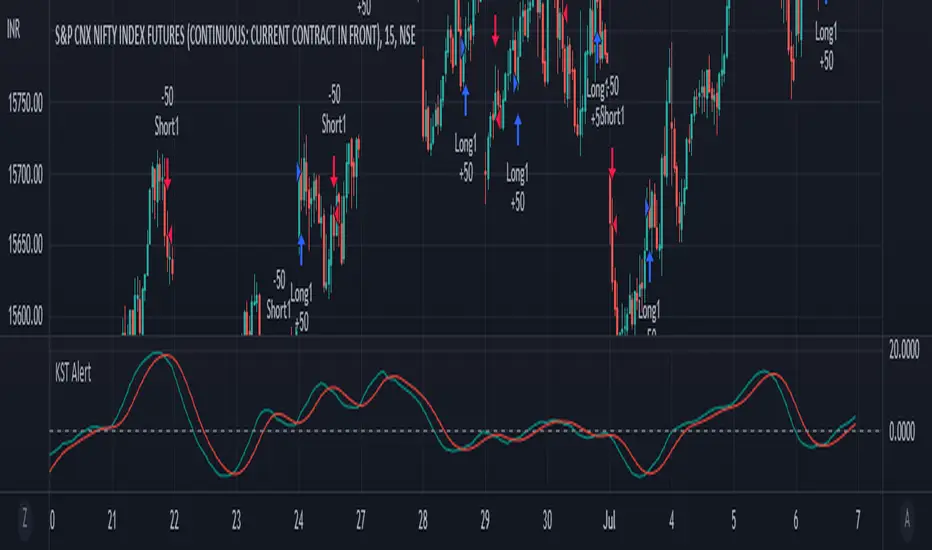
KST AlertJust added Alert condition to the default indicator
Default timeframe is set to 15m
Buy signal initiates when kst line crosses over signal line
Sell Signal initiates when kst line crosses under signal line
"alert" için komut dosyalarını ara
RSI Scalping & Swing Signals With AlertsThis RSI indicator shows a green or red ribbon when the smoothed RSI is bullish or bearish. It also includes a long moving average for overall trend confirmation. Wait until the ribbon holds above or below the long moving average and take positions in that direction.
To get an easier to read RSI indicator, I smoothed the RSI out and paired it next to a short term RMA. These two together form the ribbon that will show you early reversals and trend direction. The long moving average is used as an overall trend detector and confirmation for longer term trends.
***HOW TO USE***
Scalping: Enter longs when the ribbon turns green and enter shorts when the ribbon turns red. Exit positions when the ribbon turns the opposite color or crosses the long moving average.
Swing Trading: When the ribbon holds above the long moving average or breaks out and retests it, look for long positions and exit when the ribbon turns red or crosses the long moving average. When the ribbon holds below the long moving average or breaks down and retests it, look for short positions and exit when the ribbon turns green or crosses the long moving average.
***DETAILS***
This indicator gives early reversal signals very well and waiting for the RSI ribbon to cross the long moving average helps to get you into positions when the market is ready to really move while filtering out some of the noise.
The ribbon and background will change to green or red depending on whether it is currently bullish or bearish.
There is also a label that changes colors and tells you if RSI is bullish or bearish and also whether the RSI ribbon is above or below the long moving average.
Green or red circles will appear on the indicator when there is a bullish or bearish cross of the RSI ribbon and the long moving average.
It also has alerts that trigger when RSI is turning bullish/bearish or when the RSI ribbon is crossing the long moving average.
***CUSTOMIZATION***
Each piece of this indicator can be customized to suit your preferences including the RSI source, length, smoothing length, short moving average length and long moving average length. You can also turn off the labels, signals and long moving average. All of these settings can be managed within the indicator settings input tab.
***MARKETS***
This indicator can be used as a signal on all markets, including stocks, crypto, futures and forex.
***TIMEFRAMES***
This RSI Scalping & Swing Signals indicator can be used on all timeframes.
***TIPS***
Try using numerous indicators of ours on your chart so you can instantly see the bullish or bearish trend of multiple indicators in real time without having to analyze the data. Some of our favorites are Trend Friend Scalp & Swing Trade Signals, Volume Spike Scanner, Buy & Sell Pressure Volume Profile, and Momentum Scalper in combination with this RSI indicator. They all have real time Bullish and Bearish labels as well so you can immediately understand each indicator's trend.

Momentum Scalping & Swing Signals With AlertsThis Momentum indicator shows a green or red ribbon when smoothed momentum is bullish or bearish. It also includes a long moving average for overall trend confirmation. Wait until the ribbon holds above or below the long moving average and take positions in that direction.
To get an easier to read momentum indicator, I smoothed the momentum out and paired it next to a short term RMA. These two together form the ribbon that will show you early reversals and trend direction. The long moving average is used as an overall trend detector and confirmation for longer term trends.
***HOW TO USE***
Scalping: Enter longs when the ribbon turns green and enter shorts when the ribbon turns red. Exit positions when the ribbon turns the opposite color or crosses the long moving average.
Swing Trading: When the ribbon holds above the long moving average or breaks out and retests it, look for long positions and exit when the ribbon turns red or crosses the long moving average. When the ribbon holds below the long moving average or breaks down and retests it, look for short positions and exit when the ribbon turns green or crosses the long moving average.
***DETAILS***
This indicator gives early reversal signals very well and waiting for the momentum ribbon to cross the long moving average helps to get you into positions when the market is ready to really move while filtering out some of the noise.
The ribbon and background will change to green or red depending on whether it is currently bullish or bearish.
There is also a label that changes colors and tells you if momentum is bullish or bearish and also whether the momentum ribbon is above or below the long moving average.
Green or red circles will appear on the indicator when there is a bullish or bearish cross of the momentum ribbon and the long moving average.
It includes alerts that trigger when momentum is turning bullish/bearish or when the momentum ribbon is crossing the long moving average.
***CUSTOMIZATION***
Each piece of this indicator can be customized to suit your preferences including the momentum source, length, smoothing length, short moving average length and long moving average length. You can also turn off the labels, signals and long moving average. All of these settings can be managed within the indicator settings input tab.
***MARKETS***
This indicator can be used as a signal on all markets, including stocks, crypto, futures and forex.
***TIMEFRAMES***
This Momentum Scalping & Swing Signals indicator can be used on all timeframes.
***TIPS***
Try using numerous indicators of ours on your chart so you can instantly see the bullish or bearish trend of multiple indicators in real time without having to analyze the data. Some of our favorites are Trend Friend Scalp & Swing Trade Signals, Volume Spike Scanner, Buy & Sell Pressure Volume Profile, and RSI Scalper in combination with this momentum indicator. They all have real time Bullish and Bearish labels as well so you can immediately understand each indicator's trend.

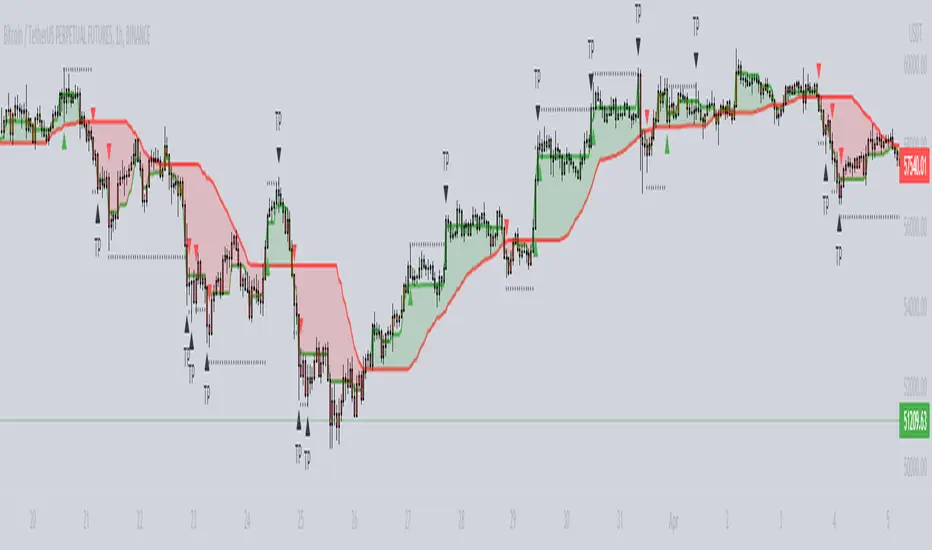
Big Snapper Alerts R3.0 + Chaiking Volatility condition + TP RSI//@version=5
//
// Bannos
// #NotTradingAdvice #DYOR
// Disclaimer.
// I AM NOT A FINANCIAL ADVISOR.
// THESE IDEAS ARE NOT ADVICE AND ARE FOR EDUCATION PURPOSES ONLY.
// ALWAYS DO YOUR OWN RESEARCH
//
// Author: Adaptation from JustUncleL Big Snapper by Bannos
// Date: May-2022
// Version: R1.0
//Description of this addon - Script using several new conditions to give Long/short and SL levels which was not proposed in the Big Snapper strategy "Big Snapper Alerts R3.0"
//"
//This strategy is based on the use of the Big Snapper outputs from the JustUncleL script and the addition of several conditions to define filtered conditions selecting signal synchrones with a trend and a rise of the volatility.
//Also the strategy proposes to define proportional stop losses and dynamic Take profit using an RSI strategy.
// After delivering the temporary ong/short signal and ploting a green or purple signal, several conditions are defined to consider a Signal is Long or short.
//Let s take the long signal as example(this is the same process with the opposite values for a short).
//step 1 - Long Definition:
// Snapper long signal stored in the buffer variable Longbuffer to say that in a close future, we could have all conditions for a long
// Now we need some conditions to combine with it:
//the second one is to be over the Ma_medium(55)
//and because this is not selective enough, the third one is a Volatility indicator "Chaikin Volatility" indicator giving an indication about the volatility of the price compared to the 10 last values
// -> Using the volatility indicator gives the possibility to increase the potential rise if the volatility is higher compared to the last periods.
//With these 3 signals, we get a robust indication about a potential long signal which is then stored in the variable "Longe"
//Now we have a long signal and can give a long signal with its Stop Loss
// The Long Signal is automatically given as the 3 conditions above are satisfied.
// The Stop loss is a function of the last Candle sizes giving a stop below the 70% of the overall candle which can be assimilated to a Fibonacci level. Below this level it makes sense to stop the trade as the chance to recover the complete Candle is more than 60%
//Now we are in an open Long and can use all the mentioned Stop loss condition but still need a Take Profit condition
//The take profit condition is based on a RSI strategy consisting in taking profit as soon as the RSI come back from the overbought area (which is here defined as a rsi over 70) and reaching the 63.5 level to trigger the Take Profit
//This TP condition is only active when Long is active and when an entry value as been defined.
//Entry and SL level appreas as soon as a Long or short arrow signal does appears. The Take profit will be conidtioned to the RSI.
//The final step in the cycle is a reinitialization of all the values giving the possibility to detect and treat any long new signal coming from the Big Snapper signal.

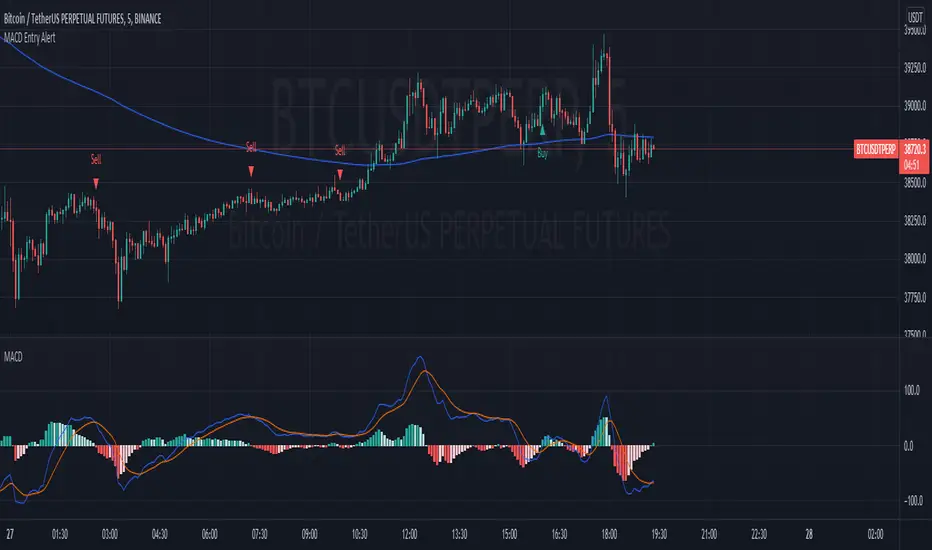
MACD Strategy AlertThis Indicator will only give you potential entry base on MACD strategy combine with a 200 EMA
-Sell when price under 200 ema and MACD is crossing the signal line above 0
-Buy when price above 200 ema and MACD is crossing the signal line under 0
-Sending Alert for each Potential Entry
OBV+EMA HistogramHistogram of the difference between On Balance Volume and an EMA of the On Balance Volume (OBV + EMA).
Using a 55 EMA, on the daily timeframe of BTC, bull/bear trends occur when the histogram is above/below the zero line respectively.
Divergences also have a notable effect.
-- Added alert conditions when OBV crosses EMA to signal a possible trend change, for bullish and bearish cases.

Oscillators Overlay w/ Divergencies/Alerts by DGTAn oscillator is a technical analysis tool that, simply said, gauge momentum, determine market trend direction and duration. For some oscillators, fluctuations are bounded by some upper and lower band, and traders use them to discover short-term overbought or oversold conditions.
Oscillators are often combined with moving average indicators to signal trend breakouts or reversals
Histogram, is the difference between the oscillator and signal lines, which oscillates above and below a center line and is used as a good indication of an asset's momentum
What to look for
- Signal Line Crossover is the most common signal produced by the oscillators
- Zero Line Crossovers have a very similar premise to Signal Line Crossovers
- Divergence , when the oscillator and actual price are not in agreement, is another signal created by the oscillators
- Overbought and Oversold , with any range-bound oscillator, conditions are a primary signal generated
Oscillators Overlay study
* Presents oscillators on top of the mian chart (price chart)
* A single indicator for many well known and custom oscillators
* Divergence detection
* Alerts for various condtions
The list of oscillators included;
- Awesome Oscillator (AO)
- Chaikin Oscillator (Chaikin Osc)
- Commodity Channel Index (CCI)
- Distance Oscillator
- Elder-Ray Bear and Bull Power
- Elliott Wave Oscillator (EWO)
- Klinger Oscillator
- Money Flow Index (MFI)
- Moving Average Convergence Divergence (MACD)
- Rate Of Change (ROC)
- Relative Strength Index (RSI)
- Stochastic (Stoch)
- Stochastic RSI (Stoch RSI)
- Volume Oscillator (Volume Osc)
- Wave Trend
In technical analysis, investors find oscillators to be important technical tools and consider them more effective when used in conjunction with other means of technical analysis
Disclaimer : Trading success is all about following your trading strategy and the indicators should fit within your trading strategy, and not to be traded upon solely
The script is for informational and educational purposes only. Use of the script does not constitutes professional and/or financial advice. You alone the sole responsibility of evaluating the script output and risks associated with the use of the script. In exchange for using the script, you agree not to hold dgtrd TradingView user liable for any possible claim for damages arising from any decision you make based on use of the script

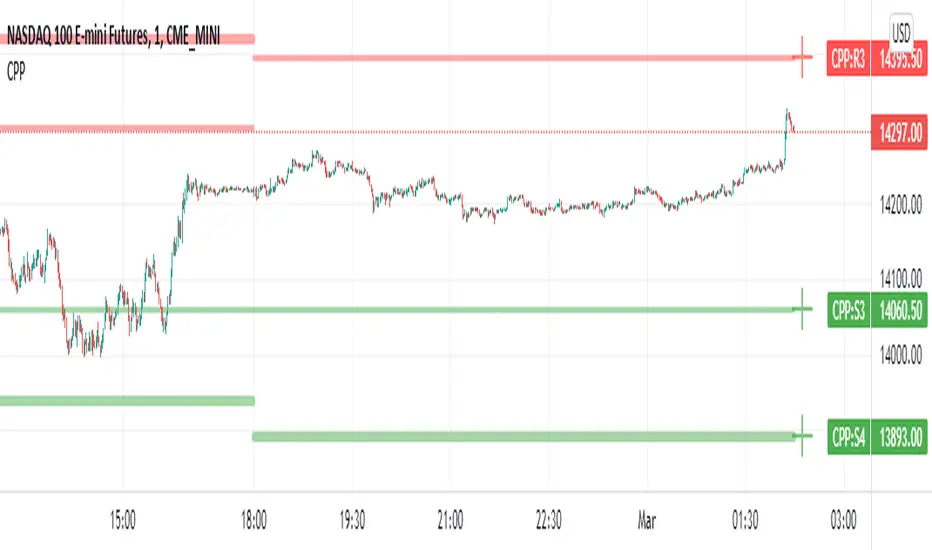
Camarilla Pivot Points L3/4 D/W with Labels AlertsThis version of the camarilla pivot points will provide daily or weekly S3, S4, R3 and R4 Levels.
This release is intended to help you declutter your charts by not having too many lines but still getting the benefit of clearly seeing where the key camarilla levels are, which can help with identifying market structure and potential market extremes.
It has the option to show or hide the lines to help unclutter your charts.
The lines can also be hidden by the user line transparency input, in which case the values will still appear on the scale.
It comes with a cross label for each pivot point that can be offset horizontally by user input. Per the screenshot, the intention is to have these labels adjacent to the right axis to clearly idenfity the pivot levels.
It also has alerts for each pivot point level
Multiple Timeframe continuity with Crossover Alerts█ OVERVIEW
This Indicator calculates the EMA 9/20 and the RSI with its SMA on multiple timeframes and indicates their crossings. In addition this script alerts the user when crossings appear.
█ USAGE
Use the checkboxes to activate different timeframes. With the dropdown menu you can select the timeframe in minutes.
Furthermroie use the checkboxes to activate different crossovers. At the end of the settings you can find the same options for the RSI.
You can also let the script indicate only the overlapping of both indicator crossovers by using the combination option.
█ KNOWLEDGE
EMA: The ema function returns the exponentially weighted moving average. In ema weighting factors decrease exponentially. It calculates by using a formula: EMA = alpha * source + (1 - alpha) * EMA , where alpha = 2 / (length + 1).
SMA: The sma function returns the moving average, that is the sum of last y values of x, divided by y.
RSI: The RSI is classified as a momentum oscillator, measuring the velocity and magnitude of price movements. Momentum is the rate of the rise or fall in price. The RSI computes momentum as the ratio of higher closes to lower closes: stocks which have had more or stronger positive changes have a higher RSI than stocks which have had more or stronger negative changes.
RMA: Moving average used in RSI. It is the exponentially weighted moving average with alpha = 1 / length.
(Source: TradingView PineScript reference & en.wikipedia.org)
█ Credits
Thanks to @KhanPhelan with his EMA 9/20 trading idea
Credits to TradingView for their RSI function
█ Disclaimer
This is my first Script, any feedback is welcome.
TPTR_Dynamic_Ratio_CorrelatorThe script provides a way to compute ratio between two indexes (or stocks) of your choice, and paints a "up-arrow" below the first candle where and when the value of the ratio exceeds your threshold of choice.
It also creates a table summarizing the value of your securities, and the value of the ratio below.
The script will also alert you with a message (automatically) when the ratio of your security_1 and security_2 exceeds the ratio.

EMA/MA Cross + BB + Alerts Short hand notes - I made this for friend and I. Unsure how to share it with him so made it public.
u/ tmyerskerry for the math on slope and look back period (look back period isn't perfect for slope calculation as 200ma is slow moving so some signals are goign to be strong instead of weak and visa versa. If you know a better way than i'm all ears!
Can set mutliple EMA's and MA's.
Default BB built in. Couldn't figure out how to set default shadow transparency so you will have to turn it down.
Added red and green lines that indicate when price has gone above and below the BB shadow.
Added arrows for when EMA1 crosses EMA2. Right now set for 9 + 32. And depending on MA200 color changes if its with the trend or against.
Alerts in the works. (please don't ask for them as i'm doing this part time and don't know pinescript)

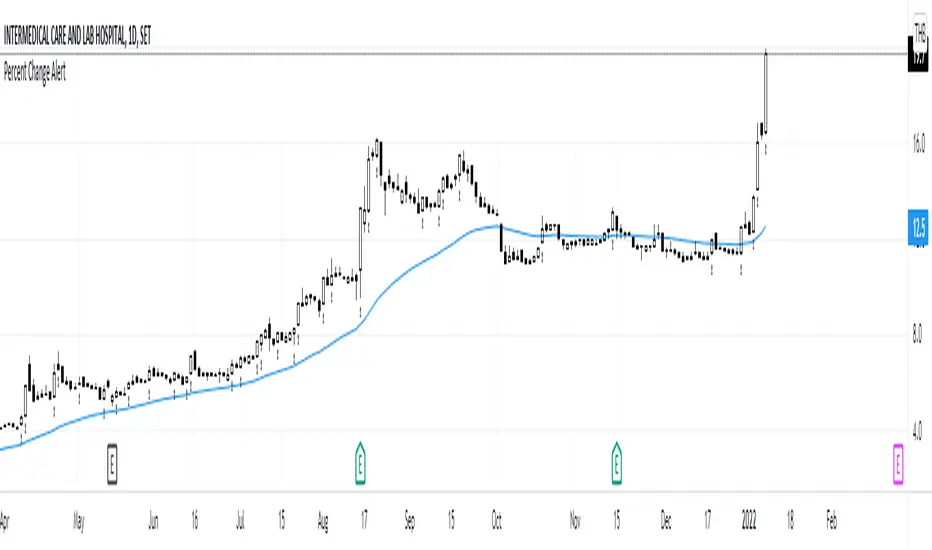
Percent Change AlertUse for alert setting
1st condition = percent change from close price yesterday > 0
2nd condition = volume today > volume yesterday 30%
if both condition is happened at the same time it will show the signal (Black arrow below bar)
[JL] Stochastic Divergence AlertCompare two cross area:
k is increasing, low is lower and previous k is less than bottom level then it is bottom divergence
k is decrease, high is higher and previous k is more than top level then it is top divergence
With long term moving average(400), seems that Stochastic Divergence is more accurate than RSI Divergence on 1m chart.

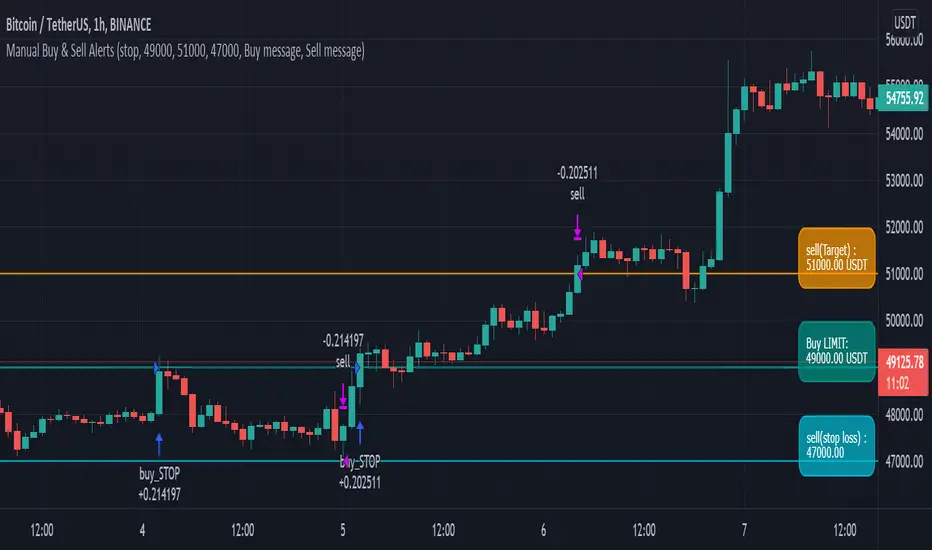
Manual Buy & Sell AlertsThis strategy is not an automation strategy.
It is a tool that generates an 'alerts' so that you can buy and sell it at a predetermined price.
The user can set the contents below.
1. Period
2. Entry price and entry type.
1) buy STOP
2) buy LIMIT
3. Target price.
4. stop loss price.
You can easily test by changing the period value and the set value.
I hope it will help you. Thank you.
BTCUSDTPERP MEGABOT 60min [ALERTS VERSION]BINANCE:BTCUSDTPERP
Hello, this is my alerts version of BTCUSDTPERP MEGABOT 60min
THIS BOT IS ONLY FOR BTCUSDTPERP ON BINANCEFUTURES !!!!!!!!!!!!!!!!!!!!!!!!!!!!!!!!!!!!!!!!!
This configs are only for this pair on this market,
It depends of volume , and others indicator
Bot is making amazing results at configs
TP - 4.5%
SL - 7%
Strategy using 4 indicators :
ADX
RSI
VOLUME
MACD
ADX - makes a solid view to trend without any scam wick :
Long only on green bars
Shorts only on red bars
That's helps my strategy to define a right trend
there is also a orange option for unidentified trends
RSI - value helps strategy to stop trade in right time
When RSI is overbought strategy don't open new longs
also when RSI is oversold strategy don't open new shorts
Volume - volume is the most important indicator for the strategy,
to avoid open trades on flat chart, new trades are open after a strong volume
wicks
MACD - this indicator is for define the trend
So the way this bot is working is simple
when every arguments are confirmed , then strategy open trades
Enjoy !!!

PYRAMIDING BTCUSDTPERP1H [ALERTS VERSION]BINANCE:BTCUSDTPERP
Hello
This my upgraded (ALERTs) version of my previous bots, uses diffrent indicators
WARING
THIS STRATEGY WORKS ONLY ON BTCUSDTPERP ON BINANCE 60MIN (like my previous ones) !!!!!!!!!!!!!!!!!!!!!!!!!!!!!!!!!!!!!!!!!!!!!!!!!!!!!!!!!!!!!!!!!!!!!!!!!!!!!!!!!!!!!!!!!!!!!!!!!!!!!!!!!
- it depends on specyfic volume and wick based on binance
Soo, I was tried to make a bot with more trades to make more real results.
Trends are change, and the problem with configuration on bots is that, while we searching the best cofigurations , this was best configuration in the past,
to prepare bot for the futures moves , we have to make as much trades as possible.
This bot is pure definition of pyramiding, uses 2 entries, and when all the conditions are true, then will open a trades
The way it works is simple, bot use 6 difrent indicators to open longs/shorts and for the define trend
This specific configuration works the best at
TP: 1.4%
SL: 9%
This is bot only for lev 1x
Dont try it for bigger leverage, becouse when sl hits, which sometimes happend, the lost will be huge
Why sl is so big?
Bot is programed to replace sl with other entries
for example
close longs and open shorts
normal lose is around 3-5% (while trend is changed), so sl will only destroys results
this bot using 6 difrent indicators:
ADX
RSI
VOLUME
RANGE FILTER
MA 5-10-30
MACD by KivancOzbilgic
ADX - makes a solid view to trend without any scam wick :
Long only on green bars
Shorts only on red bars
That's helps my strategy to define a right trend
there is also a orange option for unidentified trends
RSI - value helps strategy to stop trade in right time
When RSI is overbought strategy don't open new longs
also when RSI is oversold strategy don't open new shorts
Volume - volume is the most important indicator for the strategy,
to avoid open trades on flat chart, new trades are open after a strong volume
wicks
RANGE FILTER- this indicator is for the better view of trends, define trends
MA 5-10-30 - like previous ones this is for better view of trends, and correctly define the trends
MACD by KivancOzbilgic - this indicator is based of MACD RELOADED by Kivanc Ozbilgic
Also like previous ones, indicator should help defined correct trends
Enjoy ;)
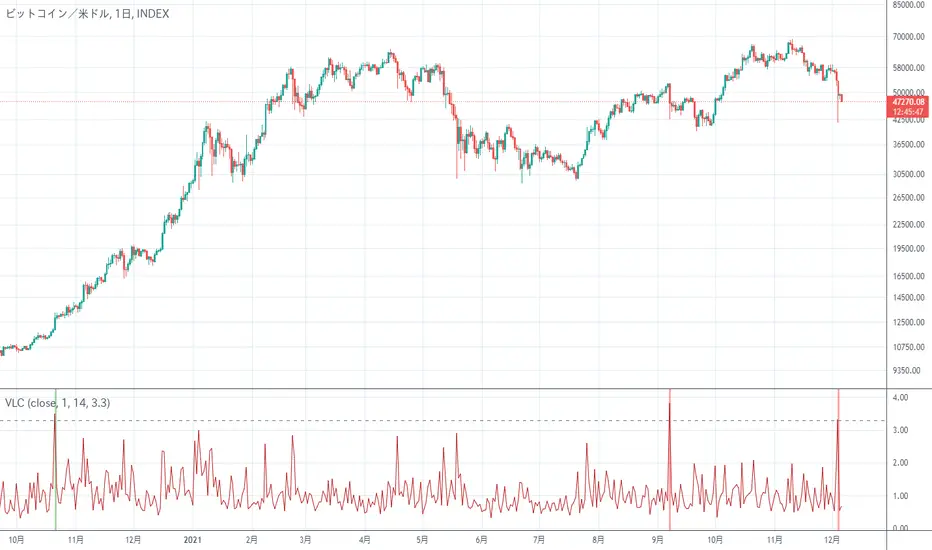
Very Long Candlestick Alert 長いローソク足を検出It is an indicator that only detects long candlesticks.
May alert you when the market crashes
Depending on the chart, it may be necessary to adjust the Threshold of the setting
長いローソク足を検出するだけのインジケーターです
相場がクラッシュした時にアラートをならせるかもしれません
チャートによっては設定のThresholdを調整する必要があります
P-Signal Strategy & AlertThanks to your advices I removed in this version something that was not necessary for the strategy but added alert and the chart of the current state of the strategy (white 1 - in trade, 0 - out of trade).

ICHIMOKU Crypto Swing AlertThis is a crypto swing alert for the strategy with the same name designed for timeframes bigger than 1h.
The main components are
ICHOMOKU
KDJ
Average High
Average Low
Rules for entry
For long: we have the ichimoku crosses between tenkan and baselines, we have a rising kdj line and at the same time we have a increase in the average high
For short: we have the ichimoku crosses between tenkan and baselines, we have a falling kdj line and at the same time we have an increase in the average low
Rules for exit
We exit when we have inverse conditions than the initial ones used for entry.
Caution
This strategy does not use a risk management, so be careful with it !
If you have any questions let me know !

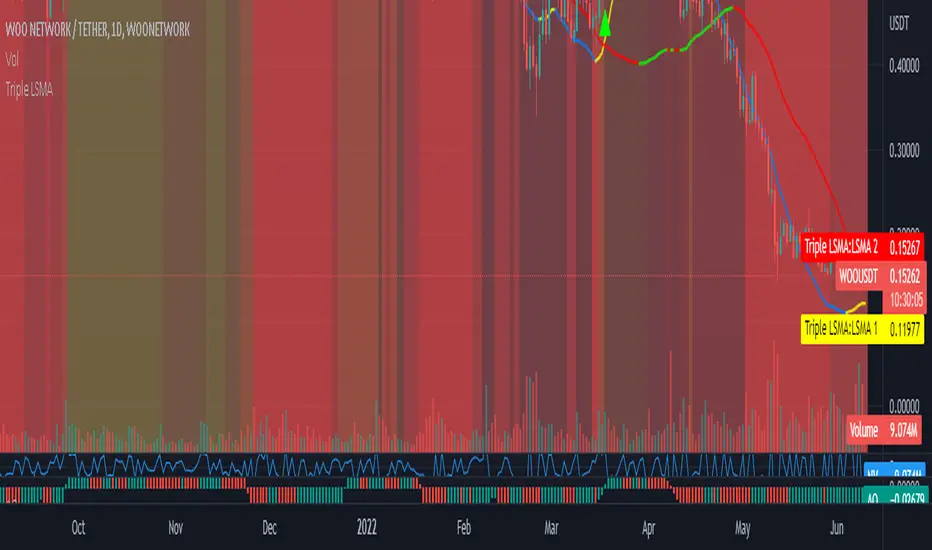
Triple Colored Least Squares Moving Average + Crossover AlertsThis script is forked from the ‘ Double Colored Least Squares Moving Average + Crossover Alerts ‘ from @IronKnightmare.
First release & notes : 2021-11-03.
Overview:
The Least Squares Moving Average is used mainly as a crossover signal to identify bullish or bearish trends. When a shorter duration line cross a longer one a trend can be identified. When multiple lines or the price action cross a longterm trend the confirmation can be further validated. Tradingview contains already some indicators with 1 or two LSMA trendlines that can be configured and toggled.
The original script that I forked had two LSMA lines that could be plotted with other valuable functions, I added a third for further confirmation as some trading systems will use three lines or some combination of those for validation.
Usage:
In inputs
- You will see LSMA 1, LSMA 2 & LSMA 3. The default values are 40, 100 & 400 representing the number of periods plotted by that line : fast, medium and slow changing trendlines will be plotted. The offset value and source are standard for most scripts.
In Style
- You can toggle LSMA 1, 2 or 3 and any combination of those. There are much more possibilities this way.
- For each LSMA, Color 0 & Color 1 are for coloring the slope of the trendline,
- Color 0 for rising slope,
- Color 1 for descending slope.
- The script will automatically color the rise or fall of the trendline accordingly. You can also set one identical color in both slopes for one unique color.
- The ‘ Long Crossover 1 on 2 ’ is a signal for when the LSMA 1 cross over the LSMA 2, usually a shorter periods trendline, more volatile, climbing over the medium term one. A Signal will be traced on the chart at that crossing, you can configure this. The ‘Short Crossover 1 on 2’ is when the LSMA 1 cross under the LSMA 2, a signal will be traced on the chart accordingly.
- The Long Crossover 1 on 3 & Short Crossover 1 on 3 act on the same principle, although the crossing of the fast LSMA on the long / slow LSMA are used. Both can be toggled.
- The ‘ Background Coloring Line 1 : 0-Neutral, 1-Up, 2-Down ’ is an optional background coloring for the LSMA1 line. This can provide additional information at a quick glance, especially if you combine the two other lines backgrounds, the partial transparency will compound.
Bollinger bands dynamic alertsThis triple Bollinger script is very useful for options traders to determine the trend condition. When the trend stays within 1 sigma limits it is termed as "congestion", breakout of congestion starts the "trending" phase and the big breakout termed "Blowout" happens when the underlying crosses the 2sigma and reaches 3 sigma limits in very short time at steep trend angles. The script provides dynamic alerts as soon as the underlying breaks out of these zones and enables options traders to stay in the trade longer. www.tradingview.com

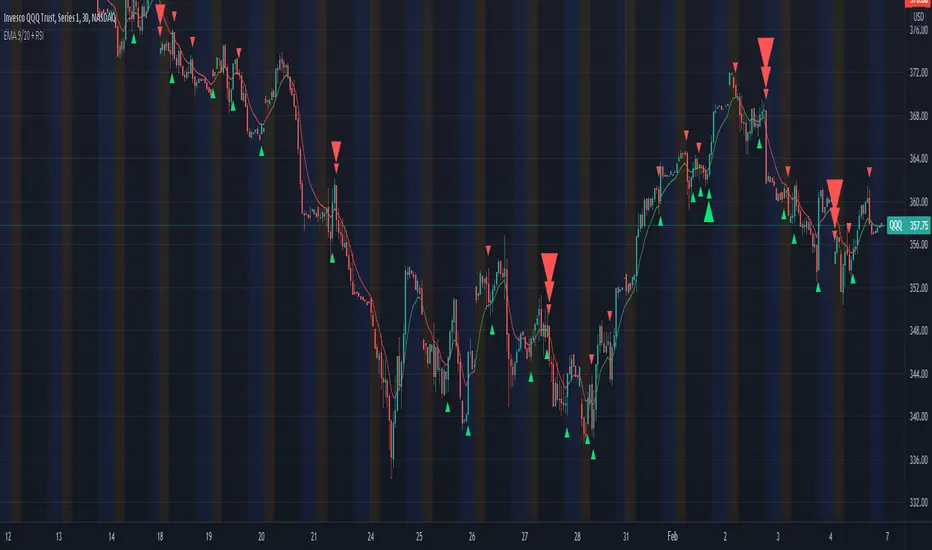
Scalping EMA ADX RSI with Buy/Sell AlertsThis is a study indicator that shows the entries in the strategy seen in one of the youtube channel so it does not belong to me. I can't tell who it is because it's against the House Rules to advertise but you can find out if you look for it on youtube. Default values of oscilators and ema adjusted as suggested. He says he got the best results in 5 min timeframe but i tried to make things as modifiable as possible so you can mess around with the settings and create your own strategy for different timeframes if you'd like. Suggested to use with normal candlestick charts. The blue line below indicates the ADX is above the selected threshold set in the settings named "Trend Ready Limit". You can set alerts for Buy, Sell or Buy/Sell signal together.
The entry strategy itself is pretty straight forward.
The rules for entry are as follows, the script will check all of this on auto and will give you buy or sell signal :
Recommended time frame: 5 min
For Long Entry:
- Check if price above the set EMA (Can disable this rule if you'd like in the settings)
- RSI is in Oversold
- ADX is above set "Trend Ready" threshold (Meaning there is a trend going on)
- Price must approve the trend of previous candles. This is bullish for buy entries and bearish for sell entries.
- Enter with stop loss below last swing low with 1:1 or 1.5:1 take profit ratio.
For Short Entry:
- Check if price below the set EMA (Can disable this rule if you'd like in the settings)
- RSI is in Overbought
- ADX is above set "Trend Ready" threshold (Meaning there is a trend going on)
- Price must approve the trend of previous candles. This is bullish for buy entries and bearish for sell entries.
- Enter with stop loss above last swing high with 1:1 or 1.5:1 take profit ratio.
This is my first indicator. Let me know if you want any updates. I am not sure if i can add everything but i'll try nonetheless.
Changed: Signals will check up to 2 candles before if the RSI is below or above the set value to show signal. This is because sometimes the entry signal is right but the response might be a bit late.
