3MA/EMA Alerts指标名称(中文/英文)
中文名:多均线趋势指标(带上穿与金叉提醒)
英文名:Multi MA/EMA Trend Indicator (with Price & Golden Cross Alerts)
指标功能介绍(中文)
多均线趋势指标(带上穿与金叉提醒) 是一个可自定义的均线工具,适用于趋势分析和交易信号提醒。
核心功能:
多均线显示
默认显示 EMA20,EMA80/200 可选择显示
每条均线可独立选择 EMA 或 SMA
自定义颜色和线宽
价格上穿均线提醒
当价格向上突破任意开启的均线时触发提醒
可用于捕捉短线趋势启动点
金叉提醒
当短期均线向上穿过中长期均线时触发提醒
可用于捕捉潜在的趋势反转或加速
中文 UI
参数和提醒信息均为中文,便于快速理解和使用
适用场景
趋势确认
趋势反转捕捉
短线入场和长期持仓参考
Indicator Description (English)
Multi MA/EMA Trend Indicator (with Price & Golden Cross Alerts) is a customizable moving average tool for trend analysis and trading alerts.
Key Features:
Multiple Moving Averages
Default display: EMA20; EMA80/200 optional
Each MA can be set as EMA or SMA individually
Customizable colors and line widths
Price Cross Alerts
Alerts when price crosses above any active MA
Helps identify short-term trend initiation points
Golden Cross Alerts
Alerts when a short-term MA crosses above a mid/long-term MA
Useful for detecting trend acceleration or reversal signals
User-Friendly Interface
Parameters and alerts are labeled in Chinese (can be translated)
Applications
Trend confirmation
Trend reversal detection
Short-term entries and long-term position guidance
"alert" için komut dosyalarını ara

EMA 200 MultiTF G/R + Cross Alerts by LifeHack Trader1. Indicator Setup
The script starts by defining the version of Pine Script (v5) and creating an indicator called "EMA 200 MultiTF G/R + Cross Alerts by LifeHack Trader."
The overlay=true parameter ensures that the indicator is plotted directly on the price chart.
2. Function to Get EMA200
A custom function getEma200 is defined to retrieve the 200-period Exponential Moving Average (EMA) for a specified timeframe (tf).
This function uses the request.security function to fetch the close price's EMA from different timeframes.
3. Calculate EMA200 for Multiple Timeframes
The script calculates the EMA200 for four timeframes: 15 minutes ("15"), 1 hour ("60"), 4 hours ("240"), and 1 day ("D").
These values are stored in variables (ema15, ema1h, ema4h, ema1d) and represent the EMA for each timeframe.
4. Determine Price Above or Below EMA200 (G/R)
For each timeframe, the script checks whether the closing price is above or below the EMA200.
It uses boolean checks to determine if the price is above the EMA200, assigning the status "G" (Green) for above and "R" (Red) for below.
5. Cross Signal Detection (Up/Down)
The script detects crossovers and crossunders between the price and EMA200 for each timeframe.
A crossover signal is detected when the price crosses above the EMA200 (bullish), and a crossunder signal is detected when the price crosses below the EMA200 (bearish).
These signals are stored in separate variables (crossUp, crossDown).
6. Display a Table with G/R Status and Cross Alerts
A table is created and displayed in the top-right corner of the chart. The table shows the status (G or R) for each timeframe and the cross signal (▲ for crossover, ▼ for crossunder, or - for no cross event).
The table is updated with the respective values for each timeframe every time a new bar is formed.
7. Alert Conditions
The script defines alert conditions based on the crossovers and crossunders.
When a price crosses above the EMA200 (cross-up), an alert is triggered for a potential buy opportunity. When the price crosses below the EMA200 (cross-down), an alert is triggered for a potential sell opportunity.
Alerts are configured for each timeframe (15 minutes, 1 hour, 4 hours, and 1 day).
This script provides a comprehensive system for monitoring price action relative to the EMA200 on multiple timeframes, highlighting crossovers, and delivering visual feedback and alerts based on the price's relationship with the EMA.

15/30M Alerts"X Candle Close":
Same as in 5m Enter alert: it's really helpful to wait for a 15m/30m candle to be confirmed, to see f. e. whether a candle really broke a support / resistance or not - and to prevent making bad decisions.
More infos: www.reddit.com

Painel Técnico (4H x 1D) — Clean UI + Alertas BrenoG📋 Main Functions
1️⃣ Analysis in two fixed timeframes
4 hours and 1 day analyzed in parallel.
Each column in the table displays the data for its respective timeframe.
2️⃣ Entry point based on oversold conditions
The “entry point” is not the current price, but rather the last candle that went into oversold territory (RSI ≤ configured threshold).
If there has been no recent oversold condition, the current price is used as a fallback.
All calculations (Buy Zone, Stops, TPs) are based on this point.
3️⃣ Buy Zone
Defined as:
java
Copiar
Editar
Low Zone = entry * (1 - width%)
High Zone = entry
Always visible in the table, but alerts can be set to trigger only if RSI is oversold at the moment of entry.
4️⃣ Automatic Stops
Moderate Stop and Conservative Stop, calculated as a % below the entry point.
Displayed in the table with black text on a gray background for emphasis.
Alerts trigger when price crosses below these levels.
5️⃣ Take Profits (TP1–TP4)
Calculated from the entry point:
By percentage (usePercentTP = true) or
By fixed prices (usePercentTP = false).
The table displays:
Target price
% gain over the entry point
They only appear when RSI > 50 and EMA50 > EMA200 (the “alignment” condition).
Alerts trigger only on breakouts upward.
6️⃣ Context Indicators
RSI → shows numeric value and green/red color.
MACD → indicates if the MACD line is above or below the signal line.
EMAs 50/200 → indicates “Golden Cross” or “Death Cross”.
Price vs EMA200 → dedicated row showing “Above” or “Below EMA 200” with green/red color.
7️⃣ Visual Panel
Semi–transparent dark gray background, thin borders.
Colored header:
Blue for 4H
Orange for 1D
Rows separated by data type for easy reading.
Configurable font size (tiny to large).
Table position configurable (top_left, top_right, etc.).
8️⃣ Integrated Alerts
Entry/Exit of Buy Zone
Touch of each TP
Touch of each Stop
RSI entering Oversold
All alerts are separated by timeframe with clear, fixed messages.
📌 Simple Summary:
It’s an intelligent panel that combines multi–timeframe technical analysis, automatic calculation of entries/stops/TPs based on oversold conditions, and ready–to–use alerts — all presented in a visual, compact, and fully configurable format.

Aggregate PDH High Break Alert**Aggregate PDH High Break Alert**
**Overview**
The “Aggregate PDH High Break Alert” is a lightweight Pine Script v6 indicator designed to instantly notify you when today’s price breaks above any prior-day high in a user-defined lookback window. Instead of manually scanning dozens of daily highs, this script automatically loops through the last _N_ days (up to 100) and fires a single-bar alert the moment price eclipses a specific day’s high.
**Key Features**
- **Dynamic Lookback**: Choose any lookback period from 1 to 100 days via a single `High-Break Lookback` input.
- **Single Security Call**: Efficiently retrieves the entire daily-high series in one call to avoid TradingView’s 40-call security limit.
- **Automatic Looping**: Internally loops through each prior-day high, so there’s no need to manually code dozens of lines.
- **Custom Alerts**: Generates a clear, formatted alert message—e.g. “Crossed high from 7 day(s) ago”—for each breakout.
- **Lightweight & Maintainable**: Compact codebase (<15 lines) makes tweaking and debugging a breeze.
**Inputs**
- **High-Break Lookback (days)**: Number of past days to monitor for high breaks. Valid range: 1–100.
**How to Use**
1. **Add to Chart**: Open TradingView, click “Indicators,” then “Create,” and paste in the code.
2. **Configure Lookback**: In the script’s settings, set your desired lookback window (e.g., 20 for the past 20 days).
3. **Enable Alerts**: Right-click the indicator’s name on your chart, select “Add Alert on Aggregate PDH High Break Alert,” and choose “Once per bar close.”
4. **Receive Notifications**: Whenever price crosses above any of the specified prior-day highs, you’ll get an on-screen and/or mobile push alert with the exact number of days ago.
**Use Cases**
- **Trend Confirmation**: Confirm fresh bullish momentum when today’s high outpaces any of the last _N_ days.
- **Breakout Trading**: Automate entries off multi-day highs without manual chart scanning.
- **System Integration**: Integrate with alerts to trigger orders in third-party bots or webhook receivers.
**Disclaimer**
Breakouts alone do not guarantee sustained moves. Combine with your preferred risk management, volume filters, and other indicators for higher-probability setups. Use on markets and timeframes where daily breakout behavior aligns with your strategy.

Delta Volume Histogram with Filters and AlertsОписание (Russian):
Индикатор "Delta Volume Histogram" определяет дельту объёма и отображает её в виде гистограммы. Он показывает разницу между объёмами покупок и продаж, с возможностью фильтрации значений и вызова алертов.
Функции:
Фильтр для отображения только значений выше заданного порога.
Режим отображения всех значений выше нуля.
Алерт при появлении дельты, превышающей установленный фильтр.
Description (English):
The "Delta Volume Histogram" indicator calculates volume delta and displays it as a histogram. It highlights the difference between buy and sell volumes, with options for filtering values and triggering alerts.
Features:
Filter to display only values above a specified threshold.
**Features (continued):**
- Mode to display both positive and negative delta values above the zero line for better visualization.
- Alert functionality that notifies you when the delta volume exceeds the specified filter value.
This indicator is ideal for traders who want to track buying and selling pressure in the market, helping to identify strong movements and potential reversals based on volume delta analysis.

Enhanced Trading Alerts# Enhanced Multi-Symbol EMA Trading System with Smart Alerts
## 📊 Overview
A powerful multi-symbol trading system that monitors up to 6 symbols simultaneously for high-probability trading setups using advanced EMA crossover strategies, enhanced with volume confirmation and RSI filters. Perfect for swing traders and position traders focusing on quality tech stocks.
## 🎯 Key Features
- **Multi-Symbol Monitoring**: Simultaneously tracks 6 different symbols
- **Advanced EMA Strategy**: Uses dual EMA system (320 & 820 periods) for trend confirmation
- **Volume Validation**: Confirms signals with volume surge analysis
- **RSI Filter**: Adds momentum confirmation to avoid false signals
- **Smart Risk Management**: Automatic stop-loss and take-profit calculations
- **Detailed Alerts**: Comprehensive alert messages with key price levels
## 📈 Trading Signals
### Buy Signals Generated When:
- Price crosses above the slow EMA (820)
- Fast EMA (320) confirms the trend
- RSI is in optimal range (not overbought)
- Volume surge confirms the movement
- Risk levels automatically calculated
### Sell Signals Generated When:
- Price crosses below the slow EMA (820)
- Fast EMA (320) confirms the downtrend
- RSI confirms momentum shift
- Volume surge validates the movement
## ⚙️ Customizable Parameters
- **EMA Lengths**: Adjust fast and slow EMA periods
- **Volume Threshold**: Set minimum volume surge multiplier
- **RSI Settings**: Customize overbought/oversold levels
- **Risk Management**: Adjustable stop-loss and take-profit percentages
- **Symbol Selection**: Choose any 6 symbols to monitor
## 🎨 Visual Elements
- Blue line: Fast EMA (320)
- Red line: Slow EMA (820)
- Purple line: RSI indicator
- Clear visual representation of trend changes
## 📱 Smart Alerts
Detailed alert messages include:
- Symbol name and signal type
- Current price level
- RSI value
- Stop-loss price
- Take-profit target
- Volume surge multiplier
## 💡 Best Practices
1. **Timeframe Selection**:
- Best suited for 1H, 4H, or Daily timeframes
- Can be adapted for swing or position trading
2. **Risk Management**:
- Use suggested stop-loss levels
- Follow take-profit targets
- Consider volume confirmation strength
3. **Multiple Chart Setup**:
- Create multiple instances for more symbols
- Group correlated assets together
- Use different alert sounds for different setups
## 🎓 Usage Tips
- Monitor strongest tech stocks for best results
- Combine with market sentiment analysis
- Use volume surge as quality filter
- Wait for all conditions to align before trading
- Consider overall market conditions
## ⚠️ Risk Warning
This indicator is for informational purposes only. Always conduct your own analysis and consider your risk tolerance before trading. Past performance does not guarantee future results.
## 📌 Version History
- v1.0: Initial release with multi-symbol support
- v1.1: Added volume surge confirmation
- v1.2: Enhanced alert system with risk levels
- v1.3: Added RSI filter and improved signal quality
## 🔄 Regular Updates
Subscribe to this script for regular updates and improvements. Feel free to suggest features in the comments section.
## 📗 Default Symbols
- TSLA (Tesla)
- NVDA (NVIDIA)
- AVGO (Broadcom)
- TSM (Taiwan Semiconductor)
- META (Meta Platforms)
- AMZN (Amazon)
You can customize these symbols to match your trading preferences.
Good luck trading! 🍀

Engulfing Candles Alert - Multi Symbol (Miu)This indicator plots triangle shapes on each engulfing candles (bullish or bearish) on current chart.
The main use for this indication is to set alerts on multiple symbols at once.
Please follow steps below to set your alarms:
1) Add indicator to the chart
2) Go to settings
3) Check symbols you want to receive alerts (choose up to 8 different symbols)
4) Check if you want only bullish or bearish alerts or both
5) Once all is set go back to the chart and click on 3 dots to set alert in this indicator, rename your alert and confirm
6) You can remove indicator after alert is set and it'll keep working as expected
What does this indicator do?
This indicator will generate alerts anytime a candle closes and reaches bullish or bearish engulfing condition for any of symbol set.
Alert messages example: "Bullish alert on {Symbol}"
This script requests open and close information for each symbol through request.security() built-in function.
Detailed indicator description:
If current bar open is less than or equal to the previous bar close AND current bar open is less than previous bar open AND current bar close is greater than previous bar open THEN True
bullishEngulfing = (openBarCurrent <= closeBarPrevious) and (openBarCurrent < openBarPrevious) and (closeBarCurrent > openBarPrevious)
The opposite condition will be bearishEngulfing
Feel free to give feedbacks on comments section below. Enhancement suggestions are welcome =).
Enjoy!

Digital Clock with Market Status and AlertsDigital Clock with Market Status and Alerts - 日本語解説は下記
Overview:
The Digital Clock with Market Status and Alerts indicator is designed to display the current time in various global time zones while also providing the status of major financial markets such as Tokyo, London, and New York. This indicator helps traders monitor the open and close times of different markets and alerts them when a market opens. Customizable options are provided for table positioning, background, text colors, and font size.
Key Features:
Real-Time Digital Clock: The indicator shows the current time in your selected time zone (Asia/Tokyo, America/New_York, Europe/London, Australia/Sydney). The time updates in real-time and includes hours, minutes, and seconds, providing a convenient and accurate way to monitor time across different trading sessions.
Global Market Status: Displays the open or closed status of major financial markets.
・Tokyo Market: Open from 9:00 AM to 3:00 PM (JST).
・London Market: Open from 16:00 to 24:00 during summer time and from 17:00 to 1:00 during winter time (JST).
・New York Market: Open from 21:00 to 5:00 during summer time and from 22:00 to 6:00 during winter time (JST).
Customizable Display:
・Background Color: The indicator allows you to set the background color for the clock display, while the leftmost empty cell can be independently customized with its own background color for table alignment.
・Clock and Market Status Colors: Separate color options are available for the clock text, market status during open, and market status during closed periods.
・Text Size: You can adjust the size of the text (small, normal, large) to fit your preferences.
・Table Position: You can position the digital clock and market status table in different locations on the chart: top left, top center, top right, bottom left, bottom center, and bottom right.
Alerts for Market Opening: The indicator will trigger alerts when a market (Tokyo, London, or New York) opens, notifying traders in real-time. This can help ensure that you don't miss any important market openings.
How to Use:
Setup:
Apply the Indicator: Add the Digital Clock with Market Status and Alerts indicator to your chart. Customize the time zone, text size, background colors, and table position based on your preferences.
Monitor Market Status: Watch the market status displayed for Tokyo, London, and New York to keep track of market openings and closings in real-time.
Receive Alerts: The indicator provides built-in alerts for market openings, helping you stay informed when a key market opens for trading.
Time Monitoring:
・Real-Time Clock: The current time is displayed with hours, minutes, and seconds for accurate tracking. The clock updates every second and reflects the selected time zone.
・Global Time Zones: Choose your desired time zone (Tokyo, New York, London, Sydney) to monitor the time most relevant to your trading strategy.
Market Status:
・Tokyo Market: The status will display "Tokyo OPEN" when the Tokyo market is active, and "Tokyo CLOSED" when it is outside of trading hours.
・London Market: Similarly, the indicator will show "London OPEN" or "London CLOSED" depending on whether the London market is currently active.
・New York Market: The New York market status follows the same structure, showing "NY OPEN" or "NY CLOSED."
Customization:
・Table Positioning: Easily move the table to the desired location on the chart to avoid overlap with other chart elements. The leftmost empty cell helps with alignment.
・Text and Background Color: Adjust the text and background colors to suit your personal preferences. You can also set independent colors for open and closed market statuses to easily distinguish between them.
Cautions and Disclaimer:
・Indicator Modifications: This indicator may be updated without prior notice, which could change or remove certain features.
・Trade Responsibility: This indicator is a tool to assist your trading, but responsibility for all trades remains with you. No guarantee of profit or success is implied, and losses can occur. Use it alongside your own analysis and strategy.
Digital Clock with Market Status and Alerts - 解説と使い方
概要:
Digital Clock with Market Status and Alerts インジケーターは、さまざまな世界のタイムゾーンで現在の時刻を表示し、東京、ロンドン、ニューヨークなどの主要な金融市場のステータスを提供します。このインジケーターにより、複数の市場のオープンおよびクローズ時間をリアルタイムで監視でき、市場がオープンする際にアラートを受け取ることができます。テーブルの位置、背景色、テキストカラー、フォントサイズなどのカスタマイズが可能です。
主な機能:
リアルタイムデジタル時計: 選択したタイムゾーン(東京、ニューヨーク、ロンドン、シドニー)の現在時刻を表示します。リアルタイムで更新され、時間、分、秒を正確に表示します。
世界の市場ステータス: 主要な金融市場のオープン/クローズ状況を表示します。
・東京市場: 午前9時~午後3時(日本時間)。
・ロンドン市場: 夏時間では16時~24時、冬時間では17時~1時(日本時間)。
・ニューヨーク市場: 夏時間では21時~5時、冬時間では22時~6時(日本時間)。
カスタマイズ可能な表示設定:
・背景色: 時計表示の背景色を設定できます。また、テーブルの左側に空白のセルを配置し、独立した背景色を設定することでテーブルの配置調整が可能です。
・時計と市場ステータスの色: 時計テキスト、オープン市場、クローズ市場の色を個別に設定できます。
・テキストサイズ: 小、標準、大から選択し、テキストサイズをカスタマイズ可能です。
・テーブル位置: デジタル時計と市場ステータスのテーブルをチャートのさまざまな場所(左上、中央上、右上、左下、中央下、右下)に配置できます。
市場オープン時のアラート: 市場(東京、ロンドン、ニューヨーク)がオープンするときにアラートを発し、リアルタイムで通知されます。これにより、重要な市場のオープン時間を逃さないようサポートします。
使い方:
セットアップ:
インジケーターを適用: チャートに「Digital Clock with Market Status and Alerts」インジケーターを追加し、タイムゾーン、テキストサイズ、背景色、テーブル位置を好みに応じてカスタマイズします。
市場ステータスを確認: 東京、ロンドン、ニューヨークの市場ステータスをリアルタイムで表示し、オープン/クローズ時間を把握できます。
アラートを受け取る: 市場オープン時のアラート機能により、重要な市場のオープンを見逃さないように通知が届きます。
時間管理:
・リアルタイム時計: 現在の時刻が秒単位で表示され、選択したタイムゾーンに基づいて正確に追跡できます。
・グローバルタイムゾーン: 東京、ニューヨーク、ロンドン、シドニーなど、トレードに関連するタイムゾーンを選択して監視できます。
市場ステータス:
・東京市場: 東京市場が開いていると「Tokyo OPEN」と表示され、閉じている場合は「Tokyo CLOSED」と表示されます。
・ロンドン市場: 同様に、「London OPEN」または「London CLOSED」が表示され、ロンドン市場のステータスを確認できます。
・ニューヨーク市場: ニューヨーク市場も「NY OPEN」または「NY CLOSED」で現在の状況が表示されます。
カスタマイズ:
・テーブル位置の調整: テーブルの位置を簡単に調整し、チャート上の他の要素と重ならないように配置できます。左側の空白セルで位置調整が可能です。
・テキストと背景色のカスタマイズ: テキストと背景の色を自分の好みに合わせて調整できます。また、オープン時とクローズ時の市場ステータスを区別するため、独立した色設定が可能です。
注意事項と免責事項:
・インジケーターの変更: このインジケーターは、予告なく変更や機能の削除が行われる場合があります。
・トレード責任: このインジケーターはトレードをサポートするツールであり、トレードに関する全責任はご自身にあります。利益を保証するものではなく、損失が発生する可能性があります。自分の分析や戦略と組み合わせて使用してください。

ORB - Alerts, VWAP and MACD Checks, Extended Fib Levels
ORB Range Alerter with Shading, VWAP Check, MACD Check, and Extended Fibonacci Levels for TP – Fully Customizable
This indicator is designed to give you a comprehensive analysis of the Opening Range Breakout (ORB) combined with advanced conditions based on VWAP and MACD indicators, along with Extended Fibonacci Levels for both long and short TP positions.
Key Features:
Opening Range Breakout (ORB):
Defines the opening range at the market open (9:30 AM by default) based on your chart timeframe and shades it for visibility.
The high and low of the first candle after the open are plotted on the chart, creating a breakout range that traders can use to identify potential long or short positions.
VWAP Condition (Optional):
This indicator includes the option to enforce the VWAP (Volume-Weighted Average Price) as a condition for entering trades.
- Longs will only trigger if the price is above VWAP (when enabled).
- Shorts will only trigger if the price is below VWAP (when enabled).
Customizable : You can enable or disable the VWAP condition through a simple checkbox in the indicator’s settings.
MACD Condition (Optional):
Includes an optional MACD (Moving Average Convergence Divergence) condition.
- Longs will only trigger if the MACD line is above 0 and the signal line, providing confirmation of bullish momentum.
- Shorts will only trigger if the MACD line is below 0 and the signal line, indicating bearish momentum.
Customizable : You can enable or disable the MACD condition through a checkbox in the indicator’s settings, allowing you to trade with or without the MACD confirmation.
Fibonacci Extensions for Profit Targets:
Automatically calculates Fibonacci extension levels based on the ORB range for TP levels.
These levels provide key areas for potential profit-taking or reversal points.
Fibonacci extensions are plotted only after a confirmed breakout, either long or short.
The extensions include 127.2%, 161.8%, 200%, 261.8%, 423.6%, and 685.4%, offering a comprehensive set of targets for different trading strategies.
Shading of ORB Range:
The ORB high and low are visually emphasized on the chart with a shaded area for easy identification.
The shading is semi-transparent to help keep your chart clean and easy to read.
Customizable Timeframe:
The ORB range is defined based on the time of day (default is 9:30 AM to 4:00 PM), but you can adjust the timeframe to suit different trading sessions or markets.
Alerts for Breakouts:
Built-in alerts notify you when price crosses above or below the ORB high or low, along with the optional VWAP and MACD conditions.
Alerts can be used to create automated notifications or even execute automated trades based on your chosen settings.
How to Use:
Long Trade Example: When the price crosses above the ORB high, VWAP is above the price, and MACD shows bullish momentum (if these conditions are enabled), a potential long entry is triggered. You can use the Fibonacci extensions for profit targets.
Short Trade Example: When the price crosses below the ORB low, VWAP is below the price, and MACD confirms bearish momentum (if these conditions are enabled), a short entry is triggered. Fibonacci levels for the short position can guide your exit strategy.
Flexibility: You can enable or disable both VWAP and MACD conditions based on your trading style. This flexibility allows the indicator to adapt to different market conditions and strategies.
Customization Options:
Enable/Disable VWAP Condition: Decide if you want to include VWAP as a trade filter.
Enable/Disable MACD Condition: Choose whether to require MACD as confirmation for trade entries.
Adjust ORB Timeframe: Customize the time range for defining the ORB based on the market you're trading.
Fibonacci Extensions: Visualize key profit targets using Fibonacci extensions, which are automatically calculated and displayed after a breakout.

Time Zone Box & Alerts (Simplified)### Description
This Pine Script indicator is designed for TradingView and provides functionality for drawing time-based boxes on the chart, as well as generating alerts and labels. It is particularly useful for visualizing specific time ranges within each trading day and managing alerts based on those time intervals.
#### **Features:**
1. **Box Drawing for Specific Time Ranges**:
- **Time Interval Customization**: Allows users to specify the start and end times for the box using inputs (e.g., from 9:30 AM to 12:30 PM). The box will automatically adjust based on these times.
- **Historical Data**: The script calculates the high and low prices within the specified time range and draws a box accordingly. This box will be created for each trading day, capturing all relevant historical data within the defined time interval.
2. **Dynamic Alerts**:
- **Custom Alerts**: Users can define custom alert messages for specific times within the trading day (e.g., before and after the trading range). Alerts are triggered once per bar close at the specified times.
3. **Labels for Key Time Points**:
- **Customizable Labels**: Labels can be added at specific times to indicate important trading actions (e.g., "No Trade," "Open Trade," and "Close Trade"). The text, color, and size of these labels are customizable.
- **Label Display**: Labels appear on the chart at defined times to provide visual cues for trading decisions.
4. **Visual Customization**:
- **Box and Label Colors**: Users can choose colors for the box and labels to match their preferences or trading setup.
- **Box Transparency**: The box can be customized with varying levels of transparency to enhance chart visibility.
#### **Usage:**
1. **Set Up Time Intervals**: Define the start and end times for the box using the input fields. Adjust these settings to fit your trading strategy and time zones.
2. **Adjust Alerts and Labels**: Customize the alert messages and label text to fit your trading plan.
3. **Apply to Chart**: Add the script to your TradingView chart to visualize the time-based boxes, receive alerts, and see the labels.
This script helps traders visually identify significant time ranges within the trading day and receive timely alerts and labels, enhancing their decision-making process.

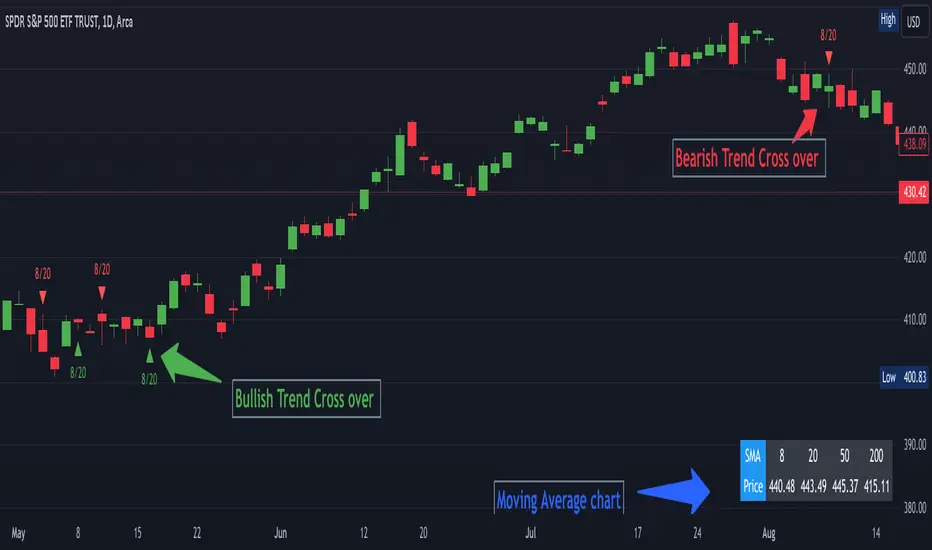
SMA Table with Alerts and Intersections🌟 **Presenting the Dynamic SMA Intersection Alert Indicator!** 🌟
### **Overview:**
The Dynamic SMA Intersection Alert Indicator is a sophisticated tool developed for traders seeking simplicity and effectiveness. It integrates multiple Simple Moving Averages (SMA) to deliver real-time alerts and visual cues, enabling traders to identify potential market entry points with ease.
### **Features:**
1. **Multi-SMA Visualization:**
- Incorporates four SMAs: 8, 20, 50, 200 periods.
- Displays a customizable table showing the current value of each SMA.
2. **Alerts in Real-Time:**
- Provides instant notifications for price crossings over any of the SMAs.
- Offers customizable alert messages.
3. **Visualization of Intersection Points:**
- Displays green triangles for bullish crosses and red for bearish, directly on the chart.
- Allows for the identification of precise intersection points between shorter-term and longer-term SMAs.
### **Benefits:**
- **Informed Decision-Making:** Enables quick discernment of market trends.
- **Efficiency:** Automates the tracking of SMA intersections.
- **User-Friendly:** Applicable for both novice and experienced traders.
### **How It Operates:**
- The indicator computes four different SMAs and presents their current values systematically.
- It triggers a real-time alert when the price crosses any SMA, instantly notifying the trader.
- Visual cues are plotted on the chart when any two SMAs intersect, indicating the type of cross.
### **Enhance Your Trading Experience!**
The Dynamic SMA Intersection Alert Indicator is designed to refine your trading experience and assist in making informed and timely trading decisions. Leverage this tool to stay abreast of market trends and enhance your market understanding!
Movable Stop + Trail + Alerthello everybody !
.....
this indicator helps you to get a better trading setting.
it's similar to the default draw tool from the trading view but the difference is you can add Trail stop and Alert .
.....
It also helps to free accounts to set more than 1 Alarm !!!
.....
Alert setting
just remember after you see set an alert if you change stop or entry, the alert will work with previous values/settings.
so you need to recreate an alert.
also don't change alert setting
.....
indicator setting
How is it works ?
...
settings
...
everything on :
you can see the information on the table
...
short sample :
everything on
...
simple short trade setting:
.....
my goal is to upgrade this indicator with your ideas.
not financial advice !
please , share your ideas with me to improve the indicator
I would like to see what you think about this indicator <3
also if you have any ideas to create an indicator or strategy you can make contact with me .
have a great day.

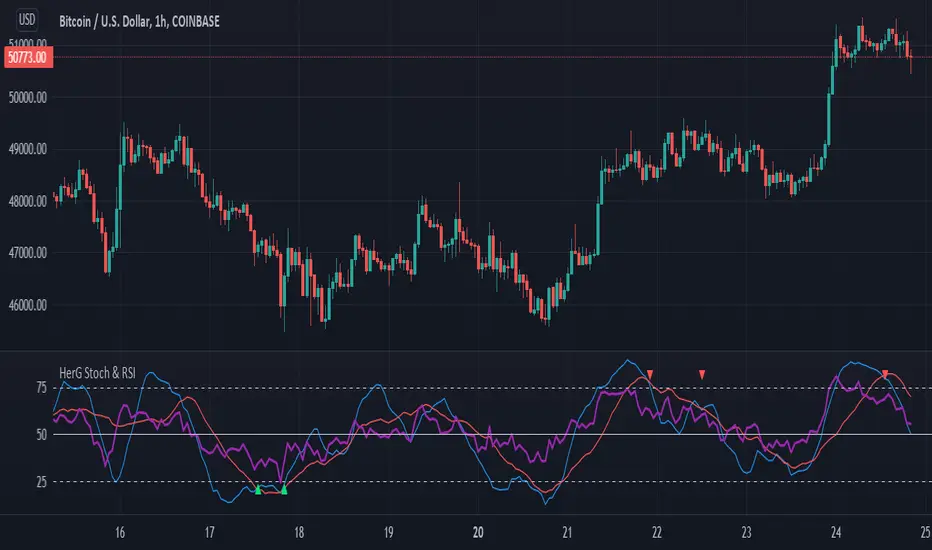
Stochastic and RSI in one indicator with customized alert.Hello Trading Viewers,
I present you Stochastic Oscillator and The Relative Strength Index Indicator inside one indicator, so that it will clear room to view charts.
When Stochastic is over-sold, the fast and slow stochastic underlap along with strong RSI (say above 45) will be a good indicator of buy at low with good risk-to-return of 2x or 3x; therefore I have set a triangle shape indicator within to help you identify or you can simply set an alert as I have coded an customized alert.
Same idea is used when Stochastic is over-bought you will receive an alert when fast & slow stochastic overlaps with RSI falling give a good sell set-up.
There is an option of selecting different timeframes which will further help make the correct decision. Say you are viewing a Daily chart but you want an indicator to present data of 4hrs timeframe, it can be done from the indicator cogwheel option. Default timeframe is "same as charts' ".
Above indicator is universal because settings such as RSI levels and no. of bars to calculate are user defined. You can use it on Crypto, Commodities, Stocks etc.
I suggest you first paper-trade with it and then use it on live account.
Happy trading.
CDC ActionZone Multi-TF,Mult-Ticker with alert() [P-O-Concept]This is proof-of-concept for using single screen displaying triggering signal of multiple stock/crypto
This source code is subject to the terms of the Mozilla Public License 2.0 at mozilla.org
1. Original CDC Action Zone v3 2020 by © piriya33
Source of original indicator :
2. Table concept/part of code is pulled from Portfolio Tracker
***************************************************************************
CDC Action Zone is based on a simple EMA crossover between EMA12 and EMA26
The zones are defined by the relative position of price in relation to the two EMA lines
Different zones can be use to activate / deactivate other trading strategies
The strategy can also be used on its own with acceptable result, buy on the first green candle
and sell on the first red candle
***************************************************************************
Hint Color Meaning :
Green = FastMA > SlowMA and Price is above FastMA
Blue = FastMA < SlowMA and Price is above both MA
LightBlue = FastMA < SlowMA and Price is between both MA
Red = FastMA < SlowMA and Price is below FastMA
Orange = FastMA > SlowMA and Price is below both MA
Yellow = FastMA > SlowMA and Price is between both MA
Blue/LightBlue/Orange/Yellow should be used with another indicator (such as divergent or so)
Cautions:
- This indicator is not meant to be used as "Signal" or "Trading System"
- This indicator provide a quick-glimpse to multiple ticker in same screen. You'll still have to see indications using original CDC Action Zone (If you're using with CDC System), or combining with another indicator (For shorter tf or scalping, or short/long cover)
- Up to 10 Tickers / Timeframe + Current ticker
Alert Creation Guideline
If this indicator will be used as alert. The timeframe for ticker should be set to "same as" the chart you're using, ie, to set alert on 4h, it should be created in 4h-timeframe (Alert is fired on bar close, using 1D-TABLE in 4H-CHART may trigger alert up to 6 times. else if using in 4H-TABLE in 1D-CHART the alert may not trigger at all)
Considering using ohlc4, hlc3, hl2 for market with no session
PS. Send me a message if you see any bug. (especially if using JSON, I have no chance to test with multiple alert at same tick.)

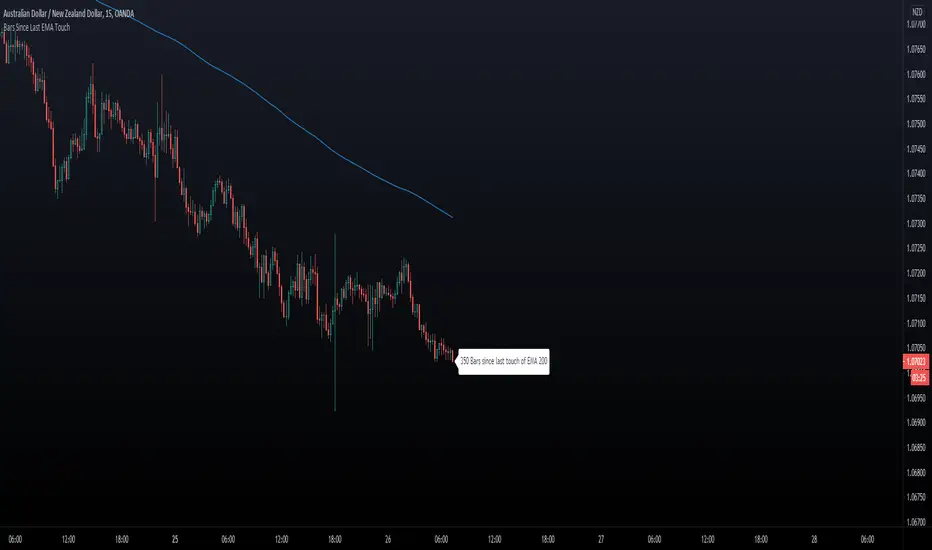
Bars Since Last EMA Touch
This indicator keeps track of how many bars since price touched any EMA last time. You can for example
set 200 EMA. Tell the script to send an alert if/when 400 bars has been reached away from the EMA 200.
- You can hide/show The EMA Line.
- You can hide/show bar Count.
- You can set X bars from EMA to get Alert.
- You can change color of The Badge and EMA line to fit your background colors.
Enjoy!
Another Indicator From The Hunter Trading Group
888 BOT #alerts█ 888 BOT #alerts (open source)
This is an Expert Advisor 'EA' or Automated trading script for ‘longs’ and ‘shorts’, which uses only a Take Profit or, in the worst case, a Stop Loss to close the trade.
It's a much improved version of the previous ‘Repanocha’. It doesn`t use 'Trailing Stop' or 'security ()' functions (although using a security function doesn`t mean that the script repaints) and all signals are confirmed, therefore the script doesn`t repaint in alert mode and is accurate in backtest mode.
Apart from the previous indicators, some more and other functions have been added for Stop-Loss, re-entry and leverage.
It uses 8 indicators, (many of you already know what they are, but in case there is someone new), these are the following:
1. Jurik Moving Average
It's a moving average created by Mark Jurik for professionals which eliminates the 'lag' or delay of the signal. It's better than other moving averages like EMA , DEMA , AMA or T3.
There are two ways to decrease noise using JMA . Increasing the 'LENGTH' parameter will cause JMA to move more slowly and therefore reduce noise at the expense of adding 'lag'
The 'JMA LENGTH', 'PHASE' and 'POWER' parameters offer a way to select the optimal balance between 'lag' and over boost.
Green: Bullish , Red: Bearish .
2. Range filter
Created by Donovan Wall, its function is to filter or eliminate noise and to better determine the price trend in the short term.
First, a uniform average price range 'SAMPLING PERIOD' is calculated for the filter base and multiplied by a specific quantity 'RANGE MULTIPLIER'.
The filter is then calculated by adjusting price movements that do not exceed the specified range.
Finally, the target ranges are plotted to show the prices that will trigger the filter movement.
Green: Bullish , Red: Bearish .
3. Average Directional Index ( ADX Classic) and ( ADX Masanakamura)
It's an indicator designed by Welles Wilder to measure the strength and direction of the market trend. The price movement is strong when the ADX has a positive slope and is above a certain minimum level 'ADX THRESHOLD' and for a given period 'ADX LENGTH'.
The green color of the bars indicates that the trend is bullish and that the ADX is above the level established by the threshold.
The red color of the bars indicates that the trend is down and that the ADX is above the threshold level.
The orange color of the bars indicates that the price is not strong and will surely lateralize.
You can choose between the classic option and the one created by a certain 'Masanakamura'. The main difference between the two is that in the first it uses RMA () and in the second SMA () in its calculation.
4. Parabolic SAR
This indicator, also created by Welles Wilder, places points that help define a trend. The Parabolic SAR can follow the price above or below, the peculiarity that it offers is that when the price touches the indicator, it jumps to the other side of the price (if the Parabolic SAR was below the price it jumps up and vice versa) to a distance predetermined by the indicator. At this time the indicator continues to follow the price, reducing the distance with each candle until it is finally touched again by the price and the process starts again. This procedure explains the name of the indicator: the Parabolic SAR follows the price generating a characteristic parabolic shape, when the price touches it, stops and turns ( SAR is the acronym for 'stop and reverse'), giving rise to a new cycle. When the points are below the price, the trend is up, while the points above the price indicate a downward trend.
5. RSI with Volume
This indicator was created by LazyBear from the popular RSI .
The RSI is an oscillator-type indicator used in technical analysis and also created by Welles Wilder that shows the strength of the price by comparing individual movements up or down in successive closing prices.
LazyBear added a volume parameter that makes it more accurate to the market movement.
A good way to use RSI is by considering the 50 'RSI CENTER LINE' centerline. When the oscillator is above, the trend is bullish and when it is below, the trend is bearish .
6. Moving Average Convergence Divergence ( MACD ) and ( MAC-Z )
It was created by Gerald Appel. Subsequently, the histogram was added to anticipate the crossing of MA. Broadly speaking, we can say that the MACD is an oscillator consisting of two moving averages that rotate around the zero line. The MACD line is the difference between a short moving average 'MACD FAST MA LENGTH' and a long moving average 'MACD SLOW MA LENGTH'. It's an indicator that allows us to have a reference on the trend of the asset on which it is operating, thus generating market entry and exit signals.
We can talk about a bull market when the MACD histogram is above the zero line, along with the signal line, while we are talking about a bear market when the MACD histogram is below the zero line.
There is the option of using the MAC-Z indicator created by LazyBear, which according to its author is more effective, by using the parameter VWAP ( volume weighted average price ) 'Z-VWAP LENGTH' together with a standard deviation 'STDEV LENGTH' in its calculation.
7. Volume Condition
Volume indicates the number of participants in this war between bulls and bears, the more volume the more likely the price will move in favor of the trend. A low trading volume indicates a lower number of participants and interest in the instrument in question. Low volumes may reveal weakness behind a price movement.
With this condition, those signals whose volume is less than the volume SMA for a period 'SMA VOLUME LENGTH' multiplied by a factor 'VOLUME FACTOR' are filtered. In addition, it determines the leverage used, the more volume , the more participants, the more probability that the price will move in our favor, that is, we can use more leverage. The leverage in this script is determined by how many times the volume is above the SMA line.
The maximum leverage is 8.
8. Bollinger Bands
This indicator was created by John Bollinger and consists of three bands that are drawn superimposed on the price evolution graph.
The central band is a moving average, normally a simple moving average calculated with 20 periods is used. ('BB LENGTH' Number of periods of the moving average)
The upper band is calculated by adding the value of the simple moving average X times the standard deviation of the moving average. ('BB MULTIPLIER' Number of times the standard deviation of the moving average)
The lower band is calculated by subtracting the simple moving average X times the standard deviation of the moving average.
the band between the upper and lower bands contains, statistically, almost 90% of the possible price variations, which means that any movement of the price outside the bands has special relevance.
In practical terms, Bollinger bands behave as if they were an elastic band so that, if the price touches them, it has a high probability of bouncing.
Sometimes, after the entry order is filled, the price is returned to the opposite side. If price touch the Bollinger band in the same previous conditions, another order is filled in the same direction of the position to improve the average entry price, (% MINIMUM BETTER PRICE ': Minimum price for the re-entry to be executed and that is better than the price of the previous position in a given %) in this way we give the trade a chance that the Take Profit is executed before. The downside is that the position is doubled in size. 'ACTIVATE DIVIDE TP': Divide the size of the TP in half. More probability of the trade closing but less profit.
█ STOP LOSS and RISK MANAGEMENT.
A good risk management is what can make your equity go up or be liquidated.
The % risk is the percentage of our capital that we are willing to lose by operation. This is recommended to be between 1-5%.
% Risk: (% Stop Loss x % Equity per trade x Leverage) / 100
First the strategy is calculated with Stop Loss, then the risk per operation is determined and from there, the amount per operation is calculated and not vice versa.
In this script you can use a normal Stop Loss or one according to the ATR. Also activate the option to trigger it earlier if the risk percentage is reached. '% RISK ALLOWED' wich is calculated according with: '%EQUITY ON EACH ENTRY'. Only works with Stop Loss on 'NORMAL' or 'BOTH' mode.
'STOP LOSS CONFIRMED': The Stop Loss is only activated if the closing of the previous bar is in the loss limit condition. It's useful to prevent the SL from triggering when they do a ‘pump’ to sweep Stops and then return the price to the previous state.
█ ALERTS
There is an alert for each leverage, therefore a maximum of 8 alerts can be set for 'long' and 8 for 'short', plus an alert to close the trade with Take Profit or Stop Loss in market mode. You can also place Take Profit limit and Stop Loss limit orders a few seconds after filling the position entry order.
- 'MAXIMUM LEVERAGE': It is the maximum allowed multiplier of the % quantity entered on each entry for 1X according to the volume condition.
- 'ADVANCE ALERTS': There is always a time delay from when the alert is triggered until it reaches the exchange and can be between 1-15 seconds. With this parameter, you can advance the alert by the necessary seconds to activate it earlier. In this way it can be synchronized with the exchange so that the execution time of the entry order to the position coincides with the opening of the bar.
The settings are for Bitcoin at Binance Futures (BTC: USDTPERP) in 15 minutes.
For other pairs and other timeframes, the settings have to be adjusted again. And within a month, the settings will be different because we all know the market and the trend are changing.

MA-EMA Crossover AlertsThis is a script for getting alerts for the MA-EMA XO Strategy that I published recently.
This is probably the first version that I am putting out for this logic.
Based on feedback (and some coding suggestions and support if anyone is willing), I will try to improve this further.
So, what do we have in this script -
I have created 5 alert conditions. The 4 alerts are straight-forward : Entry / Exit alerts for Long / Short.
The fifth alert is just a single Alert which is triggered if any of the 4 alert conditions are met. Then user can check the chart to see what trade is triggered.
I am not explaining the logic of the indicator here since it is kind-of covered in the strategy.

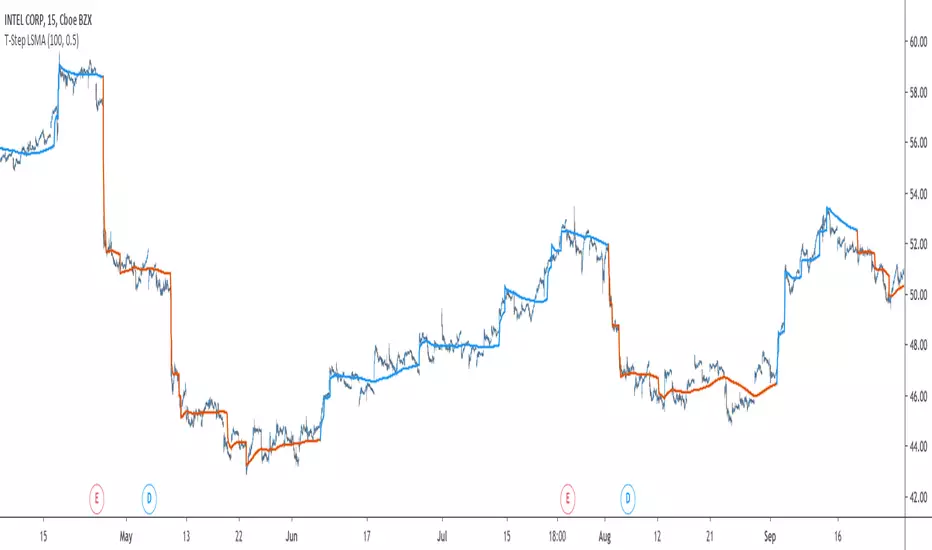
T-Step LSMAIntroduction
The trend step indicator family has produced much interest in the community, those indicators showed in certain cases robustness and reactivity. Their ease of use/interpretation is also a major advantage. Although those indicators have a relatively good fit with the input price, they can still be improved by introducing least-squares fitting on their calculations. This is why i propose a new indicator (T-Step LSMA) which aim to gather all the components of the trend-step indicator family (including the auto-line family).
The indicator will use as a threshold the mean absolute error between the input and the output (T-Channel) scaled with the efficiency ratio (Efficient Trend Step) while using least squares in order to provide a better fit with the price (Auto-Filter).
The Indicator
The interpretation of the indicator is easy, the indicator estimate an up-trending market when in blue, down-trending when in orange, the signal only depend on the trend-step part ( b in the code).
length control the period of the efficiency ratio as well as any components in the lsma calculation. The efficiency ratio allow to provide adaptivity, therefore the threshold will be lower when market is trending and higher when market is ranging.
Sc control the amount of feedback of the indicator, a value of 1 will use only the closing price as input, a value of 0.5 will use 50% of the closing price/indicator output as input, this allow to get smoother results.
It is possible to get the non-smooth version of the indicator by checking "No Smoothing".
This allow the indicator to filter more information.
Least Squares Smoothing - Benefits
One could ask why introducing least squares smoothing, there are several reasons to this choice, we have seen that trend-step indicators are boxy, they filter most of the variational information in the price, introducing least squares smoothing allow to gain back some of this variational information while providing a better fit with the price, the indicator is more noisy but also more practical in certain situations.
For example the indicator in its boxy form can't really be useful as input for other indicators, which is not the case with this version.
Relative strength index of period 14 using the proposed indicator as input.
Down-Sides
The indicator is dependent on the time frame used, larger time frames resulting in an indicator overfitting, sticking with lower time frames might be ideal. The indicator behavior might also change depending on the market in which it is applied.
Setting Up Alerts For The Indicator
Alerts conditions are already set, in order to create an alert based on the indicator follow these steps :
Go to the alert section (the alarm clock) -> create new alert -> select T-Step LSMA in condition -> Below select Up or Dn (Up for a up-trending alert and Dn for a down-trending alert)
In option select "once per bar close", change the message if you want a personalized message.
Conclusion
I don't think i'll post other indicators related to the trend-step framework for the time to comes, nonetheless the ones posted proven to have interesting results as well as many upsides. Although i don't think they would generate positive long-terms returns they could still be of use when using smarter volatility metrics as threshold. The proposed indicator conserve more information than its relatives and might find some use as input for other indicators.
Recommended Use Of The Code
Although i don't put restrictions on the code usage, i still recommend creative and pertinent changes to be made, graphical changes or any minor changes are not necessary, remember that such practice is disrespectful toward the author, you don't want to load up the tradingview servers for nothing right ?
Support Me
Making indicators sure is hard, it takes time and it can be quite lonely to, so i would love talking with you guys while making them :) There isn't better support than the one provided by your friends so drop me a message.
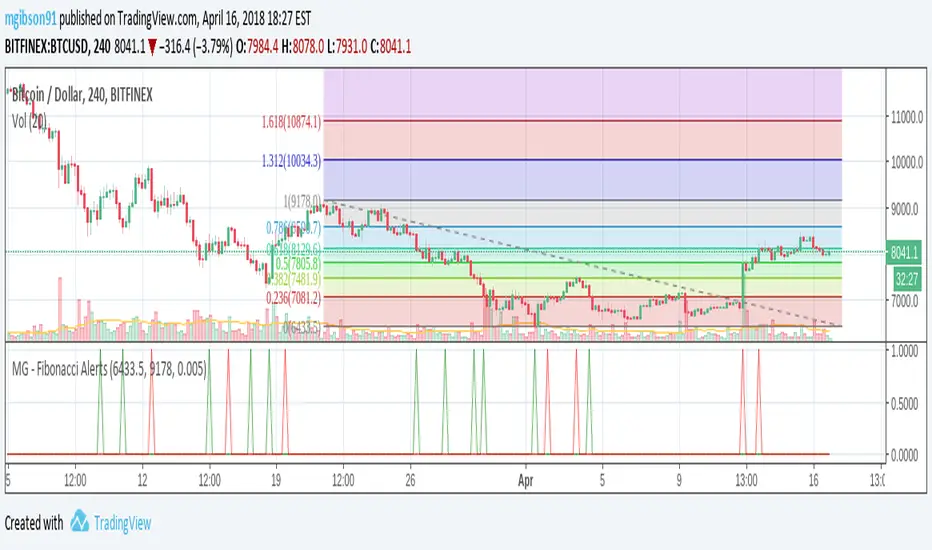
MG - Fibonacci Alerts - 1.0This script allows a user to get alerts when the price goes within a certain percentage threshold of a Fibonacci level.
If connected with AutoView, it could allow an easy way to do automated range trading between Fibonacci levels. Although I plan to do this myself, I haven't used it for this purpose yet so please be cautious and verify with live results beforehand before using it for any automation.
NOTE: The image shown of the indicator is not fully correct as the close price is used. In many cases in the example image, the candle close price DID come within the alert threshold but closed outside the threshold
Usage:
1. User performs a Fibonacci retracement / extension analysis to identify a sensible high and low point. (Currently, this script is geared towards dip pullbacks during a bull market with the ability to toggle rise pullbacks in a bear market in the pipeline)
2. User enters the high and low points into this indicator
3. User can then set alerts on the buy and sell signals which should provide alerts at excellent entry / exit points.
a. Alerts must be created on the buy and sell signal bars. E.g. Buy signal => Alert when 'Buy Signal' crosses up '0.9'
4. Set the alerts to once per bar (not per close). In this indicator, we want to catch things as soon as they happen.
NOTE: Should use in conjunction with another indicator for maximize results.
I personally use this indicator ()
TODO
- Add negative alert levels
- Allow user to specify direction of Fib retracement as the levels are different in bull and bear markets
All feedback is welcome
2 hours ago
Gunbot MACDgenOk this is just some strat based on MACD, checking for a few conditions until giving buy/sell signals to Gunbot via alerts.
It is generalized but if you want to go play with the values. I will continue to develop this further and am happy to receive feedback.
Notations are coming.
Usage notes:
-ONLY use this with TV_GAIN: 0.6 because on downtrends it is supposed to double up to pull down the average bought price!
-Use "buying condition" and "selling condition" for alerts, trigger on close and I suggest you use 3 min intervals but try what looks good to you
-Use this on pairs that are curvy and have atleast 0.6% gain between buy/sell triggers. This is also general advise when you want to take microprofits.
-Don't be confused with sell arrows, it will only trigger the bot sell on gain when you've set TV_GAIN

John Trade AlertsImagine you are watching a ball bounce up and down on a graph.
This script is like a set of rules that says:
When to start playing
When to stop playing
When you got some prize levels
and it yells to you (alerts) when those things happen.
The main ideas
Breakout Buy (ball jumps high)
There is a line drawn high on the chart called the breakout level.
If the price (the ball) closes above that line, and some extra “good conditions” are true (enough volume, uptrend, etc.),
the script says: “We entered a Breakout trade now.”
Pullback Buy (ball dips into a box)
There is a zone (a small box) between a low line and a high line: the pullback zone.
If the price closes inside that zone, and the pullback looks “healthy” (not too much volume, still above a moving average, etc.),
the script says: “We entered a Pullback trade now.”
Stops (when to get out if it goes wrong)
For each entry type (Breakout or Pullback), there is a red stop line under the price.
If the price falls below that stop line, the script says:
“Stop hit, we’re out of the trade.”
Hard Support / Invalidation (big no‑no level)
There is a special hard support line.
The script also looks at the 1‑hour chart in the background.
If a 1‑hour candle closes below that hard support, it says:
“Hard invalidation – idea is broken, get out.”
Targets (prize levels)
Above the current price there are several orange lines: Target 1, 2, 3A, 3B, 4A, 4B.
If the price goes up and crosses one of these lines, the script says:
“Target X reached!”
Trend and Volume “health checks”
It checks if the short‑term average price (SMA20) is going up → “uptrend.”
It can check if price is above a long‑term average (SMA200).
For breakouts, it checks if volume is stronger than usual (good push).
For pullbacks, it prefers quieter than usual volume (calm dip).
It can also check an Anchored VWAP line (a special average price from a chosen starting time) and only trade if price is above that too.
Remembering if you are “in a trade”
The script keeps a little memory:
Are we currently in a position (inPos) or not?
Was it a Breakout or a Pullback entry?
What is our entry price and active stop?
When it gets a new entry signal, it turns inPos to true, picks the right stop, and draws that stop line.
When a stop or hard invalidation happens, it sets inPos to false again.
It can also “forget” and reset at the start of a new trading day if you want.
Alerts
When:
you get a Breakout entry
or a Pullback entry
or a Stop is hit
or the hard support is broken on 1‑hour
or a Target is reached
the script sends a message you can use in TradingView alerts (pop‑ups, email, webhook, etc.).
Things you see on the chart
Teal line: Breakout level
Green lines: Pullback zone low & high
Red line: Active stop (only when you’re “in” a trade)
Orange lines: Targets 1, 2, 3A, 3B, 4A, 4B
Blue line: Anchored VWAP (if you turn it on)
Purple faint line: SMA20 (short‑term trend)
Gray faint line: SMA200 (long‑term trend)
Little label near the last bar that says:
if you’re IN or Flat
which type of entry (Breakout/Pullback)
what your current stop is
So in kid words:
It draws important lines on the chart.
It watches the price move like a ball.
When the ball does something special (jump above, fall below, hit a prize line),
it shouts to you with alerts.
It remembers if you’re in the game or not, and where your safety line (stop) is.

Two Consecutive Candles Alert - Toggle Alerts🔹 Overview:
This indicator identifies when two consecutive candles of the same color appear on the chart—bullish (green) or bearish (red). It highlights the second candle of the streak and optionally triggers an alert, helping traders spot short-term momentum shifts or continuation patterns.
🔹 How It Works:
Candle Detection: The script checks the last three candles.
The second candle in a pair is marked only if it follows a candle of the same color and is not part of a longer streak.
Marking:
Bullish second candles are marked with a green triangle below the bar.
Bearish second candles are marked with a red triangle above the bar.
Alerts (Optional):
Traders can enable or disable alerts independently for bullish or bearish setups using checkboxes in the settings.
Alerts are triggered only on the second candle of a two-candle streak.
🔹 Inputs / Settings:
Enable Bullish Candle Alerts ✅
Enable Bearish Candle Alerts ✅
🔹 Use Case:
Identify short-term trend momentum.
Spot potential continuation setups after two consecutive candles of the same type.
Combine with other indicators for confirmation (e.g., support/resistance, moving averages).
🔹 Notes:
The indicator marks only the second candle in a two-candle streak to avoid marking longer streaks multiple times.
Alerts are fully optional and can be toggled on or off.
