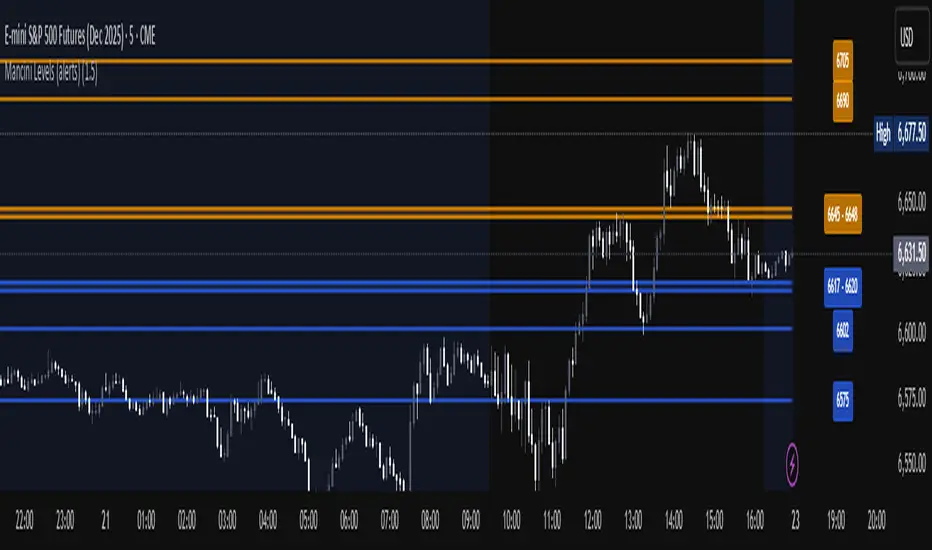
Mancini Levels (with alerts, majors only option)This indicator displays Support and Resistance levels on ES or MES (E-mini and Micro E-mini S&P 500 Index Futures) charts by parsing text copied and pasted by the user.
(The levels displayed on the chart above are not valid, they are for illustration only)
Features
Option to display only the major levels
The chart on the left displays both major and minor levels, distinguished by color and line style. The chart on the right shows only the major levels; minor levels are disabled:
Alert function for when the price approaches a major level or zone (within a customizable distance).
The script provides a trigger for alerts. When creating an alert, you can then choose your desired frequency (Only once/Once per bar/Once per bar close/Once per minute) from the TradingView alert pop-up.
The alert message contains the current price and the approached major level price.
Customizable Lookback Period
Set how many days into the past the lines should appear (Subject to a maximum of 5000 bars).
To display lines for the current day only, set this value to 1.
Functions only on ES or MES (E-mini and Micro E-mini S&P 500 Index Futures) charts, as the text format is intended for these instruments.
How to Use
Copy and paste the support and resistance levels into the indicator's "Supports" and "Resistances" input fields.
Format Example:
For the "Supports" input: 6772-6770 (major), 6764 (major), 6757, 6751-54
For the "Resistances" input: 6799 (major), 6814, 6828-30, 6839-40 (major)
The indicator supports the display of zone levels in multiple formats
(e.g., 6235-45 and 6235-6245 and 6245-6235 are all valid).
For hundred- or thousand-point rollovers, please use only the full number format: 5995-6005.
The indicator includes an error-checking system to help you troubleshoot common setup issues.
An on-chart error label will be displayed on the chart if:
The chart instrument is not ES or MES.
The "Supports" and "Resistances" fields are both empty.
A data formatting error is detected (e.g., non-numeric characters, incomplete zones, etc.).
How It Works
For optimal resource efficiency and performance, the script executes all computationally intensive tasks only once, on the very first bar when the chart loads (if barstate.isfirst).
One-time Parsing: The parsing, splitting, and conversion of the text (string) formatted levels, which are provided in the settings, occurs only once.
Persistent Objects: The lines (line.new), fills (linefill.new), and price labels (label.new) that mark the levels are all persistent graphical objects. The script creates these on the first bar and stores their references in arrays declared with the var keyword.
No Redrawing: On subsequent bars, the indicator does not delete and redraw these objects. It merely updates the x-axis position of the existing lines and labels (line.set_x1, line.set_x2, label.set_x) on the last bar (if barstate.islast), ensuring they always remain on the right edge of the chart, following the formation of new bars.
By default, TradingView charts have a limit of 50 lines and 50 labels. Given that the number of levels often exceeds this, the script's drawing logic is as follows:
The number of displayable lines and labels has been increased (to 500) in the indicator's declaration line.
The script applies a prioritized order when drawing levels and labels. Major levels have priority over minor levels during drawing.
Disclaimer
This indicator is provided for educational and informational purposes only. It is not financial advice.
Trading involves substantial risk of loss and is not suitable for every investor. Past performance shown in examples is not indicative of future results.
The indicator provides signals and calculations, but trading decisions are solely your responsibility. Always:
Test strategies on paper before using real money
Never risk more than you can afford to lose
Understand that all trading involves risk
Consider seeking advice from a licensed financial advisor
The publisher makes no guarantees regarding accuracy, profitability, or performance. Use at your own risk.
"alert" için komut dosyalarını ara
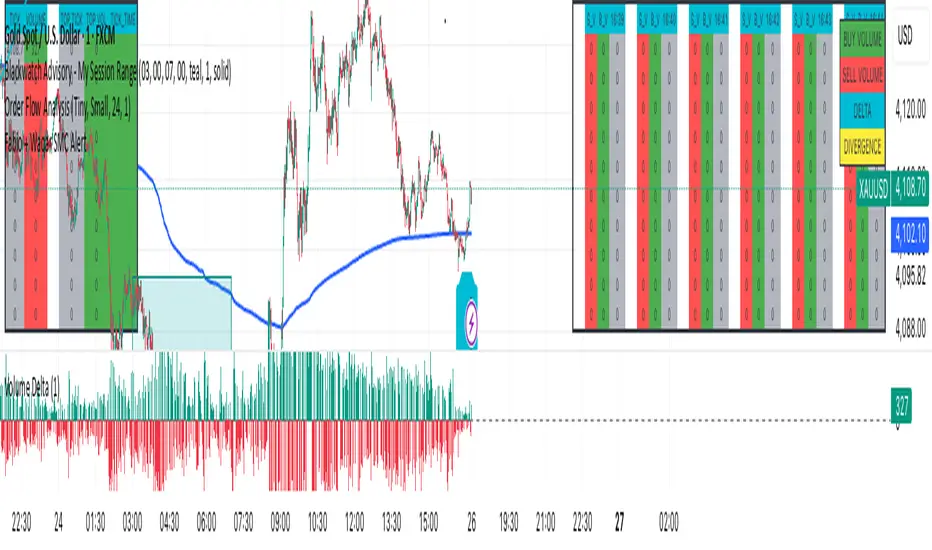
F & W SMC Alerthis script is a custom TradingView indicator designed to combine elements of a trend‑following VWAP approach (inspired by the “Fabio” strategy) with a smart‑money‑concepts framework (inspired by Waqar Asim). Here’s what it does:
* **Directional bias:** It calculates a 15‑minute VWAP and compares the current 15‑minute close to it. When price is above the 15‑minute VWAP, the script assumes a long bias; when below, a short bias. This reflects the trend‑following aspect of the Fabio strategy.
* **Liquidity sweeps:** Using recent pivot highs and lows on the current timeframe, it identifies when price takes out a recent high (for potential longs) or low (for potential shorts). This represents a “liquidity sweep” — a fake breakout that collects stops and signals a possible reversal or continuation.
* **Break of structure (BOS):** After a sweep, the script confirms that price is breaking away from the swept level (i.e., higher than recent highs for longs or lower than recent lows for shorts). This BOS confirmation helps avoid false signals.
* **Entry filters:** For a long setup, the bias must be long, there must be a liquidity sweep followed by a BOS, and price must reclaim the current‑timeframe VWAP. For a short setup, the opposite conditions apply (short bias, sweep + BOS to the downside, and price rejecting the VWAP).
* **Alerts and plot:** It provides two alert conditions (“Fabio‑Waqar Long Setup” and “Fabio‑Waqar Short Setup”) that you can attach to notifications. It also plots the intraday VWAP on your chart for visual reference.
In short, this script watches for a confluence of trend direction, liquidity sweeps, structural shifts, and VWAP reclaim/rejection, and then notifies you when those conditions align. You can use it as an alerting tool to identify high‑probability setups based on these combined strategies.

Fabio + Waqar SMC AlertThis script is a custom TradingView indicator designed to combine elements of a trend‑following VWAP approach (inspired by the “Fabio” strategy) with a smart‑money‑concepts framework (inspired by Waqar Asim). Here’s what it does:
* **Directional bias:** It calculates a 15‑minute VWAP and compares the current 15‑minute close to it. When price is above the 15‑minute VWAP, the script assumes a long bias; when below, a short bias. This reflects the trend‑following aspect of the Fabio strategy.
* **Liquidity sweeps:** Using recent pivot highs and lows on the current timeframe, it identifies when price takes out a recent high (for potential longs) or low (for potential shorts). This represents a “liquidity sweep” — a fake breakout that collects stops and signals a possible reversal or continuation.
* **Break of structure (BOS):** After a sweep, the script confirms that price is breaking away from the swept level (i.e., higher than recent highs for longs or lower than recent lows for shorts). This BOS confirmation helps avoid false signals.
* **Entry filters:** For a long setup, the bias must be long, there must be a liquidity sweep followed by a BOS, and price must reclaim the current‑timeframe VWAP. For a short setup, the opposite conditions apply (short bias, sweep + BOS to the downside, and price rejecting the VWAP).
* **Alerts and plot:** It provides two alert conditions (“Fabio‑Waqar Long Setup” and “Fabio‑Waqar Short Setup”) that you can attach to notifications. It also plots the intraday VWAP on your chart for visual reference.
In short, this script watches for a confluence of trend direction, liquidity sweeps, structural shifts, and VWAP reclaim/rejection, and then notifies you when those conditions align. You can use it as an alerting tool to identify high‑probability setups based on these combined strategies.
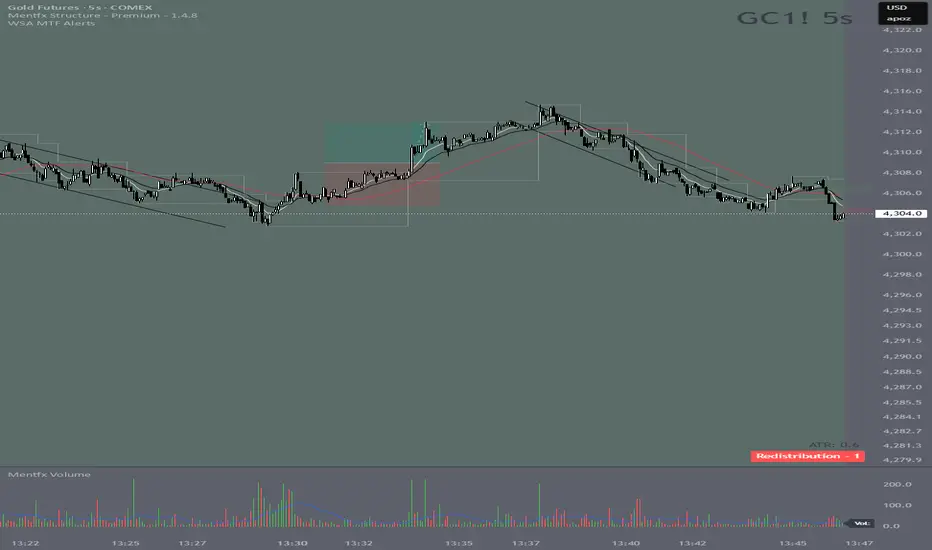
Wyckoff Stage Approximator (MTF Alerts)Wyckoff Stage Approximator (MTF Context)
This indicator is a powerful tool designed for traders who use a top-down, multi-timeframe approach based on Wyckoff principles. Its primary function is to identify the market's current stage—consolidation (Stage 1) or trend (Stage 2)—on a higher Context (C) timeframe and project that analysis onto your lower Validation (V) and Entry (E) charts.
This ensures you are always trading in alignment with the "big picture" trend, preventing you from taking low-probability trades based on lower-timeframe noise.
Core Concept: Top-Down Analysis
The script solves a common problem for multi-timeframe traders: losing sight of the primary trend. By locking the background color to your chosen Context timeframe (e.g., 15-minute), you are constantly reminded of the market's true state.
🟡 Yellow Background (Stage 1): The Context timeframe is in consolidation. This is a time to be patient and wait for a clear directional bias to emerge.
🟢 Green Background (Stage 2 - Markup): The Context timeframe is in a confirmed uptrend. This is your green light to look for bullish pullback opportunities on your lower timeframes.
🔴 Red Background (Stage 2 - Markdown): The Context timeframe is in a confirmed downtrend. This is your signal to look for bearish rally opportunities.
How It Works
The indicator uses a combination of moving averages and trend strength to objectively define each stage:
Trend Alignment: It checks if the 5 EMA, 10 EMA, and 20 EMA are properly stacked above or below the 50 SMA to determine the potential trend direction.
Trend Strength: It uses the ADX to measure the strength of the trend. A trend is only confirmed as Stage 2 if the ADX is above a user-defined threshold (default is 23), filtering out weak or choppy moves.
Stage Definition: Any period that is not a confirmed, strong Stage 2 Markup or Markdown is classified as a Stage 1 consolidation phase.
Key Features
Multi-Timeframe (MTF) Projection: Select your master "Context" timeframe, and its analysis will be displayed on any chart you view.
Customizable Inputs: Easily adjust the moving average lengths and ADX threshold to fit your specific strategy and the asset you are trading.
Clear Visual Cues: The intuitive background coloring makes it easy to assess the market environment at a glance.
Stage Transition Alerts: Set up specific alerts to be notified the moment your Context timeframe shifts from a Stage 1 consolidation to a Stage 2 trend, ensuring you never miss a potential setup.
How to Use This Indicator
Add the indicator to your chart.
In the settings, set the "Context Timeframe" to your highest timeframe (e.g., "15" for 15-minute).
Create alerts for the "Stage 1 -> Stage 2" conditions.
When you receive an alert, it signals that a potential trend is beginning on your Context chart.
Switch to your lower Validation and Entry timeframes. The background color will confirm the higher-timeframe trend, giving you the confidence to look for your specific entry patterns.
Disclaimer: This tool is designed for confluence and environmental analysis. It is not a standalone signal generator. It should be used in conjunction with your own price action, volume, or order flow analysis to validate trade entries.
Vol-Pace Projected-ATR-ADX-Alert-MAThe VolSC indicator analyzes stock volume trends with a focus on the Pace metric, which projects today's volume as a percentage of the 30-day average, highlighting unusual activity (e.g., over 200% turns bright green with alerts). The phantom projection bar, a wide green histogram to the right of the last bar, visually represents this projected volume on daily charts only, aiding quick identification of potential volume surges without cluttering intraday or weekly views. Additional features include ADX strength, ATR averages, and customizable table display for comprehensive insights.
Key Features:
* Primary Indicator: Volume with ADX (Average Directional Index) text.
* Pacing and Alerts: Calculates the volume pace for the day. Features an unusual volume alert with an adjustable threshold (e.g., 200%).
* Volume Projection: Projects a visual "Phantom Volume" for the day, offset to the right of the actual volume bar.
* ATR Indicator: Displays the 2x ATR (Average True Range) value as text.
* Volume Average: Displays the ADV (Average Daily Volume) Moving Average as text.
* Customization: Most settings are adjustable.

5m Enter AlertsThese alerts work really well to help you find good entries on the 5m chart:
"1 Enter LONG":
This one I use more often than any other alert. It's really great if the stock looks good but is currently overextended on the 5m, or looks like it's starting to pull back. It's triggered right after the stock pulled back to the VWAP or 15m EMA 8 and is about to continue.
All these criteria need to be met for the alert to be triggered on a VWAP pullback:
Crossed up VWAP or VWAP + half ATR recently (so it's also triggered even if it doesn't cross below VWAP on a pullback)
Above 5m EMA 8 (since this indicates it will likely continue higher up)
Closed above highest High of last 3 candles (to prevent premature alerts while the price started pulling back into the range of VWAP + half ATR)
Candle is confirmed (5m ended)
For the 15m EMA 8 pullback it's the same, except for that the 15m EMA 8 also still needs to be above VWAP (otherwise you wouldn't want to enter yet anyways).
"2 Enter SHORT":
Similar, but for shorts...
"3 High Volume Candle":
Detects High Volume Candles on the 5m chart. Can be helpful to get informed that a resistance / support finally broke on high volume, or to be notified about a potential reversal. Can therefore also be useful if applied on SPY.
Criteria:
Candle's volume > 1.2 * avg volume (of last 30 candles)
"X Candle Close":
This one I use quite often as well: it's really helpful to wait for a 5m candle to be confirmed, to see f. e. whether a candle really broke a support / resistance or not - and to prevent making bad decisions.
Criteria:
5m candle closed
More infos: www.reddit.com

Clean Pivot Lines with AlertsTechnical Overview
This Script is designed for detecting untouched pivot highs and lows. It draws horizontal levels only when those pivots remain unviolated within a configurable lookback window and removes them automatically upon price breaches or sweeps.
Key components include:
Pivot detection logic : Utilizes ta.pivothigh()/ta.pivotlow() (or equivalent via request.security for HTF) with parameterized pivotLength to ensure flexibility and adaptability to different timeframes.
Cleanliness filtering : Checks lookbackBars prior to line creation to skip levels already violated, ensuring only uncontaminated pivots are used.
Dynamic level tracking : Stores active levels in arrays (highLines, lowLines) for continuous real-time monitoring.
Violation logic : Detects both close-based breaks (breakAbove/breakBelow) and wick-based sweeps (sweepAbove/sweepBelow), triggering alerts and automatic teardown.
Periodic housekeeping : Every N (10) confirmed bars, re-verifies “clean” status and removes silently invalidated levels—maintaining chart hygiene and avoiding stale overlays.
Customization options : Supports pivot timeframe override, colors, line width/style, lookback length, and alert toggling.
Utility
This overlay script provides a disciplined workflow for drawing meaningful support/resistance levels, filtering out contaminated pivot points, and signaling validations (breaks/sweeps) with alerts. Its modular design and HTF support facilitate integration into systematic workflows, offering far more utility than mere static pivot plots.
Usage Instructions
1. Adjust `pivot_timeframe`, `pivot_length`, and `lookback_bars` to suit your strategy timeframe and volatility structure.
2. Customize visual parameters as required.
3. Enable alerts to receive in-platform messages upon pivot violations.
4. Use HTF override only if analyzing multi-timeframe pivot behavior; otherwise, leave empty to default to chart timeframe.
Performance & Limitations
- Pivot lines confirmation lags by `pivot_length` bars; real-time signals may be delayed.
- Excessive active lines may impact performance on low-TF charts.
- The “clean” logic is contingent on the `lookback_bars` parameter; choose sufficiently high values to avoid false cleanliness.
- Alerts distinguish between closes beyond and wick-only breaches to aid strategic nuance.

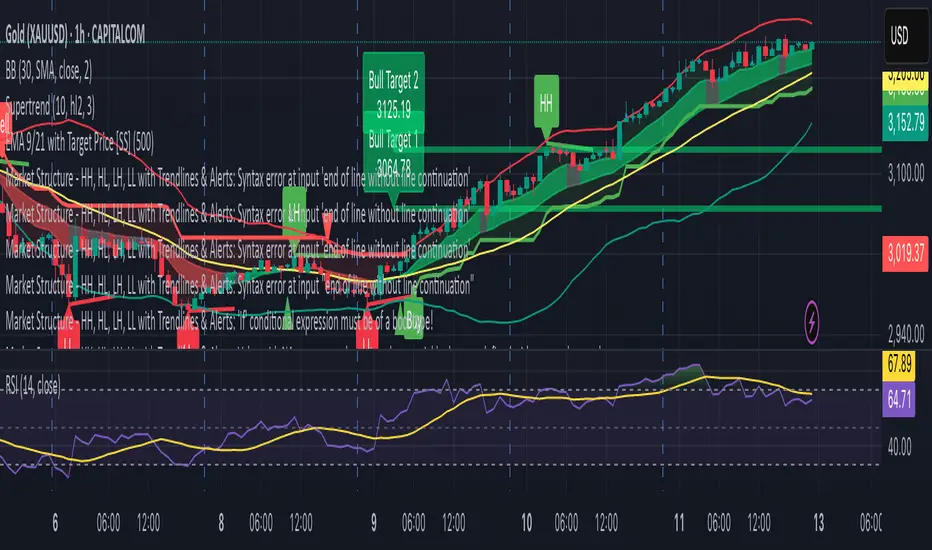
Market Structure - HH, HL, LH, LL with Trendlines & AlertsMarket Structure Script – HH, HL, LH, LL with Trendlines & Alerts
This Pine Script is designed to help identify key market structure patterns such as Higher Highs (HH), Higher Lows (HL), Lower Highs (LH), and Lower Lows (LL) on price charts. It also draws trendlines connecting the respective swing points and provides alerts when these important price patterns occur.
Key Features:
Swing High and Low Detection:
The script uses the ta.pivothigh and ta.pivotlow functions to identify significant swing highs and swing lows based on the pivot length (pivotLen). These points mark local peaks and troughs in the price action.
Dynamic Pivot Length:
The script adjusts the pivotLen (which defines the number of bars used to calculate swing points) based on the current timeframe of the chart. For example, for a 15-minute chart, it uses a pivot length of 5 bars, while for a daily chart, it uses 10 bars. This dynamic adjustment ensures that the script works across different timeframes.
Higher Highs (HH), Higher Lows (HL), Lower Highs (LH), Lower Lows (LL):
Higher High (HH): Identifies a price peak that is higher than the previous swing high, indicating an uptrend.
Higher Low (HL): Identifies a price trough that is higher than the previous swing low, supporting the idea of an ongoing uptrend.
Lower High (LH): Identifies a price peak that is lower than the previous swing high, suggesting a potential reversal or downtrend.
Lower Low (LL): Identifies a price trough that is lower than the previous swing low, indicating a downtrend.
Trendlines:
For each identified Higher High, Higher Low, Lower High, or Lower Low, the script automatically draws a trendline connecting the corresponding swing points. These trendlines provide a visual representation of the market’s price structure, showing support and resistance levels.
Labels:
The script places labels on the chart next to the respective swing points. These labels mark whether the point is a Higher High (HH), Higher Low (HL), Lower High (LH), or Lower Low (LL). This helps traders easily visualize the price pattern at a glance.
Alerts:
Alert conditions are set for when a Higher High (HH), Higher Low (HL), Lower High (LH), or Lower Low (LL) is detected. Users can set up alerts to be notified whenever one of these key market structure patterns forms. Alerts are an essential feature for traders who want to act quickly when important trend changes are happening.
Multi-Timeframe Stochastic Alert [tradeviZion]# Multi-Timeframe Stochastic Alert : Complete User Guide
## 1. Introduction
### What is the Multi-Timeframe Stochastic Alert?
The Multi-Timeframe Stochastic Alert is an advanced technical analysis tool that helps traders identify potential trading opportunities by analyzing momentum across multiple timeframes. It combines the power of the stochastic oscillator with multi-timeframe analysis to provide more reliable trading signals.
### Key Features and Benefits
- Simultaneous analysis of 6 different timeframes
- Advanced alert system with customizable conditions
- Real-time visual feedback with color-coded signals
- Comprehensive data table with instant market insights
- Motivational trading messages for psychological support
- Flexible theme support for comfortable viewing
### How it Can Help Your Trading
- Identify stronger trends by confirming momentum across multiple timeframes
- Reduce false signals through multi-timeframe confirmation
- Stay informed of market changes with customizable alerts
- Make more informed decisions with comprehensive market data
- Maintain trading discipline with clear visual signals
## 2. Understanding the Display
### The Stochastic Chart
The main chart displays three key components:
1. ** K-Line (Fast) **: The primary stochastic line (default color: green)
2. ** D-Line (Slow) **: The signal line (default color: red)
3. ** Reference Lines **:
- Overbought Level (80): Upper dashed line
- Middle Line (50): Center dashed line
- Oversold Level (20): Lower dashed line
### The Information Table
The table provides a comprehensive view of stochastic readings across all timeframes. Here's what each column means:
#### Column Explanations:
1. ** Timeframe **
- Shows the time period for each row
- Example: "5" = 5 minutes, "15" = 15 minutes, etc.
2. ** K Value **
- The fast stochastic line value (0-100)
- Higher values indicate stronger upward momentum
- Lower values indicate stronger downward momentum
3. ** D Value **
- The slow stochastic line value (0-100)
- Helps confirm momentum direction
- Crossovers with K-line can signal potential trades
4. ** Status **
- Shows current momentum with symbols:
- ▲ = Increasing (bullish)
- ▼ = Decreasing (bearish)
- Color matches the trend direction
5. ** Trend **
- Shows the current market condition:
- "Overbought" (above 80)
- "Bullish" (above 50)
- "Bearish" (below 50)
- "Oversold" (below 20)
#### Row Explanations:
1. ** Title Row **
- Shows "🎯 Multi-Timeframe Stochastic"
- Indicates the indicator is active
2. ** Header Row **
- Contains column titles
- Dark blue background for easy reading
3. ** Timeframe Rows **
- Six rows showing different timeframe analyses
- Each row updates independently
- Color-coded for easy trend identification
4. **Message Row**
- Shows rotating motivational messages
- Updates every 5 bars
- Helps maintain trading discipline
### Visual Indicators and Colors
- ** Green Background **: Indicates bullish conditions
- ** Red Background **: Indicates bearish conditions
- ** Color Intensity **: Shows strength of the signal
- ** Background Highlights **: Appear when alert conditions are met
## 3. Core Settings Groups
### Stochastic Settings
These settings control the core calculation of the stochastic oscillator.
1. ** Length (Default: 14) **
- What it does: Determines the lookback period for calculations
- Higher values (e.g., 21): More stable, fewer signals
- Lower values (e.g., 8): More sensitive, more signals
- Recommended:
* Day Trading: 8-14
* Swing Trading: 14-21
* Position Trading: 21-30
2. ** Smooth K (Default: 3) **
- What it does: Smooths the main stochastic line
- Higher values: Smoother line, fewer false signals
- Lower values: More responsive, but more noise
- Recommended:
* Day Trading: 2-3
* Swing Trading: 3-5
* Position Trading: 5-7
3. ** Smooth D (Default: 3) **
- What it does: Smooths the signal line
- Works in conjunction with Smooth K
- Usually kept equal to or slightly higher than Smooth K
- Recommended: Keep same as Smooth K for consistency
4. ** Source (Default: Close) **
- What it does: Determines price data for calculations
- Options: Close, Open, High, Low, HL2, HLC3, OHLC4
- Recommended: Stick with Close for most reliable signals
### Timeframe Settings
Controls the multiple timeframes analyzed by the indicator.
1. ** Main Timeframes (TF1-TF6) **
- TF1 (Default: 10): Shortest timeframe for quick signals
- TF2 (Default: 15): Short-term trend confirmation
- TF3 (Default: 30): Medium-term trend analysis
- TF4 (Default: 30): Additional medium-term confirmation
- TF5 (Default: 60): Longer-term trend analysis
- TF6 (Default: 240): Major trend confirmation
Recommended Combinations:
* Scalping: 1, 3, 5, 15, 30, 60
* Day Trading: 5, 15, 30, 60, 240, D
* Swing Trading: 15, 60, 240, D, W, M
2. ** Wait for Bar Close (Default: true) **
- What it does: Controls when calculations update
- True: More reliable but slightly delayed signals
- False: Faster signals but may change before bar closes
- Recommended: Keep True for more reliable signals
### Alert Settings
#### Main Alert Settings
1. ** Enable Alerts (Default: true) **
- Master switch for all alert notifications
- Toggle this off when you don't want any alerts
- Useful during testing or when you want to focus on visual signals only
2. ** Alert Condition (Options) **
- "Above Middle": Bullish momentum alerts only
- "Below Middle": Bearish momentum alerts only
- "Both": Alerts for both directions
- Recommended:
* Trending Markets: Choose direction matching the trend
* Ranging Markets: Use "Both" to catch reversals
* New Traders: Start with "Both" until you develop a specific strategy
3. ** Alert Frequency **
- "Once Per Bar": Immediate alerts during the bar
- "Once Per Bar Close": Alerts only after bar closes
- Recommended:
* Day Trading: "Once Per Bar" for quick reactions
* Swing Trading: "Once Per Bar Close" for confirmed signals
* Beginners: "Once Per Bar Close" to reduce false signals
#### Timeframe Check Settings
1. ** First Check (TF1) **
- Purpose: Confirms basic trend direction
- Alert Triggers When:
* For Bullish: Stochastic is above middle line (50)
* For Bearish: Stochastic is below middle line (50)
* For Both: Triggers in either direction based on position relative to middle line
- Settings:
* Enable/Disable: Turn first check on/off
* Timeframe: Default 5 minutes
- Best Used For:
* Quick trend confirmation
* Entry timing
* Scalping setups
2. ** Second Check (TF2) **
- Purpose: Confirms both position and momentum
- Alert Triggers When:
* For Bullish: Stochastic is above middle line AND both K&D lines are increasing
* For Bearish: Stochastic is below middle line AND both K&D lines are decreasing
* For Both: Triggers based on position and direction matching current condition
- Settings:
* Enable/Disable: Turn second check on/off
* Timeframe: Default 15 minutes
- Best Used For:
* Trend strength confirmation
* Avoiding false breakouts
* Day trading setups
3. ** Third Check (TF3) **
- Purpose: Confirms overall momentum direction
- Alert Triggers When:
* For Bullish: Both K&D lines are increasing (momentum confirmation)
* For Bearish: Both K&D lines are decreasing (momentum confirmation)
* For Both: Triggers based on matching momentum direction
- Settings:
* Enable/Disable: Turn third check on/off
* Timeframe: Default 30 minutes
- Best Used For:
* Major trend confirmation
* Swing trading setups
* Avoiding trades against the main trend
Note: All three conditions must be met simultaneously for the alert to trigger. This multi-timeframe confirmation helps reduce false signals and provides stronger trade setups.
#### Alert Combinations Examples
1. ** Conservative Setup **
- Enable all three checks
- Use "Once Per Bar Close"
- Timeframe Selection Example:
* First Check: 15 minutes
* Second Check: 1 hour (60 minutes)
* Third Check: 4 hours (240 minutes)
- Wider gaps between timeframes reduce noise and false signals
- Best for: Swing trading, beginners
2. ** Aggressive Setup **
- Enable first two checks only
- Use "Once Per Bar"
- Timeframe Selection Example:
* First Check: 5 minutes
* Second Check: 15 minutes
- Closer timeframes for quicker signals
- Best for: Day trading, experienced traders
3. ** Balanced Setup **
- Enable all checks
- Use "Once Per Bar"
- Timeframe Selection Example:
* First Check: 5 minutes
* Second Check: 15 minutes
* Third Check: 1 hour (60 minutes)
- Balanced spacing between timeframes
- Best for: All-around trading
### Visual Settings
#### Alert Visual Settings
1. ** Show Background Color (Default: true) **
- What it does: Highlights chart background when alerts trigger
- Benefits:
* Makes signals more visible
* Helps spot opportunities quickly
* Provides visual confirmation of alerts
- When to disable:
* If using multiple indicators
* When preferring a cleaner chart
* During manual backtesting
2. ** Background Transparency (Default: 90) **
- Range: 0 (solid) to 100 (invisible)
- Recommended Settings:
* Clean Charts: 90-95
* Multiple Indicators: 85-90
* Single Indicator: 80-85
- Tip: Adjust based on your chart's overall visibility
3. ** Background Colors **
- Bullish Background:
* Default: Green
* Indicates upward momentum
* Customizable to match your theme
- Bearish Background:
* Default: Red
* Indicates downward momentum
* Customizable to match your theme
#### Level Settings
1. ** Oversold Level (Default: 20) **
- Traditional Setting: 20
- Adjustable Range: 0-100
- Usage:
* Lower values (e.g., 10): More conservative
* Higher values (e.g., 30): More aggressive
- Trading Applications:
* Potential bullish reversal zone
* Support level in uptrends
* Entry point for long positions
2. ** Overbought Level (Default: 80) **
- Traditional Setting: 80
- Adjustable Range: 0-100
- Usage:
* Lower values (e.g., 70): More aggressive
* Higher values (e.g., 90): More conservative
- Trading Applications:
* Potential bearish reversal zone
* Resistance level in downtrends
* Exit point for long positions
3. ** Middle Line (Default: 50) **
- Purpose: Trend direction separator
- Applications:
* Above 50: Bullish territory
* Below 50: Bearish territory
* Crossing 50: Potential trend change
- Trading Uses:
* Trend confirmation
* Entry/exit trigger
* Risk management level
#### Color Settings
1. ** Bullish Color (Default: Green) **
- Used for:
* K-Line (Main stochastic line)
* Status symbols when trending up
* Trend labels for bullish conditions
- Customization:
* Choose colors that stand out
* Match your trading platform theme
* Consider color blindness accessibility
2. ** Bearish Color (Default: Red) **
- Used for:
* D-Line (Signal line)
* Status symbols when trending down
* Trend labels for bearish conditions
- Customization:
* Choose contrasting colors
* Ensure visibility on your chart
* Consider monitor settings
3. ** Neutral Color (Default: Gray) **
- Used for:
* Middle line (50 level)
- Customization:
* Should be less prominent
* Easy on the eyes
* Good background contrast
### Theme Settings
1. **Color Theme Options**
- Dark Theme (Default):
* Dark background with white text
* Optimized for dark chart backgrounds
* Reduces eye strain in low light
- Light Theme:
* Light background with black text
* Better visibility in bright conditions
- Custom Theme:
* Use your own color preferences
2. ** Available Theme Colors **
- Table Background
- Table Text
- Table Headers
Note: The theme affects only the table display colors. The stochastic lines and alert backgrounds use their own color settings.
### Table Settings
#### Position and Size
1. ** Table Position **
- Options:
* Top Right (Default)
* Middle Right
* Bottom Right
* Top Left
* Middle Left
* Bottom Left
- Considerations:
* Chart space utilization
* Personal preference
* Multiple monitor setups
2. ** Text Sizes **
- Title Size Options:
* Tiny: Minimal space usage
* Small: Compact but readable
* Normal (Default): Standard visibility
* Large: Enhanced readability
* Huge: Maximum visibility
- Data Size Options:
* Recommended: One size smaller than title
* Adjust based on screen resolution
* Consider viewing distance
3. ** Empowering Messages **
- Purpose:
* Maintain trading discipline
* Provide psychological support
* Remind of best practices
- Rotation:
* Changes every 5 bars
* Categories include:
- Market Wisdom
- Strategy & Discipline
- Mindset & Growth
- Technical Mastery
- Market Philosophy
## 4. Setting Up for Different Trading Styles
### Day Trading Setup
1. **Timeframes**
- Primary: 5, 15, 30 minutes
- Secondary: 1H, 4H
- Alert Settings: "Once Per Bar"
2. ** Stochastic Settings **
- Length: 8-14
- Smooth K/D: 2-3
- Alert Condition: Match market trend
3. ** Visual Settings **
- Background: Enabled
- Transparency: 85-90
- Theme: Based on trading hours
### Swing Trading Setup
1. ** Timeframes **
- Primary: 1H, 4H, Daily
- Secondary: Weekly
- Alert Settings: "Once Per Bar Close"
2. ** Stochastic Settings **
- Length: 14-21
- Smooth K/D: 3-5
- Alert Condition: "Both"
3. ** Visual Settings **
- Background: Optional
- Transparency: 90-95
- Theme: Personal preference
### Position Trading Setup
1. ** Timeframes **
- Primary: Daily, Weekly
- Secondary: Monthly
- Alert Settings: "Once Per Bar Close"
2. ** Stochastic Settings **
- Length: 21-30
- Smooth K/D: 5-7
- Alert Condition: "Both"
3. ** Visual Settings **
- Background: Disabled
- Focus on table data
- Theme: High contrast
## 5. Troubleshooting Guide
### Common Issues and Solutions
1. ** Too Many Alerts **
- Cause: Settings too sensitive
- Solutions:
* Increase timeframe intervals
* Use "Once Per Bar Close"
* Enable fewer timeframe checks
* Adjust stochastic length higher
2. ** Missed Signals **
- Cause: Settings too conservative
- Solutions:
* Decrease timeframe intervals
* Use "Once Per Bar"
* Enable more timeframe checks
* Adjust stochastic length lower
3. ** False Signals **
- Cause: Insufficient confirmation
- Solutions:
* Enable all three timeframe checks
* Use larger timeframe gaps
* Wait for bar close
* Confirm with price action
4. ** Visual Clarity Issues **
- Cause: Poor contrast or overlap
- Solutions:
* Adjust transparency
* Change theme settings
* Reposition table
* Modify color scheme
### Best Practices
1. ** Getting Started **
- Start with default settings
- Use "Both" alert condition
- Enable all timeframe checks
- Wait for bar close
- Monitor for a few days
2. ** Fine-Tuning **
- Adjust one setting at a time
- Document changes and results
- Test in different market conditions
- Find your optimal timeframe combination
- Balance sensitivity with reliability
3. ** Risk Management **
- Don't trade against major trends
- Confirm signals with price action
- Use appropriate position sizing
- Set clear stop losses
- Follow your trading plan
4. ** Regular Maintenance **
- Review settings weekly
- Adjust for market conditions
- Update color scheme for visibility
- Clean up chart regularly
- Maintain trading journal
## 6. Tips for Success
1. ** Entry Strategies **
- Wait for all timeframes to align
- Confirm with price action
- Use proper position sizing
- Consider market conditions
2. ** Exit Strategies **
- Trail stops using indicator levels
- Take partial profits at targets
- Honor your stop losses
- Don't fight the trend
3. ** Psychology **
- Stay disciplined with settings
- Don't override system signals
- Keep emotions in check
- Learn from each trade
4. ** Continuous Improvement **
- Record your trades
- Review performance regularly
- Adjust settings gradually
- Stay educated on markets

Inversion Fair Value Gaps [TradingFinder] IFVG ICT Signal| Alert🔵 Introduction
🟣 Inversion Fair Value Gap (IFVG)
An ICT Inversion Fair Value Gap, or reverse FVG, occurs when a fair value gap fails to hold its price, resulting in the price moving beyond and breaking the gap. This situation marks the initial change in price momentum.
Generally, prices respect fair value gaps and continue in their trend direction. However, when a fair value gap is breached, it transforms into an inversion fair value gap, signaling a potential short-term reversal or a subsequent change in direction.
🔵 How to Use
🟣 Identifying an Inversion Fair Value Gap
To spot an IFVG, you must first identify a fair value gap.
Inversion fair value gaps can be categorized into two types :
🟣 Bullish Inversion Fair Value Gap
A bullish IFVG occurs when a bearish fair value gap is invalidated by the price closing above it.
Steps to identify it :
Identify a bearish fair value gap.
When the price closes above this gap, it becomes a bullish inversion fair value gap.
This gap acts as a support level, pushing the price upwards and indicating a shift in momentum from sellers to buyers.
🟣 Bearish Inversion Fair Value Gap
A bearish IFVG happens when a bullish fair value gap fails, with the price closing below it.
Steps to identify it :
Identify a bullish fair value gap.
When the price closes below this gap, it becomes a bearish inversion fair value gap.
This gap acts as a resistance level, pushing the price downwards and indicating a shift in momentum from buyers to sellers.
🔵 Settings
🟣 Global Settings
Show All Inversion FVG: If disabled, only the most recent FVG will be displayed.
IFVG Validity Period (Bar): Determines the maximum duration (in number of candles) that the FVG and IFVG remain valid.Switching Colors Theme Mode: Includes three modes: "Off", "Light", and "Dark". "Light" mode adjusts colors for light mode use, "Dark" mode adjusts colors for dark mode use, and "Off" disables color adjustments.
🟣 Logic Settings
FVG Filter : This refines the number of identified FVG areas based on a specified algorithm to focus on higher quality signals and reduce noise.
Types of FVG filters :
Very Aggressive Filter : Adds a condition where, for an upward FVG, the last candle's highest price must exceed the middle candle's highest price, and for a downward FVG, the last candle's lowest price must be lower than the middle candle's lowest price. This minimally filters out FVGs.
Aggressive Filte r: Builds on the Very Aggressive mode by ensuring the middle candle is not too small, filtering out more FVGs.
Defensive Filter : Adds criteria regarding the size and structure of the middle candle, requiring it to have a substantial body and specific polarity conditions, filtering out a significant number of FVGs.
Very Defensive Filter : Further refines filtering by ensuring the first and third candles are not small-bodied doji candles, retaining only the highest quality signals.
Mitigation Level FVG and IFVG : Options include "Proximal", "Distal", or "50 % OB" modes, which you can choose based on your needs. The "50 % OB" line is the midpoint between distal and proximal.
🟣 Display Settings
Show Bullish IFVG : Toggles the display of demand-related boxes.
Show Bearish IFVG : Toggles the display of supply-related boxes.
🟣 Alert Settings
Alert Inversion FVG Mitigation : Enables alerts for Inversion FVG mitigation.
Message Frequency : Determines the frequency of alerts. Options include 'All' (every function call), 'Once Per Bar' (first call within the bar), and 'Once Per Bar Close' (final script execution of the real-time bar). Default is 'Once per Bar'.
Show Alert Time by Time Zone : Configures the time zone for alert messages. Default is 'UTC'.
Display More Info : Provides additional details in alert messages, including price range, date, hour, and minute. Set to 'Off' to exclude this information.

Midpoint Line with Dynamic Bands, RSI Filter, and AlertsTitle: Midpoint Line with Dynamic Bands, RSI Filter, and Alerts
Description:
This Pine Script indicator provides a comprehensive analysis tool combining dynamic midpoint bands, RSI filtering, and alert conditions for overbought and oversold market states.
Features:
Dynamic Midpoint Bands:
Calculates the midpoint based on the highest high and lowest low over a user-defined lookback period.
Supports both percentage and fixed point offsets for the upper and lower bands.
Threshold Levels:
Defines overbought and oversold thresholds using a user-specified percentage.
RSI Filter:
Uses a 100-period RSI to filter market trends.
Plots candles in green if RSI > 50 and in red if RSI < 50.
Visual Overlays:
Fills the overbought area in red and the oversold area in green.
Plots green arrows below the bars when RSI > 50 and the price is in the oversold area.
Plots red arrows above the bars when RSI < 50 and the price is in the overbought area.
Alerts:
Generates alerts for potential long and short trading opportunities based on the defined conditions.
How to Use:
Customize the lookback period, percentage offset, fixed point offset, and threshold percentage as needed.
Use the RSI filter to identify the prevailing market trend.
Watch for visual signals (arrows) indicating potential buy or sell opportunities.
Set up alerts to receive notifications when long or short conditions are met.
This script provides traders with a robust tool for identifying key market conditions and making informed trading decisions. Customize the parameters to fit your trading strategy and use the visual cues and alerts to enhance your market analysis.

W and M Pattern with Trend AlertThis script detects W and M patterns in price action and alerts the trader when these patterns occur, providing potential trading opportunities.
W Pattern: A W pattern forms when the price creates two bottoms, separated by a higher low in the middle. It often indicates a reversal from a downtrend to an uptrend. The script plots a green line at the neckline of the W pattern.
M Pattern: An M pattern forms when the price creates two tops, separated by a lower high in the middle. It often indicates a reversal from an uptrend to a downtrend. The script plots a red line at the neckline of the M pattern.
Key Features:
Alerts: The script generates alerts when W or M patterns are detected, allowing traders to stay informed of potential trading opportunities.
Recent Breakout: W and M pattern lines are drawn only after the recent breakout of support or resistance levels, helping traders focus on current market conditions.
Visual Representation: The script visually represents W and M patterns with vertical lines at the neckline, making it easier for traders to identify potential reversal points.
Usage:
Watch for alerts indicating the detection of W or M patterns.
Verify the pattern visually on the chart, paying attention to recent support or resistance levels.
Consider entering a trade based on the direction suggested by the pattern (e.g., long on W pattern, short on M pattern), using additional technical analysis to confirm the trade setup.

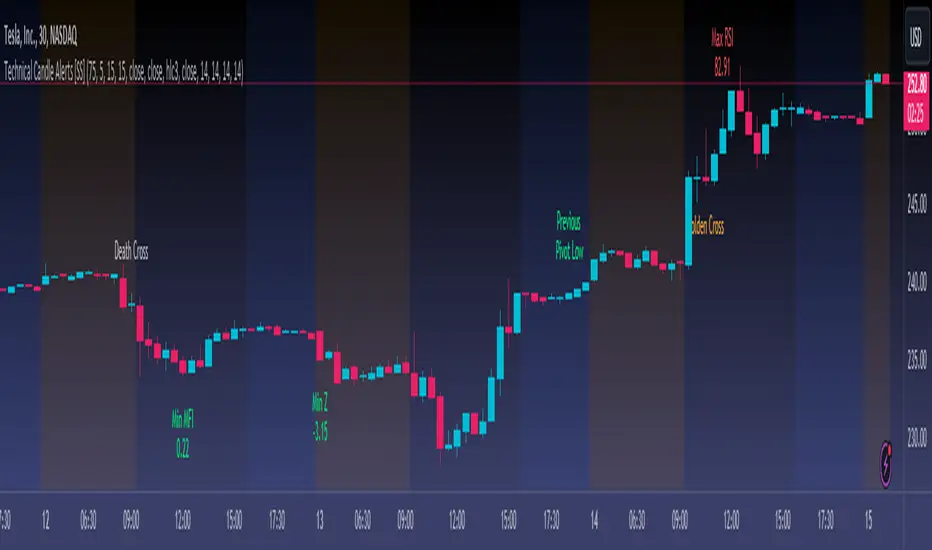
Technical Candle Alerts [SS]Releasing this fun little project indicator.
What is it?
The Technical Candle Alert indicator provides alerts based on multiple underlying technicals, including MFI, RSI, Stochastics, Z-Score, Pivot points and the EMA 50 and EMA 200 Death and Golden Cross.
What does it do?
The indicator looks back over a designated timeframe to look for max and min values of technicals, as well as track the EMA200 and EMA50.
When a candle approaches a previous max zone, pivot point or there is a death or golden cross, the indicator will signal on the candle that has triggered this event. Then you, as the trader, can determine whether you want to listen to the signal or ignore it.
How Does it Work?
The indicator is set to default and generally accepted settings for technicals, however you can modify them as you prefer.
The indicator is also programmed to identify the strongest trend period and set that as the lookback length. The theory is, you want to look at max and min technicals as well as pivot points in a recent area of a strong trend. However, if you want to over-ride the auto trend identification, you can simply unselect "Autotrend" and put in your desired manual lookback length.
The indicator will then keep track of max values for the various technicals and present you with alerts directly over the candle when a Max or Min value is triggered, or a pivot point is entered, etc.
Here are some examples:
Golden Cross:
Death Cross:
Previous Pivot Points:
Various Alerts:
Customization:
You can customize which alerts you want to turn off and on.
As well, there is a signal delay setting (wait setting). This prevents repeated, unnecessary signaling of the same signal. The default wait time is 5 signals, however you can adjust based on your desired tolerance. If you want it to always signal, adjust it to 0.
As indicated before, you can also adjust all of the technicals and the pivot bars for high and low pivots and you can manually set your lookback length.
That is the indicator in a nutshell, let me know if you have any questions that may not have been covered in the description. Its pretty straight forward once you play around with it.
Safe trades everyone and thanks for checking this out!
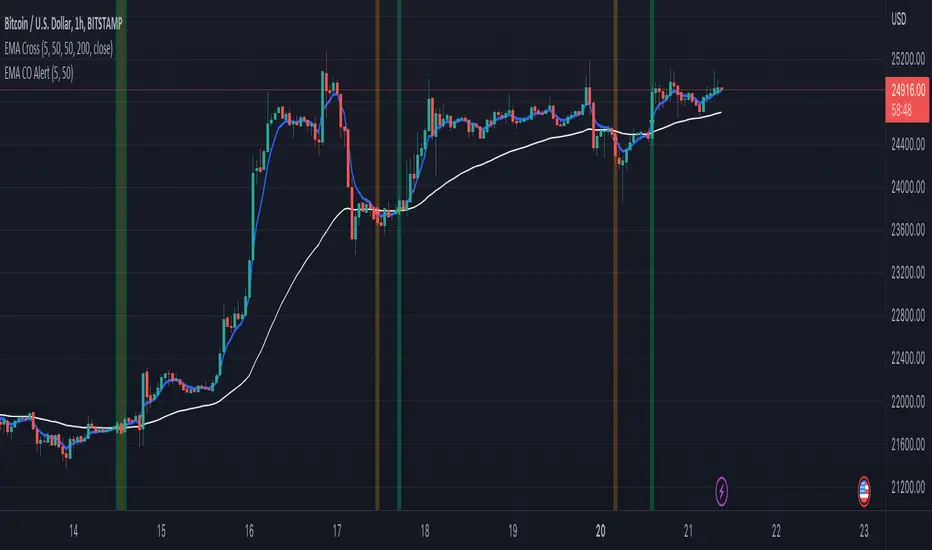
EMA CO AlertEMAs play an important role in identifying the mood of the market.
Frequently used short term EMA is 5 and long term EMA is 50.
This script detects the crossover (+ve and -ve) and generates alerts accordingly.
Steps to apply:
1) Open the script on a desired timeframe.
2) Add this indicator on the chart
3) Choose the values of the 2 EMAs from settings
4) Go to the alert window.
5) Select this indicator from the 'Condition' dropdown
6) Create the alert.
This alert will then run in the background and notify you.
Need to apply a one time alert on the scripts.
In addition to above, you can also add this indicator on the chart and it will show green/red lines on the chart for signals.
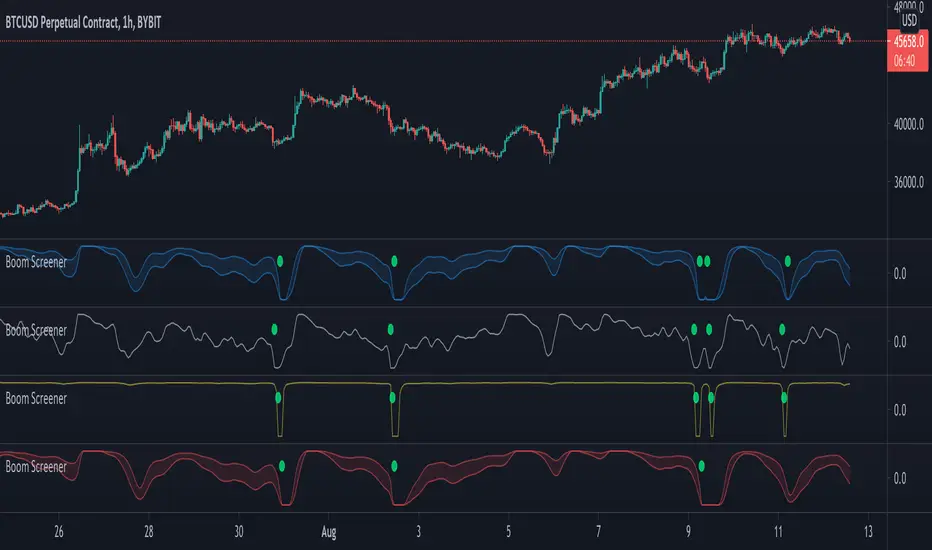
Boom Hunter - Entry Point Screener AlertsStock screener for Boom Hunter and Boom Hunter Pro entry zones. This script will screen 18 different stocks for entry zones.
1. Enter in any ticker ID's from charts you wish to scan in the settings.
2. Go to desired timeframe.
3. Click add alert button at top toolbar.
4. Select Boom Screener indicator, input alert notification settings and/or change alert name and click create.
The script will then scan the stocks and alert you of any entry zones from the timeframe you set the alerts.
A new alert needs to be created for each timeframe you wish to screen.
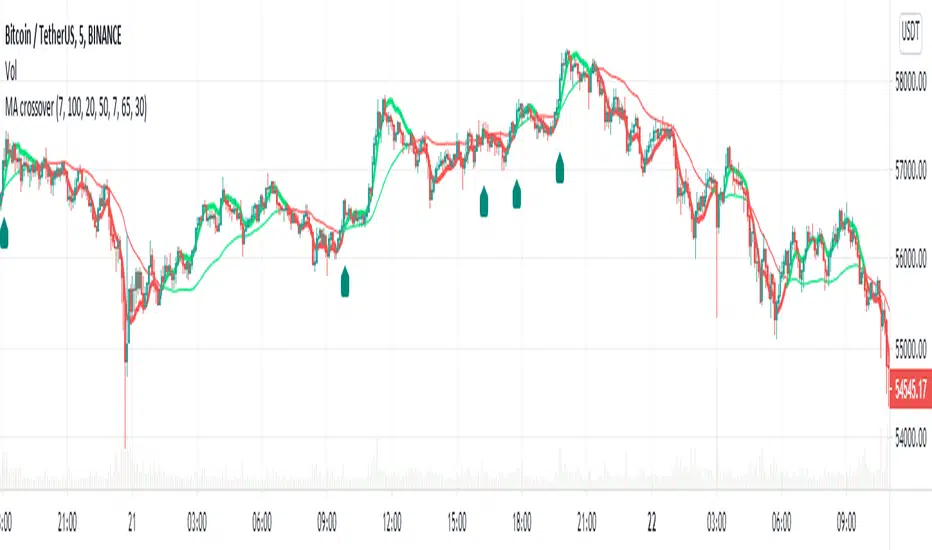
MA Crossover Alerts for Small Quick Profits on 3commas/DCA botDear fellow 3commas users,
This is a the most basic Moving Average crossover technique generating Buy Alerts.
This is especially written for those of you who want to link this basic crossover strategy with your 3commas DCA bot .
Buy Alerts
Moving averages available:
- Simple Moving Average (SMA)
- Exponential Moving Average (EMA)
- Weighted Moving Average (WMA)
- Hull Moving Average (HullMA)
- Volume Weighted Moving Average (VMWA)
- Running Moving Average (RMA)
- Triple Exponential Moving Average (TEMA)
Recommended settings for using with 3commas DCA bot:
Interval:
3m to 15m
3commas bot setup:
- TP/TTP: 0.3%/0.1%,
- Base Order: Your choice ,
- Safety Order: 1.2 * Base order
- Safety Order Volume Scale: 1.2,
- Safety Order Step Scale: 1.5,
- Max Active Deals: Your choice ,
- Price Deviation to Open Safety Order (% from initial order): 0.2%,
- Max Safety Trades Count: 7,
- Simulatenous Deals per Same Pair: 3
> Create Alert with Buy Alert and link it to your bot "Message for deal start signal"
TTM SQUEEZE with ALERT by NM// ######################################################################################
// This script was created because the original TTM Squeeze script
// did trigger when only one of the Bollinger Bands was
// in the Keltner channel. It now gives the option to use it as was
// or to force it to only give a signal when both BB are in the Keltner channels
//
// Furthermore an alert was added to fire when we are squeezing
// no matter which option your choose (original or strict)
//
// To create an alert, click on the alerts in the right column on your screen
// then click on the +button to add an alert.
// Select from the conditions "CTTV Squeeze" and "Once per bar close"
// Keep in mind that you set this alert for one instrument and one particular time frame
//
// If you would have any questions, contact me :
// TradingView : @Nico.Muselle
// ######################################################################################
How to start using this script ?
1. Add this script to your favorites
2. Click on the Indicator-button on the top bar of your chart
3. Click on Favorites and find CTTV TTM
Do also check out my other indicators :
Percentage change -
Power Moving Average Pro - (use Moving Averages of higher time frames on lower time frame charts) -
Power Moving Average - (use 1 moving average of a higher time frame on the current time frame) -
BitFinex Longs vs. Shorts -
Relative Strength Index Direction -
Reversal Candles -
EMADiff -
Improved Linear Regression Bull and Bear Power v02 -
Improved Linear Regression Bull and Bear Power v01 -
PS : Sorry about the messy chart - Bottom indicators show the TTM Squeeze, top one being the original posted here, bottom one being the more strict option.

Pivot alerts by Funded-TraderThis indicator draws Standard Pivot Levels on all products on all timeframes.
The P Pivot is included, and it goes as far as R3 and S3, as pivots 4 and 5 are rarely reached in the market.
This indicator differs from the "Standard Pivot" published by TradingView as this can be used to set-up an Alert: just add a new alert, pick "crossing" and in value pick "Pivot Alerts"
I have chosen a neutral colour Orange for all pivot levels.

Periodic Volume Time Velocity ProfileThis is the Periodic Volume Time Velocity Profile (PVTVP). It is an advanced professional profiling tool that goes beyond standard volume analysis by introducing Time and Velocity (Flow Rate) as profile dimensions.
By analyzing high-resolution intra-bar data, it builds
precise profiles for any custom period (Session, Day, Week, etc.),
helping you understand not just *where* the market traded,
but *how* it traded there.
## The 3 Dimensions of the Market
Unlike standard tools that only show Volume, PVTVP allows you
to switch between three critical metrics:
1. **VOLUME Profile (The "Where"):**
* Shows standard acceptance. High volume nodes (HVN)
are magnets for price.
2. **TIME Profile (The "How Long"):**
* Similar to TPO, it measures how long price spent at each
level.
* **High Time:** True acceptance and fair value.
* **Low Time:** Rejection or rapid movement.
3. **VELOCITY Profile (The "How Fast"):**
* Measures the **speed of trading** (Contracts per Second).
This reveals the hidden intent of market participants.
* **High Velocity (Fast Flow):** Aggression. Initiative
buyers/sellers are hitting market orders rapidly. Often
seen at breakouts or in liquidity vacuums.
* **Low Velocity (Slow Flow):** Absorption. Massive passive
limit orders are slowing price down despite high volume.
Often seen at major reversals ("hitting a brick wall").
## Key Features
1. **Statistical Volume Profile Engine:** For each bar in the selected
period, the indicator builds a complete volume profile on a lower
'Intra-Bar Timeframe'. Instead of simple tick counting, it uses
**statistical models ('PDF' allocation)** to distribute volume
across price levels and **advanced classifiers ('Dynamic' split)**
to determine the buy/sell pressure within that profile.
2. **Flexible Profile Display:** The **finalized profile** (plotted at
the end of each period) can be visualized in three distinct
ways: 'Up/Down' (buy vs. sell), 'Total' (combined volume),
and 'Delta' (net difference).
3. **Developing Key Levels:** The indicator also plots the developing
Point of Control (POC), Value Area (VA), VWAP, and Standard
Deviation bands in real-time as the period unfolds, providing
live insights into the emerging market structure.
4. **Dynamic Row Sizing:** Includes an option ('Rows per Percent')
to automatically adjust the number of profile rows (buckets)
based on the profile's price range, maintaining a consistent
visual density.
5. **Integrated Alerts:** Includes 12 alerts that trigger when the
main price crosses over or under the key developing levels:
POC, VWAP, Value Area High/Low, and the +/- Standard
Deviation bands.
**Caution: Real-Time Data Behavior (Intra-Bar Repainting)**
This indicator uses high-resolution intra-bar data. As a result, the
values on the **current, unclosed bar** (the real-time bar) will
update dynamically as new intra-bar data arrives. This behavior is
normal and necessary for this type of analysis. Signals should only
be considered final **after the main chart bar has closed.**
---
**DISCLAIMER**
1. **For Informational/Educational Use Only:** This indicator is
provided for informational and educational purposes only. It does
not constitute financial, investment, or trading advice, nor is
it a recommendation to buy or sell any asset.
2. **Use at Your Own Risk:** All trading decisions you make based on
the information or signals generated by this indicator are made
solely at your own risk.
3. **No Guarantee of Performance:** Past performance is not an
indicator of future results. The author makes no guarantee
regarding the accuracy of the signals or future profitability.
4. **No Liability:** The author shall not be held liable for any
financial losses or damages incurred directly or indirectly from
the use of this indicator.
5. **Signals Are Not Recommendations:** The alerts and visual signals
(e.g., crossovers) generated by this tool are not direct
recommendations to buy or sell. They are technical observations
for your own analysis and consideration.

Intra Bar Volume ProfileThis indicator provides a high-resolution volume profile analysis for every single bar on the chart. It builds this profile by sampling data from a lower intra-bar timeframe, allowing for a granular view of price distribution and buying/selling pressure within the bar.
Key Features:
Intra-Bar Profile Engine: For each bar on the main chart, the indicator builds a complete volume profile on a lower 'Intra-Bar Timeframe'. It uses:
Statistical Models ('Allot model'): Distributes volume across price levels using 'PDF' (Probability Density Function) or 'Classic' (close) methods.
Buy/Sell Classifiers ('Volume Estimator'): Splits volume using a 'Dynamic' (trend/wick-based) or 'Classic' (candle color) model.
On-Chart Visualization (Overlay): The analysis is rendered directly onto the price bars:
Point of Control (POC): A line showing the price level with the most volume for that bar.
Value Area (VA): A colored box representing the price range where the specified percentage (e..g., 50%) of volume was traded.
VWAP: Displays the volume-weighted average price (VWAP) for the bar as a separate line.
Integrated Alerts: Includes 8 alerts that trigger when the main price crosses over or under the key intra-bar levels: POC, VWAP, and the Value Area High/Low.
Caution: Real-Time Data Behavior (Intra-Bar Repainting) This indicator uses high-resolution intra-bar data. As a result, the values on the current, unclosed bar (the real-time bar) will update dynamically as new intra-bar data arrives. This behavior is normal and necessary for this type of analysis. Signals should only be considered final after the main chart bar has closed.
DISCLAIMM
For Informational/Educational Use Only: This indicator is provided for informational and educational purposes only. It does not constitute financial, investment, or trading advice, nor is it a recommendation to buy or sell any asset.
Use at Your Own Risk: All trading decisions you make based on the information or signals generated by this indicator are made solely at your own risk.
No Guarantee of Performance: Past performance is not an indicator of future results. The author makes no guarantee regarding the accuracy of the signals or future profitability.
No Liability: The author shall not be held liable for any financial losses or damages incurred directly or indirectly from the use of this indicator.
Signals Are Not Recommendations: The alerts and visual signals (e.g., crossovers) generated by this tool are not direct recommendations to buy or sell. They are technical observations for your own analysis and consideration.

Periodic Volume ProfileThis indicator visualizes volume profiles that are dynamically anchored to market structure events, rather than fixed time intervals. It builds these profiles using high-resolution intra-bar data to provide a precise view of where value is established during critical market phases.
Key Features:
Event-Based Profile Anchoring: The indicator starts a new profile based on one of three user-selected events ('Profile Anchor'):
Swing: A new profile begins when the 'impulse baseline' (derived from delta) changes. This baseline adjusts when a new price pivot is confirmed: When a price high forms, the baseline moves to the lower of its previous level or the peak delta (max of delta O/C) at the pivot. When a price low forms, it moves to the higher of its previous level or the trough delta (min of delta O/C).
Structure: A new profile begins immediately on the bar that confirms a market structure break (e.g., a new HH or LL, based on a sequence of price pivots).
Delta: A new profile begins immediately on the bar that confirms a break in the cumulative delta's market structure (e.g., a new HH or LL in the delta).
Statistical Profile Engine: For each bar in the anchored period, the indicator builds a volume profile on a lower 'Intra-Bar Timeframe'. It uses:
Statistical Models ('Allot model'): Distributes volume across price levels using 'PDF' (Probability Density Function) or 'Classic' (close) methods.
Buy/Sell Classifiers ('Volume Estimator'): Splits volume using a 'Dynamic' (trend/wick-based) or 'Classic' (candle color) model.
Note on Anchor Lag: The different anchor types have different delays. 'Structure' and 'Delta' profiles begin in real-time on the confirmation bar. The 'Swing' profile calculation is plotted retroactively to the pivot's origin, as the pivot is only confirmed Pivot Right Bars after it occurs.
Flexible Visualization Modes: The finalized profile (plotted at the end of each period) can be displayed in three ways: 'Up/Down' (buy vs. sell), 'Total' (combined volume), and 'Delta' (net difference).
Developing Real-Time Metrics: The indicator plots the developing Point of Control (POC), Value Area (VA), VWAP, and Standard Deviation bands in real-time as the new profile forms.
Dynamic Row Sizing: Includes an option ('Rows per Percent') to automatically adjust the number of profile rows (buckets) based on the profile's price range, maintaining a consistent visual density.
Integrated Alerts: Includes 13 alerts that trigger for:
A new profile reset ('Profile was resetted').
Price crossing any of the 6 developing levels (POC, VA High/Low, VWAP, StdDev High/Low).
Caution: Real-Time Data Behavior (Intra-Bar Repainting) This indicator uses high-resolution intra-bar data. As a result, the values on the current, unclosed bar (the real-time bar) will update dynamically as new intra-bar data arrives. This behavior is normal and necessary for this type of analysis. Signals should only be considered final after the main chart bar has closed.
DISCLAIMER
For Informational/Educational Use Only: This indicator is provided for informational and educational purposes only. It does not constitute financial, investment, or trading advice, nor is it a recommendation to buy or sell any asset.
Use at Your Own Risk: All trading decisions you make based on the information or signals generated by this indicator are made solely at your own risk.
No Guarantee of Performance: Past performance is not an indicator of future results. The author makes no guarantee regarding the accuracy of the signals or future profitability.
No Liability: The author shall not be held liable for any financial losses or damages incurred directly or indirectly from the use of this indicator.
Signals Are Not Recommendations: The alerts and visual signals (e.g., crossovers) generated by this tool are not direct recommendations to buy or sell. They are technical observations for your own analysis and consideration.

Pivot Orderflow DeltaThis indicator analyzes order flow by calculating a continuous Cumulative Volume Profile Delta (CVPD). It plots this delta as a series of "delta candles" and identifies divergences and structural pivot levels.
Key Features:
Statistical Delta Engine: For each bar, the indicator builds a high-resolution volume profile on a lower 'Intra-Bar Timeframe'. It uses statistical models ('PDF' allocation) and advanced classifiers ('Dynamic' split) to determine the buy/sell pressure, which is then accumulated.
Cumulative Delta Candle Visualization: The indicator plots the continuous, accumulated delta as a series of candles, where for each bar:
Open: Is the cumulative delta value of the previous bar.
Close: Is the new total cumulative delta.
High/Low: Represent the peak/trough cumulative delta reached during that bar's formation.
Dynamic Pivot Baseline: The indicator plots a separate dynamic baseline ('Impulse Start') that adjusts when a new price pivot is confirmed.
When a price high forms, the baseline moves to the lower of its previous level or the peak delta (max of delta candle O/C) at the pivot.
When a price low forms, the baseline moves to the higher of its previous level or the trough delta (min of delta candle O/C) at the pivot.
Full Divergence Suite (Class A, B, C): A built-in divergence engine automatically detects and plots Regular (A), Hidden (B), and Exaggerated (C) divergences between price and the peak/trough of the delta candles (High/Low).
Detailed Pivot Confluence: The indicator plots distinct markers to differentiate between pivots occurring only on the price chart, only on the delta oscillator, or on both simultaneously.
Note on Confirmation (Lag): Divergence and pivot signals rely on a confirmation method. A pivot is only plotted after the Pivot Right Bars input has passed, which introduces an inherent lag.
Integrated Alerts: Includes 23 comprehensive alerts for:
The start and end of all 6 divergence types.
The detection of a new Impulse Start pivot.
Delta/volume agreement/disagreement.
Delta crossing the zero line.
The formation of price-only or delta-only pivots.
Caution: Real-Time Data Behavior (Intra-Bar Repainting) This indicator uses high-resolution intra-bar data. As a result, the values on the current, unclosed bar (the real-time bar) will update dynamically as new intra-bar data arrives. This behavior is normal and necessary for this type of analysis. Signals should only be considered final after the main chart bar has closed.
DISCLAIMER
For Informational/Educational Use Only: This indicator is provided for informational and educational purposes only. It does not constitute financial, investment, or trading advice, nor is it a recommendation to buy or sell any asset.
Use at Your Own Risk: All trading decisions you make based on the information or signals generated by this indicator are made solely at your own risk.
No Guarantee of Performance: Past performance is not an indicator of future results. The author makes no guarantee regarding the accuracy of the signals or future profitability.
No Liability: The author shall not be held liable for any financial losses or damages incurred directly or indirectly from the use of this indicator.
Signals Are Not Recommendations: The alerts and visual signals (e.g., crossovers) generated by this tool are not direct recommendations to buy or sell. They are technical observations for your own analysis and consideration.

Cumulative Volume Profile DeltaThis indicator calculates the Cumulative Volume Profile Delta (CVPD). It constructs a high-resolution volume profile for each bar using intra-bar data, then derives and accumulates the delta from that profile to show net buying/selling pressure.
Key Features:
Statistical Volume Profile Engine: For each bar, the indicator builds a high-resolution volume profile on a lower 'Intra-Bar Timeframe'. Instead of simple tick counting, it uses statistical models ('PDF' allocation) to distribute volume across price levels and advanced classifiers ('Dynamic' split) to determine the buy/sell pressure before accumulation.
Periodic Accumulation: The CVPD accumulation is anchored to a user-defined 'Anchor Timeframe' (e.g., daily, weekly). This cyclical reset allows to analyze the build-up of pressure within specific trading periods.
"Delta Candle" Visualization: The periodic CVPD is shown as a candle, where:
Open: The CVPD value at the start of the period (or zero).
High/Low: Represent the peak buying (CVD High) and selling (CVD Low) pressure within that period's profile.
Close: The final net delta value (CVD) for the period.
Dual CVD & Divergence Engine: The indicator calculates two CVPDs: a Periodic one (for plotting) and a Continuous one (non-resetting). The continuous line is used as a stable source for the built-in divergence engine (detecting Regular, Hidden, and Exaggerated).
Dynamic Divergence Plotting: Divergence markers are plotted relative to the periodic (candle) CVPD. They automatically adjust their vertical position after a reset to remain visually aligned with the plotted candles.
Note on Confirmation (Lag): Divergence signals rely on a pivot confirmation method to ensure they do not repaint.
The Start of a- divergence is only detected after the confirming pivot is fully formed (a delay based on Pivot Right Bars).
The End of a divergence is detected either instantly (if the signal is invalidated by price action) or with a delay (when a new, non-divergent pivot is confirmed).
Multi-Timeframe (MTF) Capability:
MTF Output: The entire analysis (Delta Candles, Divergences) can be calculated on a higher timeframe (using the Timeframe input), with standard options to handle gaps (Fill Gaps) and prevent repainting (Wait for...).
Limitation: The Divergence detection engine (pivDiv) is disabled if a Higher Timeframe (HTF) is selected.
Integrated Alerts: Includes 18 comprehensive alerts for:
The start and end of all 6 divergence types.
The periodic CVPD crossing the zero line.
Conditions of agreement or disagreement between the delta and the main bar's direction.
Caution: Real-Time Data Behavior (Intra-Bar Repainting) This indicator uses high-resolution intra-bar data. As a result, the values on the current, unclosed bar (the real-time bar) will update dynamically as new intra-bar data arrives. This behavior is normal and necessary for this type of analysis. Signals should only be considered final after the main chart bar has closed.
DISCLAIMER
For Informational/Educational Use Only: This indicator is provided for informational and educational purposes only. It does not constitute financial, investment, or trading advice, nor is it a recommendation to buy or sell any asset.
Use at Your Own Risk: All trading decisions you make based on the information or signals generated by this indicator are made solely at your own risk.
No Guarantee of Performance: Past performance is not an indicator of future results. The author makes no guarantee regarding the accuracy of the signals or future profitability.
No Liability: The author shall not be held liable for any financial losses or damages incurred directly or indirectly from the use of this indicator.
Signals Are Not Recommendations: The alerts and visual signals (e.Example: crossovers) generated by this tool are not direct recommendations to buy or sell. They are technical observations for your own analysis and consideration.
