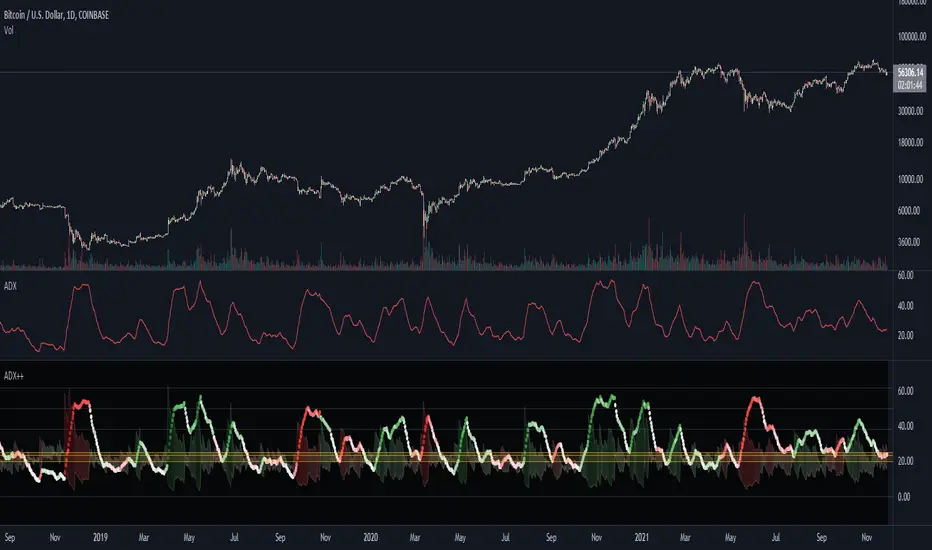
ADX and DI With Coloured Histogram BUY/SELLWe display here the ADX has a colored histogram, which is
- green when ADX and DI+ are higher then DI-, while the ADX is increasing, meaning that we are in a potential uptrend--> we should rather be long (only buy if you have other concordant signals !)
- red when ADX and DI- are higher then DI+, while the ADX is increasing, meaning that we are in a potential downtrend --> we should rather be short (only sell if you have other concordant signals !)
- not visible if none of these conditions are met, meaning that the indicator do not show a potential trend --> don't use this indicator to buy or sell at this stage
"adx" için komut dosyalarını ara

KK_Average Directional Index (ADX) Higher TFHey guys,
sometimes you just want to plot an Indicator value from a higher Timeframe on your Chart. For most Indicators this is pretty straightforward however there is one Indicator that has been giving me quite a headache while trying to do this: The Average Directional Index . Anyway after going through almost 200 versions of this script I finally found a solution that works and thought I would share this with you, since I'm sure some of you have encountered the same problem.
How it works
Go to your desired Instrument/Timeframe and add the Script
Under Settings in the field for "Higher ADX TF" put the Timeframe-code you want to pull the ADX Values from.
- Codes: Monthly - M, Weekly W, Daily - D
- Codes Intraday: The amount of hours in minutes, e.g. if you want to pull values from the 4h-Chart the code is 240 (60 for 1h, 15 for 15m ...)
In some cases (see below) the calculation might not be correct. So make sure the values are correct:
a) Write down the latest ADX of the higher TF while you are on the lower TF
b) Switch the Resolution to the higher TF
c) Compare the value you have just written down to the next to last value. They should be the same.
d) Switch back the Resolution to the lower TF and you're good to go.
Limitations
You can only pull values from higher Timeframes, e.g. you're on a 4h Chart, so you can only pull values from the Daily, Weekly and Monthly Chart. You can't pull values from the 1h Chart.
You can only pull values from Timeframes, where the higher Timeframe Close always has a corresponding Close on the lower Timeframe, e.g. you can't pull values from the 3h Chart when you are on a 2h Chart. This should be pretty rare.
The Script needs a certain amount of Data from the Higher TF before the calculated values are correct. I have tested this on several Instruments and the Script usually needs approximately 100 Bars on the higher Timeframe (often less) for the values to be correct (error < 1%).
So when the difference between your lower Timeframe and you higher Timeframe is large, e.g. you want to pull the Daily ADX value on a 15m-Chart, the calculation can be wrong. This can lead to errors in 2 Cases:
a) Backtesting: When you go over old data and get close to the last available Bar the Data will be wrong. This will limit the amount of data you can backtest.
b) Live values: When the difference between the two Timeframes is too large, it is possible that even live values are wrong, e.g. this will be the case when you are trying to pull the Daily ADX value on a 5 minute Chart. Always check if the calculation works with your desired combination of Timeframes before using it (see above).
I hope this is useful for you and whish all of you successful trading!
Best regards
Kurbelklaus
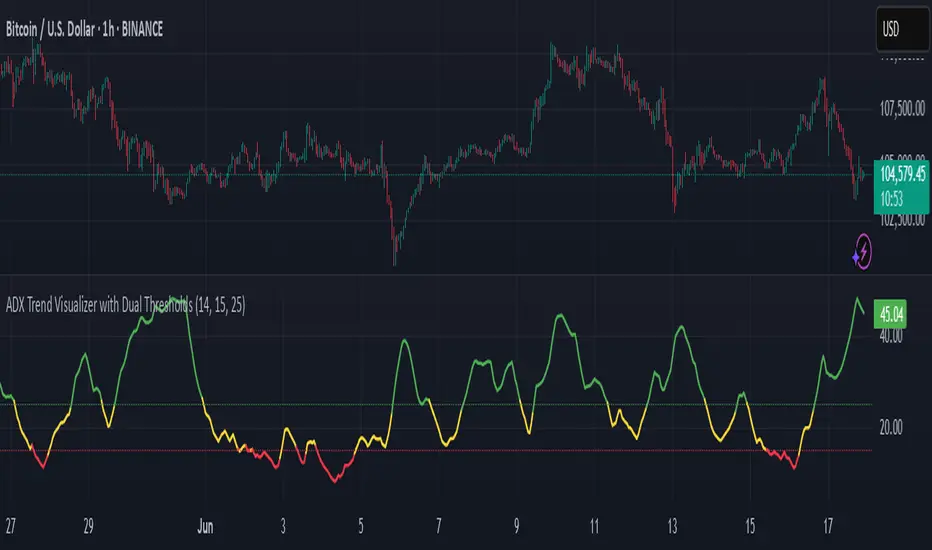
ADX Trend Visualizer with Dual ThresholdsADX Trend Visualizer with Dual Thresholds
A minimal, color coded ADX indicator designed to filter market conditions into weak, moderate, or strong trend phases.
Uses a dual threshold system for separating weak, moderate, and strong trend conditions.
Color coded ADX line:
Green– Strong trend (above upper threshold)
Yellow – Moderate trend (between thresholds)
Red – Weak or no trend (below lower threshold)
Two horizontal reference lines plotted at threshold levels
Optional +DI and -DI lines (Style tab)
Recommended Use:
Use on higher time frames (1h and above) as a trend filter
Combine with entry/exit signals from other indicators or strategies
Avoid possible false entries when ADX is below the weak threshold
This trend validator helps highlight strong directional moves and avoid weak market conditions
ADX Thrust Reversal & Trend
Created by Love Sharma, CMT, CFTe
the idea is simple. there needs to be thrust in prices before adx goes above any barrier or level say 25/10 or even 10/ The Di plus or Di minus should be above ADX. This indicates the change in direction or change in underlying price and obviously followed by ADX indicator which is dependent on user which level it exceed.
The ADX - Shows Trend Strength
The =/- Di show Thrust or reversal in prices.
it helps in entering the directional change in prices early rather than waiting for ADX

ADX Volume Trend
Thie indicator is a modified and upgraded version of the popular ADX tool.
ADX is used to determine the strength of a trend, and also to determine the direction in which the trend is likely to go.
With this script, I have added in the formula the usage of volume, leading to the following functionality.
The length is used to determine the period to calculate the trend strength and direction, and the average is used to then determine the oscillator and to confront the previous line.
The volume average determines how many volumes bars the indicator should use to determine if a volume bar is above or below average if volume mode is selected.
With the volume mode on, you'll get the DI+ and DI- lines, which are by default displayed as a histogram that calculates the difference between the two lines, called "Directional difference", are calculated using also the volume in the formula, multiplying the normal output by the volume multiplier. I suggest using this mode in high-volume markets.
The trend strength difference is the area calculated using the difference between the ADX line and his moving average and can be used to analyze divergences in the swing points.
It has a lot of improvements and new functionalities, like:
- Histogram to show the output at best
- Averages to compare the data
- The option to include the volume inside of the formula
- Other options and esthetic changes
This indicator is created to improve the usability of the popular ADX indicator, including the very important variable of the volumes, in fact, it's the best to use for the Volume Spread Analysis.

ADX / RSI Strategy by Trade Rush (created by SirPoggy) This is one of many new strategies coming soon which were seen on Trade Rush
This one is the ADX / RSI Strategy seen here:
https:www.youtube.com/watch?v=uSkGE0ujyn4
While the strategy has been modified slightly to use the DMI instead of the ADX, the core of the strategy is essentially the same
Long signals are generated when the RSI is above 70, close is above the 200EMA, and the ADX is above 25 (added is the plus DMI over 25 and minus DMI below 20)
Stop loss is placed below /above the 21 EMA, however, there is a deviation required to ensure price is not too close to where a stop loss would be placed.
Short signals are generated when the RSI is below 30, close is below the 200EMA, and the ADX is above 25 (added is the minus DMI over 25 and plus DMI below 20)
I do not recommend using this strategy but I have provided this code for educational purposes.
Thanks!
Let me know which strategy you'd like coded next in the comments below.

ADX Histogram with DI linesInspired by the user scarf from Tradingview. In contrast with that other indicator, this one instead of a simple moving average (SMA) for the ADX calculations, uses a running moving average (RMA) or also known as Wilder's Average. I like having a histogram for the DI lines over just having lines alone because it makes it easier to see. In addition I made it so that values less than 5 for the DI lines are colored lightly to note that the movement was less significant(might not matter but some might care about it, atleast I do). The ADX has a color fainting effect too, and when it goes above the threshold then it becomes black to note that it is trending, as the indicator suggests.
The advantages with these additions and changes are that it shows a more traditional moving average like the original author Wellers Wilder suggested and you can see the crossings and directional movement changes easier from seeing the colors on the histogram easier than you would by looking at the DI lines alone. The disadvantages are you won't be able to tell when the ADX line is above both DI lines and when the ADX then makes a decrease from there(which can sometimes show a reversal), but personally it doesn't matter too much to me and perhaps to those who care more about seeing the direction than having to focus on all those 3 lines crossing all over the place.

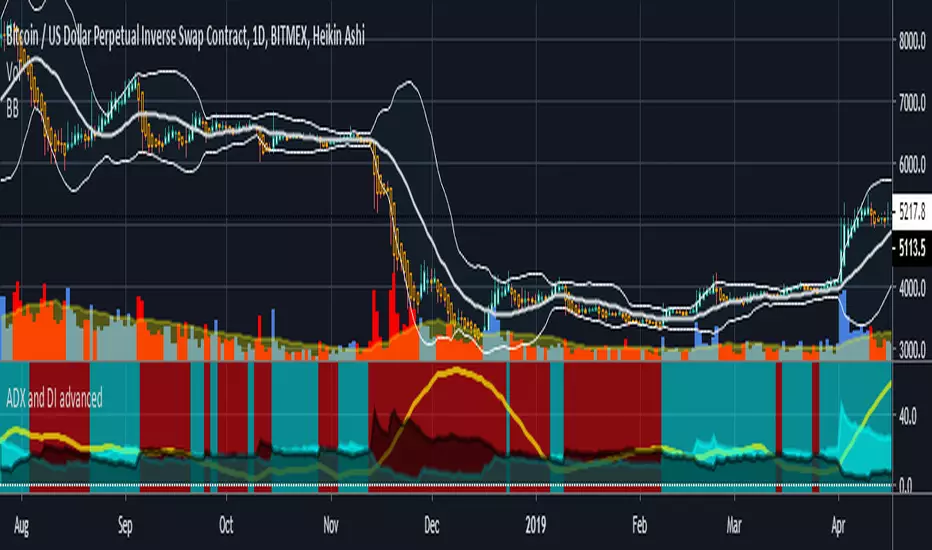
ADX and DI advancedThis is a special ADX and DI which includes the following additional functions:
cr1- allows you to set alerts based on if DI+ and DI- crossover each other leading to a new trend
cr2- shows a constant background highlight of a trend.
ADX threshold- you can set a threshold value so that any readings below that are ignored and the indicator paints a blank black area instead.
cr3 and cr4 are experimental- would not reccommend using yet (they were part of a test I did)
For a detailed video on how I use this indicator please go here
youtu.be
The article version was published here originally
bitcointradingtoday.com
ADX DINGUE v5This is the updated script for PinceScrip V5
3x DMI and ADX indicator into 1.
You can turn on and off all 3x DMI and all 3x ADX and or customize their settings manually.
I also added my 3 line system, which is a homemade calculation from the DMI lines (P+N), and instead turns them into a single line.
There are also several options for histogram, ADX line, crosses, colors, overextended ...
---------------------
In closing, no indicator can give perfect signals, you need to use them in conjunction with other information to make better decisions.
I hope you like my indicators and that they help your trading.
If you have any questions please ask.
Thank you.

ADX Heatmap & Di's + Fib Referencial by [JohnnySnow]For quicker and easier interpretation, ADX line is displayed in a heatmap style. The more absolute difference between both DIs, the more intense the color.
Because some people use 20 ADX reference and others use 25 ADX reference to confirm the trend, I just add both as reference lines in a 'golden box'
Additionally, reference lines were added with default values set to Fib levels
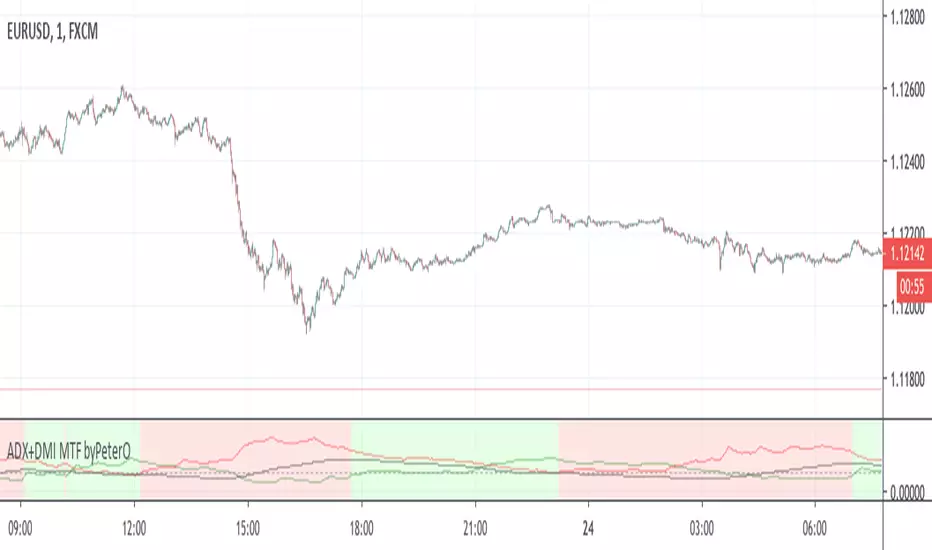
ADX+DMI MTF byPeterOThe goal of this study was to use ADX from Higher Timeframe - to determine trend direction
Why? Because ADX is very sensitive, able to show trend ending without any delay, but not in the middle of it.
Being able to see such immediate trend change on higher timeframe, is a great indicator of trend direction.
Adding just security() calls to 'highest', 'lowest' and 'close' didn't seem right, because it produced some ugly ADX, D+ and D- plotlines.
I wanted to see plotlines, which look exactly like those on actual higher timeframe. Therefore I modified the calculations.
You can read more about my take on (not) using security() calls in my other source code indicator RSI MTF: link in comments.
On top of all that, I added interpretation of DMI readings, because it is not as simple as plus>minus + ADXrising = uptrend.
So GREEN background means higher timeframe uptrend and RED background means downtrend.
ADX-DI Multi-TimeframePlots the multiple time frame version of the classic ADX-DI indicoator.
ADX
DI+ and DI-
ADX Threshold
DI Histogram difference with 2 threshold lookback values
For a similar multiple time frame indicator see the following scripts. They both use the historical + projection approach to yield non-repainting indicators.
Fisher Transform Multi-Timeframe
Laguerre RSI Multi-Timeframe

ADX +- DiThis Adx +-Di is just a complete version of what the ADX is supposed to signal.
So you have:
15 (contraction), 20 (threshold), 30 (expansion), 40 (resistance) levels.
Below 20 the price is not trending
Above 30 the price is trending
Below 15 price has been in contraction for too long
Between 20 and 30 price is in a "transition zone".
I finally added a "Resistance" level (40), which has to be adapted to best represent the historical levels where price usually encounters resistance, and where the price can be declared "overtrending", which means a return to lower levels is likely to happen.
I've chosen mild colors, and set the Adx Color to White, because I use black background, you can easily change that.
Enjoy
-Maurice

ADX-DI trend indication - JDThis indicator is based on the formulas in the original "ADX and DI" script of Masa Nakamuro
The indicator gives a multiplication of ADX and the DI+ and DI-values, color coded for bullish or bearish momentum.
The indicator was optimised for use with HA-candles, but works with regular candles as well and shows general market direction en divergence in a simpler visual way than the normal ADX-DI lines.
A threshold mask and the actual DI-lines kan be shown or omitted as preferred
JD.

ADX-DI trend indication - JDThis indicator is based on the formulas in the original "ADX and DI" script of Masa Nakamuro
The indicator gives a multiplication of ADX and the DI+ and DI- values, color coded for bullish or bearish momentum.
The indicator was optimised for use with HA-candles, but works with regular candles as well and shows general market direction en divergence in a simpler visual way than the normal ADX-DI lines.
A threshold mask and the actual DI-lines kan be shown or omitted as preferred
JD.

ADX and DI (Average Directional Index) - CORRECT FORMULASo... the popular version of "ADX and DI" shown on tradingview by masanakamura uses some wacky and incorrect formula for DI and uses SMA instead of the Wilder's MA that ADX/DI is supposed to use, and doesn't give the correct ADX and DI values. The Tradingview "Average Directional Index" uses the correct calculation but doesn't show DI+ and DI-. So, here it is with the DI+ and DI- visible. Enjoy!

ADX-DI - Made EasyThis indicator is a visually improved version of ADX. It makes it much easier to see what's happening by simplifying those confusing, intersecting lines. With this, you can detect the ADX direction more clearly. All the features are also explained in the tooltips of the input fields. Some extra features are included, such as average top and bottom calculation and divergences.
Please note that the divergences on ADX are just experimental and are based on calculations, so there is no guarantee the direction will change.

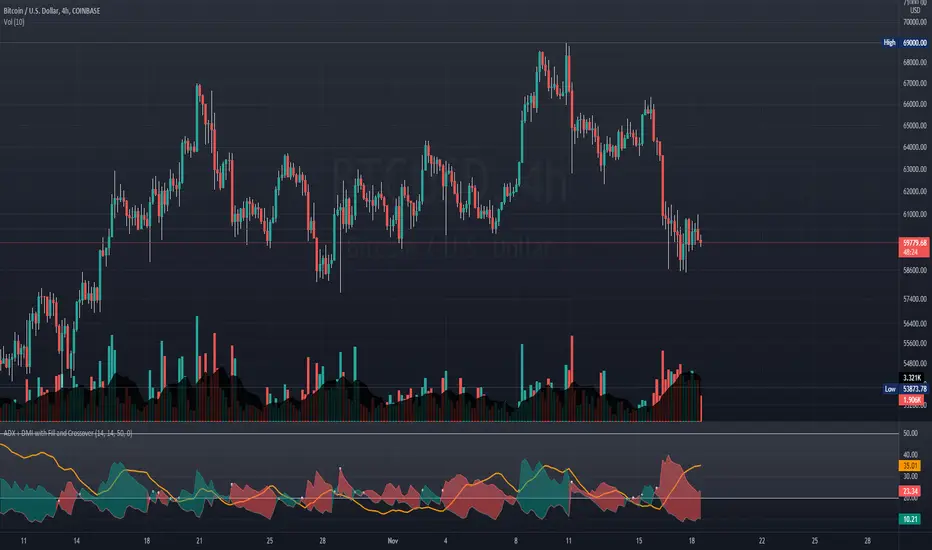
ADX + DMI with Fill and CrossoverBetter visuals for the ADX/DMI technical indicator.
I filled the DI+ and DI- with color to easily track the trend. Also, I added shapes (+) / (x) once the DI+ and DI- crossover each other.
You can also set two horizontal lines so you can easily track where the ADX value is at.
ADX and DI Advance [SystemAlpha]Our version of ADX DMI indicator with option to show ADX as histogram or line.

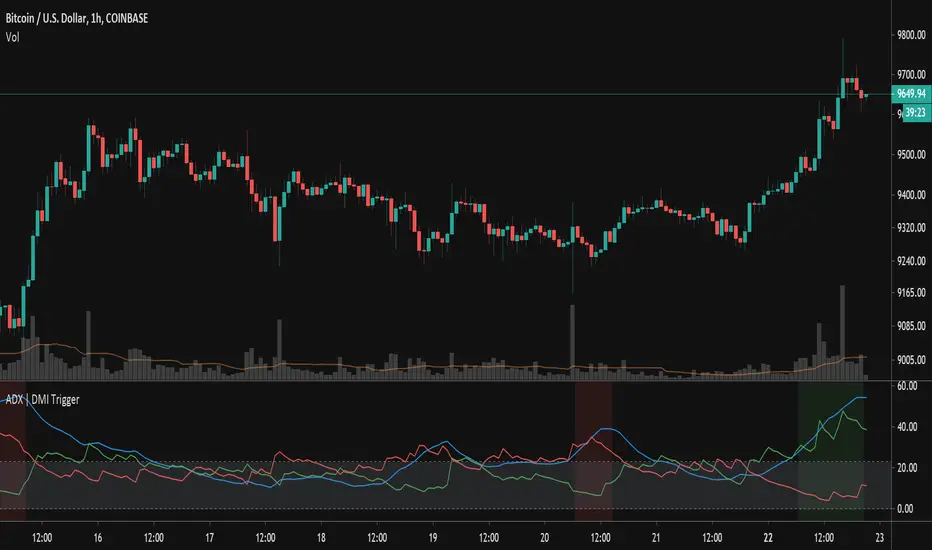
ADX TriggerThis script fires off a buy alert when the ADX is rising and above a user-defined value (default 25). It fires off a sell signal when ADX starts sloping downward. The lookback period to determine if it is sloping up/down (in bars) is also configurable by the user. The plot highlights green when there is a "go" signal. Thanks to @9e52f12edd034d28bdd5544e7ff92e for the idea.
ADX Free-The line control represents, if the ADX is greater than the line of 20, the price trend is considered strong, some people increase it to 25
-Dynamic adx color to better differentiate movements

ADX Overlap with MACD FilterIt’s a method/study to find trending stocks and cryptocurrencies using two different periods (14, 5) ADX Overlap with a MACD Filter. The MACD filter may or may not be used.
Green shadow implies Trending Uptrend
Red shadow implies Trending Downward
I am a disabled man. Therefore, I am not able to write in detail here today. More Details will follow as time permits. Please let me know if I am missing anything…
Legal Disclaimer: I am not bribed to write here and I am not seeking insider favors. I wrote here so I get replies from fellow viewers to educate myself and for my daily expenses. Hence, if anyone uses this post for making their decisions, I am not responsible for any failures incurred.
Safe Trading!
Kal Gandikota
PS: If you found this script interesting and edifying please follow and upvote.
PS2: Please kindly donate for my daily expenses (atleast as you would on streets) at the following addresses:
'BTC Wallet' - 1NeDC1GvpFa49DFLuT1v28ohFjqtoWXNQ5
ETH Wallet - 0x0450DCB7d4084c6cc6967584263cF6fBebA761D1
'BTS Wallet' - chip-maker
QTUM Wallet - QhqqV3WQV236Tz5ZbPceXXvU8aK2N4i78A
NEO Wallet - AUdiNJDW7boeUyYYNhX86p2T8eWwuELSGr
PS3: To open a cryptocurrency trading account at the brokerage where I trade most for now, please kindly use the following website(with referral code attached):
www.binance.com
PS4: For more information on ADX and MACD, please 'Google' or search here yourself.
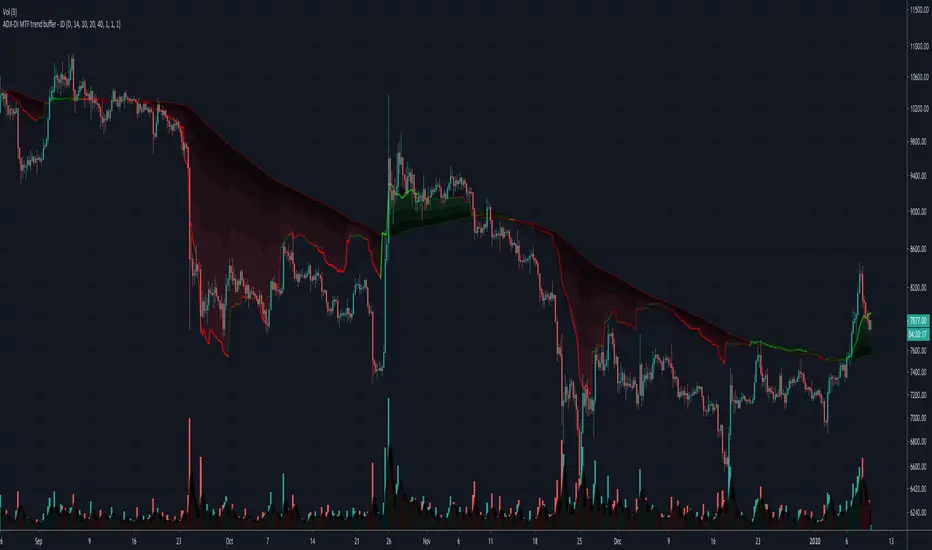
ADX-DI MTF trend buffer - JDThe indicator gives a multiplication of ADX and the DI+ and DI-values, color coded for bullish or bearish momentum
the indicator was optimised for use with HA-candles, but works with regular candles as well
and shows general market direction en divergence in a simpler visual way than the normal ADX-DI lines
a threshold mask can be shown or omitted as preferred
version 3. the indicator is now plotted relative to the 200 ema and can be seen as a "buffer" against price reversal
The timeframe of the indicator can be the current one or custom selected but gives better visual information if a longer timeframe than the current one is used.
The colors can be changed to fit with "Dark mode" or "Light mode"
a scaling option is available to downscale the trend indication relative to the price bars
JD