Supertrend + BB + Consecutive Candles + QQE + EMA [Pineify]Overview
This indicator, developed by Pineify, is a comprehensive tool designed to assist traders in making informed decisions by combining multiple technical analysis methods. It integrates Supertrend, Bollinger Bands (BB), Consecutive Candles, Quantitative Qualitative Estimation (QQE), and Exponential Moving Averages (EMA) into a single, cohesive script. This multi-faceted approach allows traders to analyze market trends, volatility, and potential buy/sell signals with greater accuracy.
Key Features
1. Supertrend: Utilizes the Supertrend indicator to identify the prevailing market trend. It provides clear buy and sell signals based on the direction of the trend.
2. Bollinger Bands (BB): Measures market volatility and identifies overbought or oversold conditions. The script calculates the middle, upper, and lower bands, along with the Bollinger Band Width (BBW) and Bollinger Band %B (BBR).
3. Consecutive Candles: Detects sequences of consecutive bullish or bearish candles, providing signals when a specified number of consecutive candles are detected.
4. Quantitative Qualitative Estimation (QQE): Combines the Relative Strength Index (RSI) with a smoothing factor to generate buy and sell signals based on the QQE methodology.
5. Exponential Moving Averages (EMA): Includes both fast and slow EMAs to identify potential crossovers, which are used as buy and sell signals.
How It Works
- Supertrend: The Supertrend indicator is calculated using a factor and ATR length. It plots the trend direction and generates buy/sell signals when the trend changes.
- Bollinger Bands: The BB indicator calculates the middle band as a Simple Moving Average (SMA) of the closing prices. The upper and lower bands are derived by adding and subtracting a multiple of the standard deviation from the middle band.
- Consecutive Candles: This feature counts the number of consecutive candles that close higher or lower than the previous candle. When the count reaches a specified threshold, it generates a buy or sell signal.
- QQE: The QQE indicator smooths the RSI values and calculates the QQE Fast and QQE Slow lines. Buy and sell signals are generated based on the crossover of these lines.
- EMA: The script calculates fast and slow EMAs and generates buy/sell signals based on their crossovers.
How to Use
1. Inputs: Customize the indicator settings through the input parameters:
- Supertrend Factor and ATR Length
- BB Length
- Consecutive Candles Counting
- QQE RSI Length
- Fast and Slow EMA Lengths
- Enable/Disable Alerts for various signals
2. Alerts: Set up alerts for Supertrend, Consecutive Candles, and EMA crossovers. Alerts can be enabled or disabled based on user preference.
3. Visualization: The indicator plots the Supertrend, Bollinger Bands, and EMA lines on the chart. It also marks buy and sell signals with arrows and labels for easy identification.
Concepts Underlying Calculations
- Supertrend: Based on the Average True Range (ATR) to determine the trend direction and potential reversal points.
- Bollinger Bands: Utilizes standard deviation to measure market volatility and identify overbought/oversold conditions.
- Consecutive Candles: A method to detect momentum by counting consecutive bullish or bearish candles.
- QQE: Enhances the traditional RSI by smoothing it and using a dynamic threshold to generate signals.
- EMA: A widely used moving average that gives more weight to recent prices, making it responsive to market changes.
This indicator is a powerful tool for traders looking to combine multiple technical analysis methods into a single, easy-to-use script. By integrating these diverse techniques, it provides a comprehensive view of market conditions and potential trading opportunities.
Komut dosyalarını "accuracy" için ara

Standard Error Bands**Standard Error Bands Indicator: A Statistically Robust Tool for Trend Analysis**
The Standard Error Bands (SEB) indicator is a powerful technical analysis tool designed to help traders identify and assess trends with greater accuracy. Unlike traditional band indicators (e.g., Bollinger Bands) that rely on price averages, SEB leverages linear regression and statistical measures of volatility to offer deeper insights into market dynamics.
**How It Works**
1. **Linear Regression:** The indicator first calculates a linear regression line to model the underlying price trend. This line represents the "best fit" of price data over the specified lookback period.
2. **Standard Error:** Next, it calculates the standard error of the regression. This statistical measure quantifies the average distance between actual prices and the regression line, effectively acting as a volatility gauge.
3. **Smoothing:** Both the linear regression line and the standard error values are smoothed using a Simple Moving Average (SMA) to reduce noise and enhance the visual clarity of the bands.
4. **Band Construction:** The upper and lower bands are formed by adding/subtracting a multiple of the smoothed standard error from the smoothed linear regression line. The default multiplier is 2, representing approximately 95% of price action expected within the bands under normal market conditions.
**Key Insights**
* **Trend Strength:** Tight bands suggest a strong, well-defined trend with low volatility. Prices tend to adhere closely to the regression line, indicating a high probability of trend continuation.
* **Trend Weakness/Change:** Widening or expanding bands signal increased volatility and potential trend weakness. Prices deviating from the regression line may suggest an impending trend reversal or a shift into a sideways consolidation phase.
* **Entry/Exit Signals:**
* Consider entering a trade when prices break out of the bands in the direction of the trend, especially if the bands were previously tight.
* Conversely, consider exiting a trade when prices pierce the bands against the trend or when the bands start to widen significantly.
**Use Cases**
* **Trend Identification:** SEB can help traders identify trends earlier and more accurately than moving average-based indicators.
* **Trend Confirmation:** The bands can be used to confirm the validity and strength of an existing trend.
* **Volatility Assessment:** Changes in band width provide valuable insights into market volatility, aiding risk management decisions.
* **Entry/Exit Timing:** SEB can be incorporated into trading strategies to generate timely entry and exit signals.
**Important Considerations**
* **Parameter Optimization:** Experiment with different lookback periods, smoothing values, and standard error multipliers to find the optimal settings for your preferred trading style and market conditions.
* **Supplementary Indicators:** Combine SEB with other technical indicators (e.g., momentum oscillators, volume analysis) for a more comprehensive market assessment.
* **Backtesting:** Thoroughly backtest any SEB-based trading strategy to ensure its effectiveness before deploying it in live markets.
**Disclaimer:** Technical indicators like SEB are valuable tools but should not be used in isolation. Always consider price action or fundamental factors and risk management principles when making trading decisions.

[Pandora] Error Function Treasure Trove - ERF/ERFI/Sigmoids+PRAISE:
At this time, I have to graciously thank the wonderful minds behind the new "Pine Profiler Mode" (PPM). Directly prior to this release, it allowed me to ascertain script performance even more. While I usually write mostly in highly optimized Pine code, PPM visually identified a few bottlenecks that would otherwise be hard to identify. Anyone who contributed to PPMs creation and testing before release... BRAVO!!! I commend all of those who assisted in it's state-of-the-art engineering and inception, well done!
BACKSTORY:
This script is specifically being released in defense of another member, an exceptionally unique PhD. It was brought to my attention that a script-mod-event occurred, regarding the publishing of a measly antiquated error function (ERF) calculation within his script. This sadly resulted in the now former member jumping ship after receiving unmannerly responses amidst his curious inquiries as to why his erf() was modded. To forbid rusty and rudimentary formulations because a mod-on-duty is temporally offended by a non-nefarious release of code, is in MY opinion an injustice to principles of perpetuating open-source code intended to benefit thousands to millions of community members. While Pine is the heart and soul of TV, the mathematical concepts contributed from the minds of members is the inspirational fuel of curiosity that powers it's pertinent reason to exist and evolve.
It is an indisputable fact that most members are not greatly skilled Pine Poets. Many members may be incapable of innovating robust function code in Pine, even if they have one or more PhDs. We ALL come from various disciplines of mathematical comprehension and education. Some mathematicians are not greatly skilled at coding, while some coders are not exceptional at math. So... what am I to do to attempt to resolve this circumstantial challenge??? Those who know me best are aware that I will always side with "the right side of history" in order to accomplish my primary self-defined missions I choose to accept. Serving as an algorithmic advocate, I felt compelled to intercede by compiling numerous error functions into elegant code of very high caliber that any and every TV member may choose to employ, so this ERROR never happens again.
After weeks of contemplation into algorithms I knew little about, I prioritized myself to resolve an unanticipated matter by creating advanced formulas of exquisitely crafted error functions refined to the best of my current abilities. My aversion for unresolved problems motivated me to eviscerate error function insufficiencies with many more rigid formulations beyond what is thought to exist. ERF needed a proper algorithmic exorcism anyways. In my furiosity, I contemplated an array of madMAXimum diplomatic demolition methods, choosing the chain saw massacre technique to slaughter dysfunctionalities I encountered on a battered ERF roadway. This resulted in prolific solutions that should assuredly endure the test of time. Poetically, as you will come to see, I am ripping the lid off of Pandora's box of error functions in this case to correct wrongs into a splendid bundle of rights for members.
INTENTION:
Error function (ERF) enthusiasts... PREPARE FOR GLORY!! The specific purpose of this script is to deprecate classic error functions with the creation of a fierce and formidable army of superior formulations, each having varying attributes of computational complexity with differing absolute error ranges in their results for multiple compute scenarios. This is NOT an indicator... It is intended to allow members to embark on endeavors to advance the profound knowledge base of this growing worldwide community of 60+ million inquisitive minds. For those of you who believe computational mathematics and statistics is near completion at its finest; I am here to inform you, this is ridiculous to ponder. We are no where near statistical excellence that can and will exist eventually. At this time, metaphorically speaking, we are merely scratching microns off of the surface of the skin of a statistical apple Isaac Newton once pondered.
THIS RELEASE:
Following weeks of pondering methodical experiments beyond the ordinary, I am liberating these wild notions of my error function explorations to the entire globe as copyleft code, not just Pine. This Pandora's basket of ERFs is being openly disclosed for the sake of the sanctity of mathematics, empirical science (not the garbage we are told by CONTROLocrats to blindly trust), revolutionary cutting edge engineering, cosmology, physics, information technology, artificial intelligence, and EVERY other mathematical branch of human knowledge being discovered over centuries. I do believe James Glaisher would favor my aims concerning ERF aspirations embracing the "Power of Pine".
The included functions are intended for TV members to use in any way they see fit. This is a gift to ALL members to foster future innovative excellence on this platform. Any attempt to moderate this code without notification of "self-evident clear and just cause" will be considered an irrevocable egregious action. The original foundational PURPOSE of establishing script moderation (I clearly remember) was primarily to maintain active vigilance over a growing community against intentional nefarious actions and/or behaviors in blatant disrespect to other author's works AND also thwart rampant copypasting bandit operations, all while accommodating balanced principles of fairness for an educational community cause via open source publishing that should support future algorithmic inventions well beyond my lifespan.
APPLICATIONS:
The related error functions are used in probability theory, statistics, and numerous and engineering scientific disciplines. Its key characteristics and applications are innumerable in computational realms. Its versatility and significance make it a fundamental tool in arenas of quantitative analysis and scientific research...
Probability Theory - Is widely used in probability theory to calculate probabilities and quantiles of the normal distribution.
Statistics - It's related to the Gaussian integral and plays a crucial role in statistics, especially in hypothesis testing and confidence interval calculations.
Physics - In physics, it arises in the study of diffusion equations, quantum mechanics, and heat conduction problems.
Engineering - Applications exist in engineering disciplines such as signal processing, control theory, and telecommunications.
Error Analysis - It's employed in error analysis and uncertainty quantification.
Numeric Approximations - Due to its lack of a closed-form expression, numerical methods are often employed to approximate erf/erfi().
AI, LLMs, & MACHINE LEARNING:
The error function (ERF) is indispensable to various AI applications, particularly due to its relation to Gaussian distributions and error analysis. It is used in Gaussian processes for regression and classification, probabilistic inference for Bayesian networks, soft margin computation in SVMs, neural networks involving Gaussian activation functions or noise, and clustering algorithms like Gaussian Mixture Models. Improved ERF approximations can enhance precision in these applications, reduce computational complexity, handle outliers and noise better, and improve optimization and convergence, possibly leading to more accurate, efficient, and robust AI systems.
BONUS ALGORITHMS:
While ERFs are versatile, its opposite also exists in the form of inverse error functions (ERFIs). I have also included a modified form of the inverse fisher transform along side MY sigmoid (sigmyod). I am uncertain what sigmyod() may be used for, but it's a culmination of my examinations deep into "sigmoid domains", something I am fascinated by. Whatever implications it may possess, I am unveiling it along with it's cousin functions. For curious minds, this quality of composition seen here is ideally what underlies what I would term "Pandora functionality" that empowers my Pandora indication. I go through hordes of formulations, testing, and inspection to find what appears to be the most beneficial logical/mathematical equation to apply...
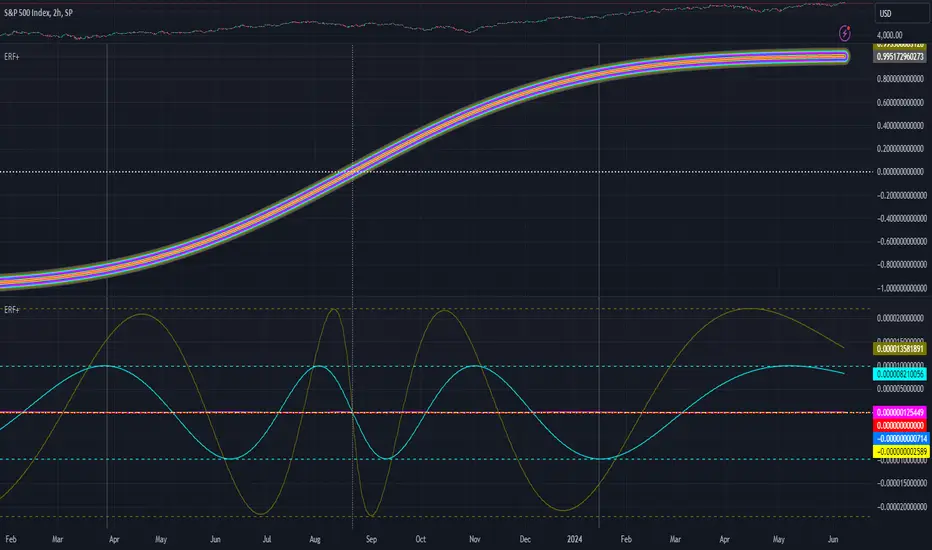
SCRIPT OPERATION:
To showcase the characteristics and performance of my ERF/ERFI formulations, I devised a multi-modal script. By using bar_index , I generated a broad sequence of numeric values to input into the first ERF/ERFI parameter. These sequences allow you to inspect the contours of the error function's outputs for both ERF and ERFI. When combined with compute-intensive precision functions (CIPFs), the polynomial function output values can be subtracted from my CIPFs to obtain results of absolute error, displaying the accuracy of the many polynomial estimation functions I tuned in testing for Pine's float environment.
A host of numeric input settings are wildly adjustable to inspect values/curvatures across the range of numeric input sequences. Very large numbers, such as Divisor:100,000,100/Offset:200,000,000 for ERF modes or... Divisor:100,000,100/Offset:100,000,000 for ERFI modes, will display miniscule output values calculated from input values in close proximity to 0.0 for the various estimates, similar to a microscope. ERFI approximations very near in proximity to +/-1.0 will always yield large deviations of absolute error. Dragging/zooming your chart or using the Offset input will aid with visually clipping off those ERFI extremes where float precision functions cannot suffice.
NOTICE:
perf() and perfi() are intended for precision computation (as good as it basically gets) in a float environment. However, they are CPU intensive (especially perfi). I wouldn't recommend these being used in ANY Pine script unless it's an "absolute necessity" to do so to accomplish your goal. I only built them to obtain "absolute error curvatures" of the error functions for the polynomial approximations. These are visible in the accuracy modes in the indicator Settings.
Advanced Fractal and Hurst IndicatorAdvanced Fractal and Hurst Indicator (AFHI)
Description:
The Advanced Fractal and Hurst Indicator (AFHI) is a custom technical analysis tool designed to identify market trends and potential reversals by leveraging the concepts of Fractal Dimension and the Hurst Exponent . These advanced mathematical concepts provide insights into the complexity and persistence of price movements, making this indicator a powerful addition to any trader's toolkit.
How It Works:
Fractal Dimension (FD) :
The Fractal Dimension measures the complexity of price movements. A higher Fractal Dimension indicates a more complex, choppy market, while a lower value suggests smoother trends.
The FD is calculated using the log difference of price movements over a specified length.
Hurst Exponent (HE) :
The Hurst Exponent indicates the tendency of a time series to either regress to the mean or cluster in a direction. Values below 0.5 indicate a tendency to revert to the mean (mean-reverting), while values above 0.5 suggest a trending market.
The HE is calculated using the rescaled range method, comparing the range of price movements to the standard deviation.
Composite Indicator :
The Composite Indicator combines the smoothed Fractal Dimension and Hurst Exponent to provide a single value indicating market conditions. This is done by normalizing the FD and HE values and combining them into one metric.
A positive Composite Indicator suggests an uptrend, while a negative value indicates a downtrend.
Smoothing :
Both FD and HE values are smoothed using a simple moving average to reduce noise and provide clearer signals.
Trend Confirmation :
A 50-period moving average (MA) is used to confirm the trend direction. The price being above the MA indicates an uptrend, while below the MA indicates a downtrend.
Background Shading :
The indicator pane is shaded green during uptrend conditions (positive Composite Indicator and price above MA) and red during downtrend conditions (negative Composite Indicator and price below MA).
How Traders Can Use It:
Identifying Trends :
Traders can use the AFHI to identify current market trends. The background shading in the indicator pane provides a visual cue for trend direction, with green indicating an uptrend and red indicating a downtrend.
Trend Confirmation :
The Composite Indicator line, plotted in purple, helps confirm the trend. Positive values suggest a strong uptrend, while negative values indicate a strong downtrend.
Entry and Exit Signals :
Traders can use the transitions of the Composite Indicator and the background shading to time their entry and exit points. For instance, a shift from red to green shading suggests a potential buy opportunity, while a shift from green to red suggests a potential sell opportunity.
Alerts :
The script includes alert conditions that can notify traders when the Composite Indicator signals a new trend direction. Alerts can be set up for both uptrends and downtrends, helping traders stay informed of key market changes.
Strategy Development :
By integrating AFHI into their trading strategies, traders can develop more robust systems that account for market complexity and persistence. The indicator can be used alongside other technical tools to enhance decision-making and improve trade accuracy.

Leading MACDThe Moving Average Convergence Divergence (MACD) indicator is one of the most popular and versatile tools used by traders to identify potential buy and sell signals. It helps traders determine the strength and direction of a trend by comparing different moving averages of a security's price. The traditional MACD uses two exponential moving averages (EMAs), a fast EMA (typically 12 periods) and a slow EMA (typically 26 periods), along with a signal line (typically a 9-period EMA of the MACD line) to generate trading signals.
Our "Custom MACD with Leading Length" script for TradingView enhances the traditional MACD by introducing an additional smoothing factor called the "leading length." This customization aims to reduce noise and provide a potentially earlier indication of trend changes, making it a valuable tool for traders seeking to optimize their trading strategies.
- **Purpose:** This additional smoothing factor is designed to reduce noise and provide a potentially leading signal, enhancing the accuracy of trend identification.
## How It Works
1. **Calculate the MACD Line:**
The MACD line is calculated by subtracting the slow EMA from the fast EMA. This difference represents the convergence or divergence between the two EMAs.
2. **Calculate the Signal Line:**
The signal line is an EMA of the MACD line. This additional smoothing helps to generate clearer buy and sell signals based on crossovers with the MACD line.
3. **Calculate the Histogram:**
The histogram represents the difference between the MACD line and the signal line. It visually indicates the strength and direction of the trend. A positive histogram suggests a bullish trend, while a negative histogram indicates a bearish trend.
4. **Apply Leading Length Smoothing:**
To incorporate the leading length, the script applies a simple moving average (SMA) to both the MACD and signal lines using the leading length parameter. This additional smoothing helps to further reduce noise and potentially provides earlier signals of trend changes.
## Benefits of the Leading MACD
### Reduced Noise
The leading length parameter adds an extra layer of smoothing to the MACD and signal lines, helping to filter out market noise. This can be particularly beneficial in volatile markets, where frequent price fluctuations can generate false signals.
### Potential Early Signals
By smoothing the MACD and signal lines, the leading length can help to provide earlier indications of trend changes. This can give traders a potential edge in entering or exiting trades before the broader market reacts.
### Enhanced Trend Identification
The combination of the traditional MACD with the leading length smoothing can enhance the accuracy of trend identification. Traders can use this tool to confirm the strength and direction of trends, making it easier to make informed trading decisions.
### Versatility
The Custom MACD with Leading Length can be applied to various timeframes and asset classes, including stocks, forex, commodities, and cryptocurrencies. Its adaptability makes it a valuable tool for traders with different strategies and preferences.
## Practical Applications
### Buy Signal
A typical buy signal occurs when the MACD line crosses above the signal line. With the additional smoothing provided by the leading length, traders might receive this signal slightly earlier, allowing them to enter a long position sooner. This can be particularly advantageous in capturing the beginning of a bullish trend.
### Sell Signal
Conversely, a sell signal is generated when the MACD line crosses below the signal line. The leading length smoothing can help to provide this signal earlier, enabling traders to exit a long position or enter a short position before the trend reversal is fully recognized by the market.
### Divergence Analysis
Traders can also use the Custom MACD with Leading Length for divergence analysis. Bullish divergence occurs when the price makes a new low, but the MACD line forms a higher low. This suggests that the downward momentum is weakening, potentially leading to a bullish reversal. Bearish divergence is the opposite, where the price makes a new high, but the MACD line forms a lower high, indicating a potential bearish reversal.
### Confirmation Tool
The Custom MACD with Leading Length can be used in conjunction with other technical indicators to confirm trading signals. For example, traders might use it alongside support and resistance levels, trendlines, or other momentum indicators to validate their trade entries and exits.
## Conclusion
The Custom MACD with Leading Length is a powerful enhancement of the traditional MACD indicator. By introducing an additional smoothing factor, it aims to reduce noise and provide earlier signals of trend changes. This makes it a valuable tool for traders seeking to improve their market analysis and trading strategies.
Whether you are a day trader, swing trader, or long-term investor, the Custom MACD with Leading Length can help you make more informed decisions by offering clearer insights into market trends. Its adaptability to different timeframes and asset classes further enhances its utility, making it a versatile addition to any trader's toolkit.
Experiment with the parameters to find the optimal settings that suit your trading style and preferences. Use the Custom MACD with Leading Length to gain a deeper understanding of market dynamics and enhance your trading performance.
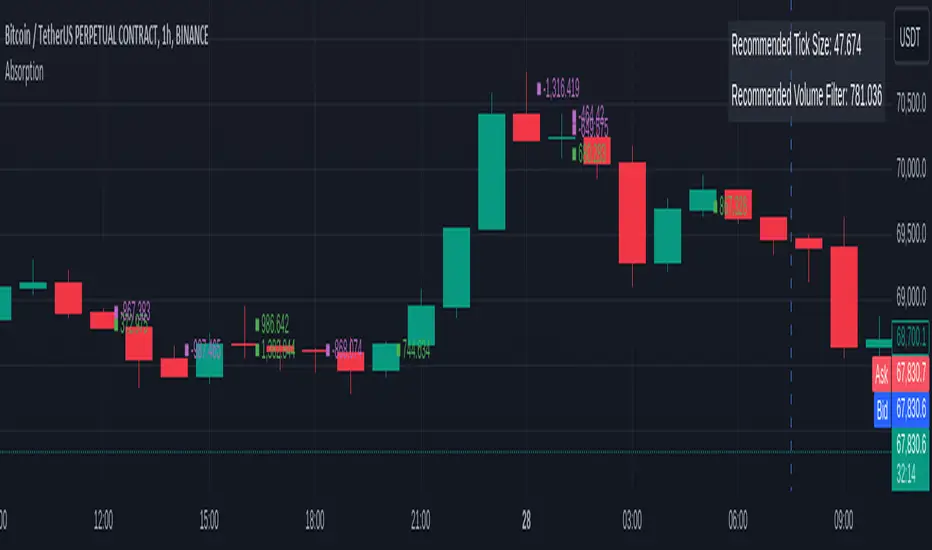
OrderFlow Absorption IndicatorWhat it Does
The OrderFlow Absorption Indicator marks areas where the price absorbs a large volume of aggressive market trades. This indicates areas where price may bounce back due to large limit (resting) orders absorbing significant aggressor volume (market orders). Absorption can also be seen as "preventing" or "stopping" the other side from breaking through a price level (e.g. bids stopping an influx of sell market orders). Absorption may signal a change in sentiment, potentially leading to a pullback or reversal.
An Example of Absorption
Of course, it is not always the case that such bullish absorption will initiate a trend as the example above. The OrderFlow Absorption Indicator merely serves as a tool for spotting possible absorption points in the market which you can incorporate into your trading arsenal.
How it Works
The indicator actively monitors price changes and records volume accumulated at a price level. If the price bounces back to at least where it was before the current price move, the indicator records this as absorption, provided it meets the Volume Requirement and optional Time Requirement.
How to Use it
1. Set Parameters
Choose your desired tick size and volume filter value. If unsure, refer to the table on the top right of the chart for recommended values. An automatic volume limit filter mode is also available.
Automatic Limit Mode : Enable this mode to have the indicator automatically select a volume filter value. It calculates the standard deviation of the last n minutes of volume and multiplies it by a volume multiplier. You can adjust these parameters.
Higher Volume Filter : Setting a higher volume filter value results in fewer, but higher quality detections, reducing noise.
2. Enabling the Time Limit
Enabling the time limit further improves detection quality by filtering out price levels that can defend against quick, sudden aggressive orders, acting as confirmation and indicating strong sentiment and resilient liquidity.
3. Enabling Historical Data Absorption
The indicator can also detect absorption in historical data, though less accurately than in real-time due to OHLCV aggregation.
You can select the granularity of historical data.
Lower granularity (e.g., 1 second) : Provides more accurate detections but may slow down the indicator.
Higher granularity : Improves speed but reduces detection accuracy.
Other Features
Hovering : When hovering over an absorption point, the interface reveals the price where the absorption occurred, along with the volume absorbed by the bids and asks, as well as the volume filter value used.
Delta Mode : In Delta mode, the system calculates the difference between the volume absorbed by bids and asks, revealing points only when the absolute value of this difference exceeds the volume filter value. Especially useful for larger tick sizes.
Troubleshooting
If the indicator doesn't mark anything, it means the traded volume hasn't exceeded the set volume filter value within the specified price intervals(tick size) and time limit. Adjust these settings as necessary.
Volume Breaker Blocks [UAlgo]The "Volume Breaker Blocks " indicator is designed to identify breaker blocks in the market based on volume and price action. It is a concept that emerges when an order block fails, leading to a change in market structure. It signifies a pivotal point where the market shifts direction, offering traders opportunities to enter trades based on anticipated trend continuation.
🔶 Key Features
Identifying Breaker Blocks: The indicator identifies breaker blocks by detecting pivot points in price action and corresponding volume spikes.
Breaker Block Sensitivity: Traders can adjust breaker block detection sensitivity, length to be used to find pivot points.
Mitigation Method (Close or Wick): Traders can choose between "Close" and "Wick" as the mitigation method. This choice determines whether the indicator considers closing prices or wicks in identifying breaker blocks. Selecting "Close" implies that breaker blocks will be considered broken when the closing price violates the block, while selecting "Wick" implies that the wick of the candle must violate the block for it to be considered broken.
Show Last X Breaker Blocks: Users can specify how many of the most recent breaker blocks to display on the chart.
Visualization: Volume breaker blocks are visually represented on the chart with customizable colors and text labels, allowing for easy interpretation of market conditions. Each breaker block is accompanied by informational text, including whether it's bullish or bearish and the corresponding volume, aiding traders in understanding the significance of each block.
🔶 Disclaimer
Educational Purpose: The "Volume Breaker Blocks " indicator is provided for educational and informational purposes only. It does not constitute financial advice or a recommendation to engage in trading activities.
Risk of Loss: Trading in financial markets involves inherent risks, including the risk of loss of capital. Users should carefully consider their financial situation, risk tolerance, and investment objectives before engaging in trading activities.
Accuracy Not Guaranteed: While the indicator aims to identify potential reversal points in the market, its accuracy and effectiveness may vary. Users should conduct thorough testing and analysis before relying solely on the indicator for trading decisions.
Past Performance: Past performance is not indicative of future results. Historical data and backtesting results may not accurately reflect actual market conditions or future performance.

Advanced Stochastic [CryptoSea]The Advanced Stochastic Indicator is a sophisticated tool designed to enhance market analysis through detailed stochastic calculations. This tool is built for traders who seek to identify market divergences and pivot points with higher accuracy.
Key Features
Multi-Layer Stochastic Analysis: Tracks both standard and smoothed stochastic values to provide a granular view of market momentum.
Divergence Detection: Automatically detects both regular and hidden bullish and bearish divergences, offering critical insights into potential market reversals.
Adaptive Oscillator Display: Features customizable display options for the stochastic oscillator, allowing traders to view data in Default, Histogram, or Both modes.
Customizable Lookback Periods: Users can set specific lookback periods for divergence analysis and stochastic calculations, tailoring the tool to fit various trading strategies.
In the example below, there is a bearish divergence above 0. You would first want the stoch to break below the 0 level as a show of strength, this would be an aggressive entry, a higher probability option would be to wait for the stoch to retest and reject from 0 which is what we have a few candles later.
How it Works
Stochastic Calculation: Computes the stochastic oscillator by smoothing the %K line over a user-defined period, then applying a second smoothing for the %D line.
Pivot Point Analysis: Utilizes advanced algorithms to find low and high pivot points based on the oscillator values, crucial for spotting trend reversals.
Colour-Coded Divergence Alerts: Utilizes color codes to highlight divergence signals directly on the chart, aiding in quick visual analysis.
Responsive Threshold Settings: Includes options to adjust the sensitivity of divergence detection, ensuring that only significant divergences are highlighted.
In the example below, we have 2 divergence signals. The first a bullish one which fails to break above 0. The second signal is given above 0 so you would want a retest and a show of strength when the stoch returns to 0 but it fails to hold. Both of these divergence signals are invalidated.
Application
Strategic Decision-Making: Assists traders in making informed decisions by providing detailed analysis of stochastic movements and divergence.
Trend Confirmation: Reinforces trading strategies by confirming potential reversals with pivot point detection and divergence analysis.
Customized Analysis: Adapts to various trading styles with extensive input settings that control the display and sensitivity of oscillator data.
The Advanced Stochastic Indicator by is an invaluable addition to a trader's toolkit, offering depth and precision in market trend analysis to navigate complex market conditions effectively.

Multiple MAs Signals with RSI MA Filter & Signal About the Script
The "Multiple Moving Averages Signals with RSI MA Filter and Golden Signals" script is a comprehensive trading tool designed to provide traders with detailed insights and actionable signals based on multiple moving averages and RSI (Relative Strength Index). This script combines traditional moving average crossovers with RSI filtering to enhance the accuracy of trading signals and includes "golden" signals to highlight significant long-term trend changes.
This script integrates several technical indicators and concepts to create a robust and versatile trading tool. Here's why this combination is both original and useful:
1. Multiple Moving Averages:
- Why Use Multiple MAs: Different types of moving averages (SMA, EMA, SMMA, WMA, VWMA, Hull) offer unique perspectives on price trends and volatility. Combining them allows traders to capture a more comprehensive view of the market.
- Purpose: Using multiple moving averages helps identify trend direction, support/resistance levels, and potential reversal points.
2. RSI MA Filter:
- Why Use RSI: RSI is a momentum oscillator that measures the speed and change of price movements. It is used to identify overbought or oversold conditions in a market.
- Purpose: Filtering signals with RSI moving averages ensures that trades are taken in line with the prevailing momentum, reducing the likelihood of false signals.
3. Golden Signals:
- Why Use Golden Crosses: A golden cross (50-period MA crossing above the 200-period MA) is a well-known bullish signal, while a death cross (50-period MA crossing below the 200-period MA) is bearish. These signals are widely followed by traders and institutions.
- Purpose: Highlighting these significant long-term signals helps traders identify major buy or sell opportunities and align with broader market trends.
How the Script Works
1. Moving Average Calculations:
- The script calculates multiple moving averages (MA1 to MA5) based on user-selected types (SMA, EMA, SMMA, WMA, VWMA, Hull) and periods (9, 21, 50, 100, 200).
- Golden Moving Averages: Separately calculates 50-period and 200-period moving averages for generating golden signals.
2. RSI and RSI MA Filter:
- RSI Calculation: Computes the RSI for the given period.
- RSI MA: Calculates a moving average of the RSI to smooth out the RSI values and reduce noise.
- RSI MA Filter: Traders can enable/disable RSI filtering and set custom thresholds to refine long and short signals based on RSI momentum.
3. Long & Short Signal Generation:
- Long Signal: Generated when the short-term moving average crosses above both the mid-term and long-term moving averages, and the RSI MA is below the specified threshold (if enabled).
- Short Signal: Generated when the short-term moving average crosses below both the mid-term and long-term moving averages, and the RSI MA is above the specified threshold (if enabled).
4. Golden Signals:
- Golden Long Signal: Triggered when the 50-period golden moving average crosses above the 200-period golden moving average.
- Golden Short Signal: Triggered when the 50-period golden moving average crosses below the 200-period golden moving average.
How to Use the Script
1. Customize Inputs:
- Moving Averages: Choose the type of moving averages and set the periods for up to five different moving averages.
- RSI Settings: Adjust the RSI period and its moving average period. Enable or disable RSI filtering and set custom thresholds for long and short signals.
- Signal Colors: Customize the colors for long, short, and golden signals.
- Enable/Disable Signals: Toggle the visibility of long, short, and golden signals.
2. Observe Plots and Signals:
- The script plots the selected moving averages on the chart.
- Long and short signals are marked with labels on the chart, with customizable colors for easy identification.
- Golden signals are highlighted with specific labels to indicate significant long-term trend changes.
3. Analyze and Trade:
- Use the generated signals as part of your trading strategy. The script provides visual cues to help you make informed decisions about entering or exiting trades based on multiple technical indicators.
Unique Features
1. Integration of Multiple Moving Averages: Combines various moving average types to provide a holistic view of market trends.
2. RSI MA Filtering: Enhances signal accuracy by incorporating RSI momentum, reducing the likelihood of false signals.
3. Golden Signals: Highlights significant long-term trend changes, aligning with broader market movements.
4. Customizability: Offers extensive customization options, allowing traders to tailor the script to their specific trading strategies and preferences.
feel free to comments.

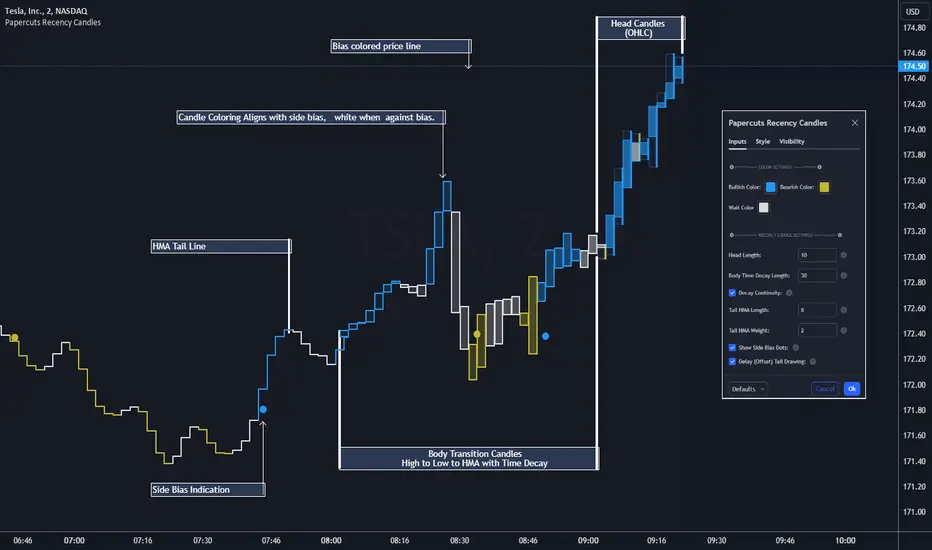
Papercuts Recency CandlesPapercuts Recency Candles
V0.8 by Joel Eckert @PapercutsTrading
***This is currently an experimental visual exploratory concept.***
*** Experimental tools should only be explored by fellow coders and experienced traders.***
DESCRIPTION:
As coders, how can we seamlessly transition between actual and smoothed price data sets as data ages?
This is a visual experiment to see if and how data can be smoothly transitioned from one value to another over a set number of candles. If we visualize a chart in 3 zones, a head, a body, and a tail we can start to understand how this could work. The head zone would represent the first data set of actual asset prices. The body zone would represent the transition period from the first to the to the second data set. Last, the tail zone would represent the second data set made of a Hull Moving Average of the asset.
CONCEPT:
It is conceived that data and position precision constantly shift as they decay or age, therefore making older price levels act more like price regions or zones vs exact price points. This is what I am calling Recency.
This indicator utilizes the concept of "Recency" to explore the possibility of a new style of candle. It aims to maintain accurately on recent prices action but loosen up accuracy on older price action. The very nature of this requires ALTERING HISTORICAL DATA within the body zone or transition candles to achieve the effect. It is similar to trying to merge a line chart type with a candle chart type.
This experiment of using recency for candles was to create candles that stay more accurate near current price but fade away into a simple line as they age out, resulting in a simplified view of the big picture which consists of older price action.
This experimental design theoretically will help you stay focused only on what is currently unfolding and to minimize distractions from older price nuances.
USAGE:
WHO:
This is not recommended for new traders or novices that are unfamiliar with standard tools. Standardized tools should always be used to get grounded and build a foundation.
Active traders who are familiar with trading comfortably should experiment with this to see if they find it interesting or usable.
Pine coders may find this concept interesting enough, and may adapt the idea to other elements of their own scripts if they find it interesting… I just ask they give credit where credit is due.
HOW:
The best way to visualize how this works is to do the following:
Load it on a chart.
Turn off Standard candles in Chart Setting of the current window. I actually just turn off the bodies and borders, and dim the old wicks as I like the way the old wicks look when left alone with these new candles.
Enable chart replay at a faster speed, like 3x, and play back the chart to watch the behavior of the candles.
You’ll be able to see how the head of the candle type preserves OHLC, and indicates direction but as the candle starts to age it progressively flowers into the HMA
While it plays back try adjusting settings to see how they affect behavior.
You can see the data average in real-time which often reveals how unstable actual price noise really is.
The head candle diagonals indicate the candle body direction.
SETTINGS:
Coloring: You can choose your own bullish or bearish colors to match your scheme.
Price Line: The price line is colored according to the trend and
Head Length: These candles are true to the source high and low. They remain slightly brighter than transition candles. We have a max of 50 to keep things responsive.
Time Decay Length: This is the amount of candles it takes to transition to the tail. Max is 300 to keep things responsive.
Decay Continuity: This forces transition candles to complete the HMA curve instead of creating gaps when conforming to it. The best way to visualize this feature is to run a 3x replay of an asset, and toggle the result on and off. On is preferred.
Tail HMA Length: This is the smoothing amount for the resulting HMA stepline that calculates every close, but has a delayed draw until after the transition candles. You can optionally turn off the delayed visibility to help with comprehension.
Tail HMA Weight: This is simply an option to make the tail thicker or thinner. This also adjusts the border on the head candles to help them stand out.
Show Side Bias Dots: Default true: Draws a dot when bias to one side changes to help keep you on the right side of trade. Side bias is simply the alignment of 3 moving averages in one direction.
IMPORTANT NOTES:
You'll have to turn off or dim the standard candles in your view "Chart Settings" to see this properly.
Be aware that since the candles are based on boxes and utilize the “recency concept”, which means their data decays and changes as it ages. This results in a cleaner chart overall, but exact highs and lows will be averaged out as the data decays, forming a Hull Moving Average stepline of your defined length once decay has finished.
SUMMARY OF HOW IT WORKS:
First it takes candle information and creates unique boxes that represent each candle based on the high and low. It utilizes boxes because standard candles once written, cannot be later altered or removed… which is a key element for this effect to work.
Next it creates a second box and line from open to close for the body of the Head candles. This indicates direction at a glance.
As candles age beyond the defined distance of the “Head” they enter the "Body" aka "Time Decay" zone. Here the accuracy of the high and low will be averaged down using an incremental factor of the HMA, defined by "Time Decay Length" amount of candles.
The resulting tail is an HMA of Tail HMA Length. This tail is always calculate at close, but is not drawn instantly. The draw is delayed so that there is not overlapping data, and this makes the effect look more elegant.
There are also two EMAs within the script that do nothing but help candle coloring and help provide a trade side bias. When both EMA's and the HMA align, a side bias is defined. Only when the side bias changes will a new dot is formed.
Head candles have been simplified from previous versions to be easier to read at a a glance.
Fourier Adjusted Average True Range [BackQuant]Fourier Adjusted Average True Range
1. Conceptual Foundation and Innovation
The FA-ATR leverages the principles of Fourier analysis to dissect market prices into their constituent cyclical components. By applying Fourier Transform to the price data, the FA-ATR captures the dominant cycles and trends which are often obscured in noisy market data. This integration allows the FA-ATR to adapt its readings based on underlying market dynamics, offering a refined view of volatility that is sensitive to both market direction and momentum.
2. Technical Composition and Calculation
The core of the FA-ATR involves calculating the traditional ATR, which measures market volatility by decomposing the entire range of price movements. The FA-ATR extends this by incorporating a Fourier Transform of price data to assess cyclical patterns over a user-defined period 'N'. This process synthesizes both the magnitude of price changes and their rhythmic occurrences, resulting in a more comprehensive volatility indicator.
Fourier Transform Application: The Fourier series is calculated using price data to identify the fundamental frequency of market movements. This frequency helps in adjusting the ATR to reflect more accurately the current market conditions.
Dynamic Adjustment: The ATR is then adjusted by the magnitude of the dominant cycle from the Fourier analysis, enhancing or reducing the ATR value based on the intensity and phase of market cycles.
3. Features and User Inputs
Customizability: Traders can modify the Fourier period, ATR period, and the multiplication factor to suit different trading styles and market environments.
Visualization : The FA-ATR can be plotted directly on the chart, providing a visual representation of volatility. Additionally, the option to paint candles according to the trend direction enhances the usability and interpretative ease of the indicator.
Confluence with Moving Averages: Optionally, a moving average of the FA-ATR can be displayed, serving as a confluence factor for confirming trends or potential reversals.
4. Practical Applications
The FA-ATR is particularly useful in markets characterized by periodic fluctuations or those that exhibit strong cyclical trends. Traders can utilize this indicator to:
Adjust Stop-Loss Orders: More accurately set stop-loss orders based on a volatility measure that accounts for cyclical market changes.
Trend Confirmation: Use the FA-ATR to confirm trend strength and sustainability, helping to avoid false signals often encountered in volatile markets.
Strategic Entry and Exit: The indicator's responsiveness to changing market dynamics makes it an excellent tool for planning entries and exits in a trend-following or a breakout trading strategy.
5. Advantages and Strategic Value
By integrating Fourier analysis, the FA-ATR provides a volatility measure that is both adaptive and anticipatory, giving traders a forward-looking tool that adjusts to changes before they become apparent through traditional indicators. This anticipatory feature makes it an invaluable asset for traders looking to gain an edge in fast-paced and rapidly changing market conditions.
6. Summary and Usage Tips
The Fourier Adjusted Average True Range is a cutting-edge development in technical analysis, offering traders an enhanced tool for assessing market volatility with increased accuracy and responsiveness. Its ability to adapt to the market's cyclical nature makes it particularly useful for those trading in highly volatile or cyclically influenced markets.
Traders are encouraged to integrate the FA-ATR into their trading systems as a supplementary tool to improve risk management and decision-making accuracy, thereby potentially increasing the effectiveness of their trading strategies.
INDEX:BTCUSD
INDEX:ETHUSD
BINANCE:SOLUSD

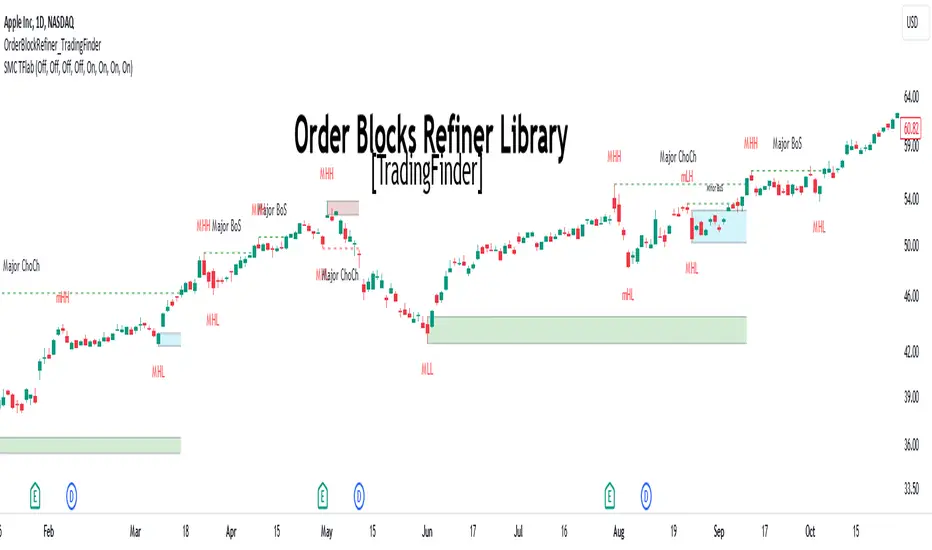
Order Block Refiner [TradingFinder]🔵 Introduction
The "Refinement" feature allows you to adjust the width of the order block according to your strategy. There are two modes, "Aggressive" and "Defensive," in the "Order Block Refine". The difference between "Aggressive" and "Defensive" lies in the width of the order block.
For risk-averse traders, the "Defensive" mode is suitable as it provides a lower loss limit and a greater reward-to-risk ratio. For risk-taking traders, the "Aggressive" mode is more appropriate. These traders prefer to enter trades at higher prices, and this mode, which has a wider order block width, is more suitable for this group of individuals.
Important :
One of the advantages of using this library is increased code accuracy. Not only does it have the capability to create order blocks, but you can also simply define the condition for order block creation (true/false) and "bar_index," and you'll find the primary range without applying any filters.
🟣 Order Block Refinement Algorithm
The order block ranges are filtered in two stages. In the first stage, the "Open," "High," "Low," and "Close" of the current order block candle, its two or three previous candles, and one subsequent candle (if available) are examined. In this stage, minimum and maximum distances are calculated, and logical range filters are applied.
In the second stage, two modes, "Aggressive" and "Defensive," are calculated.
For the "Defensive" mode, the width of these ranges is compared with the "ATR" (Average True Range) of period 55, and if they are smaller than "ATR" or 1 to more than 4 times "ATR," the width of the range is reduced from 0 to 80 percent.
For the "Aggressive" mode, you get the same output as the first filter, which usually has a wider width than the "Defensive" mode.
• Order Block Refiner : Off
• Order Block Refiner : On / "Aggressive Mode"
• Order Block Refiner : On / "Defensive Mode"
🔵 How to Use
OBRefiner(string OBType, string OBRefine, string RefineMethod, bool TriggerCondition, int Index) =>
Parameters:
• OBType (string)
• OBRefine (string)
• RefineMethod (string)
• TriggerCondition (bool)
• Index (int)
To add "Order Block Refiner Library", you must first add the following code to your script.
import TFlab/OrderBlockRefiner_TradingFinder/1
OBType : This parameter receives 2 inputs. If the order block you want to "Refine" is of type demand, you should enter "Demand," and if it's of type supply, you should enter "Supply."
OBRefine : Set to "On" if you want the "Refine" operation to be performed. Otherwise, set to "Off."
RefineMethod : This input receives 2 modes, "Aggressive" and "Defensive." You can switch between these modes according to your needs.
TriggerCondition : Enter the condition with which the order block is formed in this parameter.
Index : Enter the "bar_index" of the candle where the order block is formed in this parameter.
🟣 Function Outputs
This function has 6 outputs: "bar_index" at the beginning of the "Distal" line, "bar_index+1" at the end of the "Distal" line, "Price" at the "Distal" line, "bar_index" at the beginning of the "Proximal" line, "bar_index+1" at the end of the "Proximal" line, and "Price" at the "Proximal" line, which can be used to draw order blocks.
Sample :
= Refiner.OBRefiner('Demand', 'Off', 'Aggressive',BuMChMain_Trigger, BuMChMain_Index)
if BuMChMain_Trigger
BuMChHlineMain := line.new(BuMChMain_Xp1 , BuMChMain_Yp12 , bar_index , BuMChMain_Yp12, color = color.black , style = line.style_dotted)
BuMChLlineMain := line.new(BuMChMain_Xd1 , BuMChMain_Yd12 , bar_index , BuMChMain_Yd12, color = color.black , style = line.style_dotted)
BuMChFilineMain := linefill.new(BuMChHlineMain ,BuMChLlineMain , color = color.rgb(76, 175, 80 , 75 ) )
Unmitigated Liquidity Imbalances [AlgoAlpha]🎉 Introducing the Unmitigated Liquidity Imbalance Indicator by AlgoAlpha! 🎉
Dive into the depths of market analytics with our "Unmitigated Liquidity Imbalance" indicator. This tool harnesses unique algorithms to detect liquidity imbalances between bulls and bears, helping traders spot trends and potential entry and exit points with greater accuracy. 📈🚀
🔍 Key Features:
🌟 Advanced Analysis : Analyses candle direction and length to forecast market peaks and valleys.
🎨 Customizable Visuals : Tailor the chart with your choice of bullish green or bearish red to reflect different market conditions.
🔄 Real-Time Updates : Continuously updates to reflect live market changes.
🔔 Configurable Alerts : Set up alerts for key trading signals such as bullish and bearish reversals, as well as trend shifts.
📐 How to Use:
🛠 Add the Indicator : Add the indicator to your favourites and customize the settings to suite your needs.
📊 Market Analysis : Monitor the oscillator threshold; readings above 0.5 suggest bullish sentiment, while below 0.5 indicate bearish conditions. And reversal signals are displayed to show potential entry points.
🔔 Set Alerts : Enable notifications for reversal conditions or trend changes to seize trading opportunities without constant chart watching.
🧠 How It Works:
The core mechanism of the indicator is based on detecting changes in candlestick size and direction to identify bullish and bearish liquidity levels from the peak & valley indicator's logic. By comparing the length of a current candle to the previous one and checking the change in direction, it pinpoints moments where market sentiment could be shifting, indicating if the liquidity at that point is bullish or bearish. The script then looks at what percentage of the past few unmitigated levels are bullish or bearish based on a customizable lookback and determines the liquidity imbalance which can then be interpreted as trend.
Empower your trading with the Unmitigated Liquidity Imbalance indicator and navigate the markets with confidence and precision. 🌟💹
Happy trading, and may your charts be ever in your favour! 🥳✨
💎 Related Indicator

Bullish Candlestick Patterns With Filters [TradeDots]The "Bullish Candlestick Patterns With Filters" is a trading indicator that identifies 6 core bullish candlestick patterns. This is further enhanced by applying channel indicator as filters, designed to further increase the accuracy of the recognized patterns.
6 CANDLESTICK PATTERNS
Hammer
Inverted Hammer
Bullish Engulfing
The Piercing Line
The Morning Star
The 3 White Soldiers
SIGNAL FILTERING
The indicator incorporates with 2 primary methodologies aimed at filtering out lower accuracy signals.
Firstly, it comes with a "Lowest period" parameter that examines whether the trough of the bullish candlestick configuration signifies the lowest point within a specified retrospective bar length. The longer the period, the higher the probability that the price will rebound.
Secondly, the channel indicators, the Keltner Channels or Bollinger Bands. This indicator examines whether the lowest point of the bullish candlestick pattern breaches the lower band, indicating an oversold signal. Users have the flexibility to modify the length and band multiplier, enabling them to custom-tune signal sensitivity.
Without Filtering:
With Filtering
RISK DISCLAIMER
Trading entails substantial risk, and most day traders incur losses. All content, tools, scripts, articles, and education provided by TradeDots serve purely informational and educational purposes. Past performances are not definitive predictors of future results.

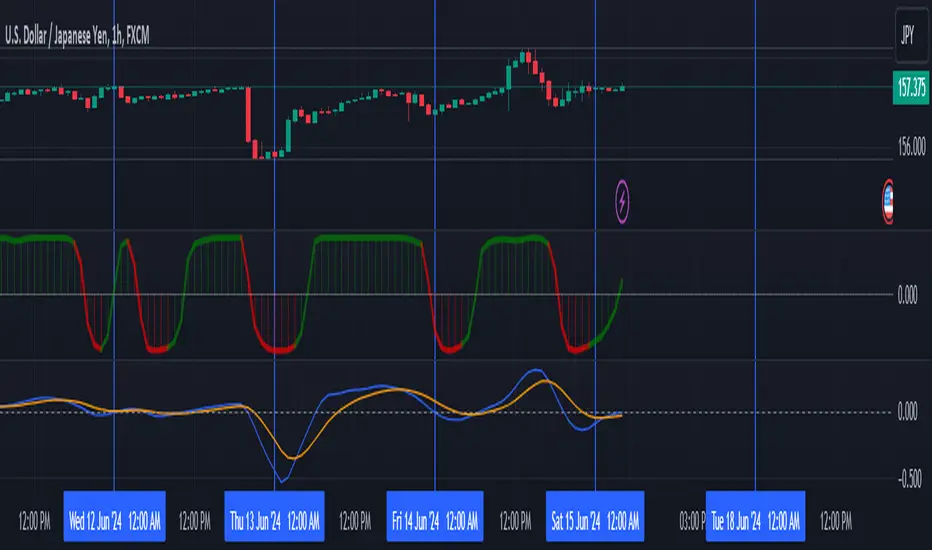
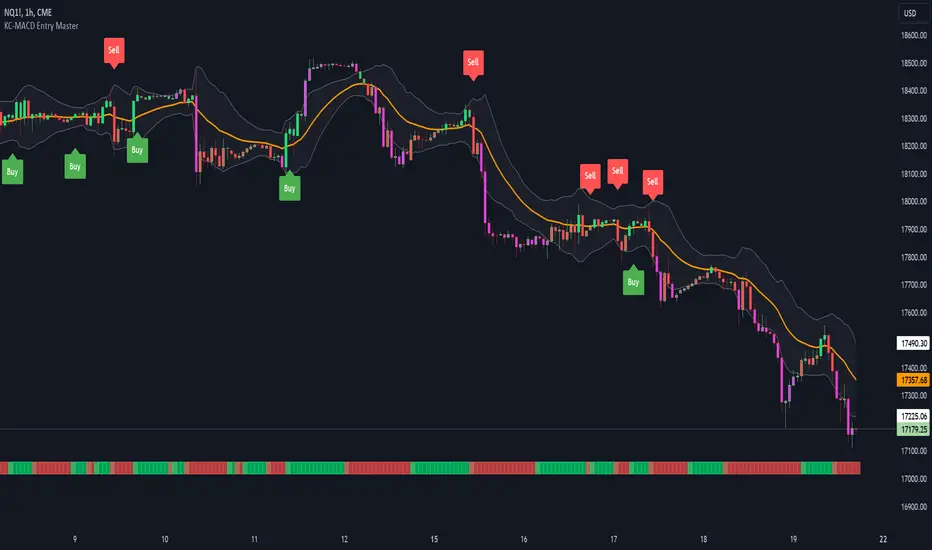
KC-MACD Entry Master @shrilssThe KC-MACD Entry Master is designed to enhance trading strategies by utilizing Keltner Channels and MACD for dynamic market analysis. This indicator excels in visually identifying market conditions with a sophisticated bar coloring system and an informative MACD Traffic Light feature.
Key Features:
- Dynamic Bar Coloring: The core feature of this indicator is its ability to adjust the color of bars based on their positioning relative to the Keltner Channels and the EMA (Exponential Moving Average). It colors bars lime or red when the closing price is within the Keltner Channels but above or below the EMA, respectively. Additionally, it uses a fuchsia color to indicate breakouts when the price extends beyond the Keltner Channels. This visual aid helps traders quickly identify potential buying or selling opportunities based on market volatility and price action.
- MACD Traffic Light: Positioned at the bottom of the chart, this unique feature displays the histogram color of the MACD, set by default to a 3/10/16 configuration—known as the 3-10 Oscillator. This Traffic Light gives traders an at-a-glance view of the underlying momentum and trend shifts, further aiding in decision-making processes.
- MACD-Based Entry Signals: By calculating the fast and slow moving averages specified by the user, the script determines MACD values and their crossover with a smoothed signal line. Entry points are then highlighted with shapes (e.g., "Buy" or "Sell") plotted on the chart when conditions are met, including alignment with the bar colors for enhanced accuracy.
Relative Average Extrapolation [ChartPrime]Relative Average Extrapolation (ChartPrime) is a new take on session averages, like the famous vwap . This indicator leverages patterns in the market by leveraging average-at-time to get a footprint of the average market conditions for the current time. This allows for a great estimate of market conditions throughout the day allowing for predictive forecasting. If we know what the market conditions are at a given time of day we can use this information to make assumptions about future market conditions. This is what allows us to estimate an entire session with fair accuracy. This indicator works on any intra-day time frame and will not work on time frames less than a minute, or time frames that are a day or greater in length. A unique aspect of this indicator is that it allows for analysis of pre and post market sessions independently from regular hours. This results in a cleaner and more usable vwap for each individual session. One drawback of this is that the indicator utilizes an average for the length of a session. Because of this, some after hour sessions will only have a partial estimation. The average and deviation bands will work past the point where it has been extrapolated to in this instance however. On low time frames due to the limited number of data points, the indicator can appear noisy.
Generally crypto doesn't have a consistent footprint making this indicator less suitable in crypto markets. Because of this we have implemented other weighting schemes to allow for more flexibility in the number of use cases for this indicator. Besides volume weighting we have also included time, volatility, and linear (none) weighting. Using any one of these weighting schemes will transform the vwap into a wma, volatility adjusted ma, or a simple moving average. All of the style are still session period and will become longer as the session progresses.
Relative Average Extrapolation (ChartPrime) works by storing data for each time step throughout the day by utilizing a custom indexing system. It takes the a key , ie hour/minute, and transforms it into an array index to stor the current data point in its unique array. From there we can take the current time of day and advance it by one step to retrieve the data point for the next bar index. This allows us to utilize the footprint the extrapolate into the future. We use the relative rate of change for the average, the relative deviation, and relative price position to extrapolate from the current point to the end of the session. This process is fast and effective and possibly easier to use than the built in map feature.
If you have used vwap before you should be familiar with the general settings for this indicator. We have made a point to make it as intuitive for anyone who is already used to using the standard vwap. You can pick the source for the average and adjust/enable the deviation bands multipliers in the settings group. The average period is what determines the number of days to use for the average-at-time. When it is set to 0 it will use all available data. Under "Extrapolation" you will find the settings for the estimation. "Direction Sensitivity" adjusts how sensitive the indicator is to the direction of the vwap. A higher number will allow it to change directions faster, where a lower number will make it more stable throughout the session. Under the "Style" section you will find all of the color and style adjustments to customize the appearance of this indicator.
Relative Average Extrapolation (ChartPrime) is an advanced and customizable session average indicator with the ability to estimate the direction and volatility of intra-day sessions. We hope you will find this script fascinating and useful in your trading and decision making. With its unique take on session weighting and forecasting, we believe it will be a secret weapon for traders for years to come.
Enjoy

US CPIIntroducing "US CPI" Indicator
The "US CPI" indicator, based on the Consumer Price Index (CPI) of the United States, is a valuable tool for analyzing inflation trends in the U.S. economy. This indicator is derived from official data provided by the U.S. Bureau of Labor Statistics (BLS) and is widely recognized as a key measure of inflationary pressures.
What is CPI?
The Consumer Price Index (CPI) is a measure that examines the average change in prices paid by consumers for a basket of goods and services over time. It is an essential economic indicator used to gauge inflationary trends and assess changes in the cost of living.
How is "US CPI" Calculated?
The "US CPI" indicator in this script retrieves CPI data from the Federal Reserve Economic Data (FRED) using the FRED:CPIAUCSL symbol. It calculates the rate of change in CPI over a specified period (typically 12 months) and applies technical analysis tools like moving averages (SMA and EMA) for trend analysis and smoothing.
Why Use "US CPI" Indicator?
1. Inflation Analysis: Monitoring CPI trends provides insights into the rate of inflation, which is crucial for understanding the overall economic health and potential impact on monetary policy.
2. Policy Implications: Changes in CPI influence decisions by policymakers, central banks, and investors regarding interest rates, fiscal policies, and asset allocation.
3. Market Sentiment: CPI data often impacts market sentiment, influencing trading strategies across various asset classes including currencies, bonds, and equities.
Key Features:
1. Customizable Smoothing: The indicator allows users to apply exponential moving average (EMA) smoothing to CPI data for clearer trend identification.
2. Visual Representation: The plotted line visually represents the inflation rate based on CPI data, helping traders and analysts assess inflationary pressures at a glance.
Sources and Data Integrity:
The CPI data used in this indicator is sourced directly from FRED, ensuring reliability and accuracy. The script incorporates robust security protocols to handle data requests and maintain data integrity in a trading environment.
In conclusion, the "US CPI" indicator offers a comprehensive view of inflation dynamics in the U.S. economy, providing traders, economists, and policymakers with valuable insights for informed decision-making and risk management.
Disclaimer: This indicator and accompanying analysis are for informational purposes only and should not be construed as financial advice. Users are encouraged to conduct their own research and consult with professional advisors before making investment decisions.

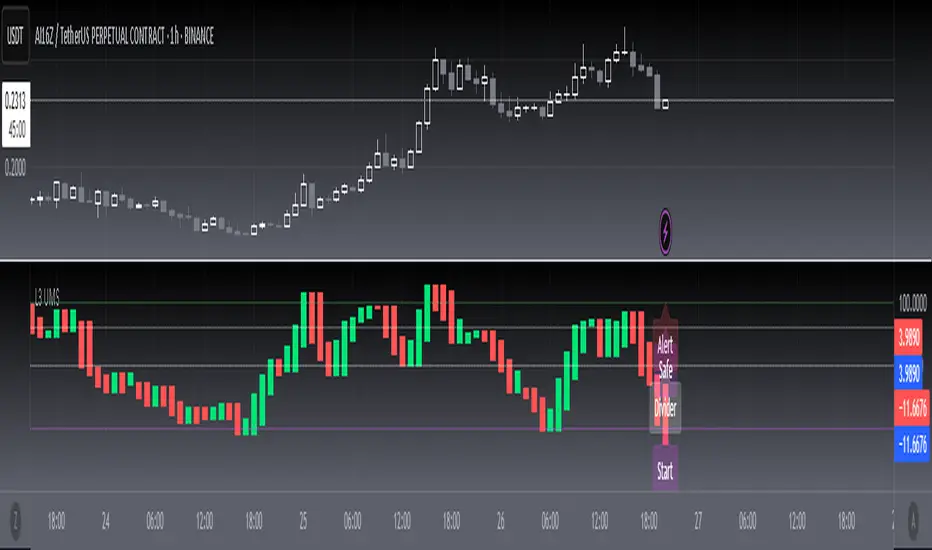
[blackcat] L3 Ultimate Market Sentinel (UMS)Script Introduction
The L3 Ultimate Market Sentinel (UMS) is a technical indicator specifically designed to capture market turning points. This indicator incorporates the principles of the Stochastic Oscillator and provides a clear view of market dynamics through four key boundary lines — the Alert Line, Start Line, Safe Line, and Divider Line. The UMS indicator not only focuses on the absolute movement of prices but also visually displays subtle changes in market sentiment through color changes (green for rise, red for fall), helping traders quickly identify potential buy and sell opportunities.
In the above image, you can see how the UMS indicator labels different market conditions on the chart. Green candlestick charts indicate price increases, while red candlestick charts indicate price decreases. The Alert Line (Alert Line) is typically set at a higher level to warn of potential overheating in the market; the Start Line (Start Line) is in the middle, marking the beginning of market momentum; the Safe Line (Safe Line) is at a lower level, indicating a potential oversold state in the market; the Divider Line (Divider Line) helps traders identify whether the market is in an overbought or oversold area.
Script Usage
1. **Identifying Turning Points**: Traders should pay close attention to the Alert Line and Safe Line in the UMS indicator. When the indicator approaches or touches the Alert Line, it may signal an imminent market reversal; when the indicator touches the Safe Line, it may indicate that the market is oversold and there is a chance for a rebound.
2. **Color Changes**: By observing the color changes in the histogram, traders can quickly judge market trends. The transition from green to red may indicate a weakening of upward momentum, while the shift from red to green could suggest a slowdown in downward momentum.
3. **Trading Strategy**: The UMS indicator is suitable for a variety of trading timeframes, ranging from 1 minute to 1 hour. Short-term traders can use the UMS indicator to capture rapid market fluctuations, while medium-term traders can combine it with other analytical tools to confirm the sustainability of trends.
Advantages and Limitations of the Indicator
**Advantages**:
- Intuitive color coding that is easy to understand and use.
- Multiple boundary lines provide comprehensive market analysis.
- Suitable for a variety of trading timeframes, offering high flexibility.
**Limitations**:
- As a single indicator, it may not cover all market dynamics.
- For novice traders, it may be necessary to use the UMS indicator in conjunction with other indicators to improve accuracy.
- The indicator may lag in extreme market conditions.
Special Note
The L3 Ultimate Market Sentinel (UMS) indicator is a powerful analytical tool, but it is not omnipotent. The market has its inherent risks and uncertainties, so it is recommended that traders use the UMS indicator in conjunction with their own trading strategies and risk management rules. Additionally, it is always recommended to fully test and verify any indicator in a simulated environment before actual application.
Kalman Hull Supertrend [BackQuant]Kalman Hull Supertrend
At its core, this indicator uses a Kalman filter of price, put inside of a hull moving average function (replacing the weighted moving averages) and then using that as a price source for the supertrend instead of the normal hl2 (high+low/2).
Therefore, making it more adaptive to price and also sensitive to recent price action.
PLEASE Read the following, knowing what an indicator does at its core before adding it into a system is pivotal. The core concepts can allow you to include it in a logical and sound manner.
1. What is a Kalman Filter
The Kalman Filter is an algorithm renowned for its efficiency in estimating the states of a linear dynamic system amidst noisy data. It excels in real-time data processing, making it indispensable in fields requiring precise and adaptive filtering, such as aerospace, robotics, and financial market analysis. By leveraging its predictive capabilities, traders can significantly enhance their market analysis, particularly in estimating price movements more accurately.
If you would like this on its own, with a more in-depth description please see our Kalman Price Filter.
2. Hull Moving Average (HMA) and Its Core Calculation
The Hull Moving Average (HMA) improves on traditional moving averages by combining the Weighted Moving Average's (WMA) smoothness and reduced lag. Its core calculation involves taking the WMA of the data set and doubling it, then subtracting the WMA of the full period, followed by applying another WMA on the result over the square root of the period's length. This methodology yields a smoother and more responsive moving average, particularly useful for identifying market trends more rapidly.
3. Combining Kalman Filter with HMA
The innovative combination of the Kalman Filter with the Hull Moving Average (KHMA) offers a unique approach to smoothing price data. By applying the Kalman Filter to the price source before its incorporation into the HMA formula, we enhance the adaptiveness and responsiveness of the moving average. This adaptive smoothing method reduces noise more effectively and adjusts more swiftly to price changes, providing traders with clearer signals for market entries or exits.
The calculation is like so:
KHMA(_src, _length) =>
f_kalman(2 * f_kalman(_src, _length / 2) - f_kalman(_src, _length), math.round(math.sqrt(_length)))
4. Integration with Supertrend
Incorporating this adaptive price smoothing technique into the Supertrend indicator further enhances its efficiency. The Supertrend, known for its proficiency in identifying the prevailing market trend and providing clear buy or sell signals, becomes even more powerful with an adaptive price source. This integration allows the Supertrend to adjust more dynamically to market changes, offering traders more accurate and timely trading signals.
5. Application in a Trading System
In a trading system, the Kalman Hull Supertrend indicator can serve as a critical component for identifying market trends and generating signals for potential entry and exit points. Its adaptiveness and sensitivity to price changes make it particularly useful for traders looking to minimize lag in signal generation and improve the accuracy of their market trend analysis. Whether used as a standalone tool or in conjunction with other indicators, its dynamic nature can significantly enhance trading strategies.
6. Core Calculations and Benefits
The core of this indicator lies in its sophisticated filtering and averaging techniques, starting with the Kalman Filter's predictive adjustments, followed by the adaptive smoothing of the Hull Moving Average, and culminating in the trend-detecting capabilities of the Supertrend. This multi-layered approach not only reduces market noise but also adapts to market volatility more effectively. Benefits include improved signal accuracy, reduced lag, and the ability to discern trend changes more promptly, offering traders a competitive edge.
Thus following all of the key points here are some sample backtests on the 1D Chart
Disclaimer: Backtests are based off past results, and are not indicative of the future.
INDEX:BTCUSD
INDEX:ETHUSD
BINANCE:SOLUSD

TrippleMACDCryptocurrency Scalping Strategy for 1m Timeframe
Introduction:
Welcome to our cutting-edge cryptocurrency scalping strategy tailored specifically for the 1-minute timeframe. By combining three MACD indicators with different parameters and averaging them, along with applying RSI, we've developed a highly effective strategy for maximizing profits in the cryptocurrency market. This strategy is designed for automated trading through our bot, which executes trades using hooks. All trades are calculated for long positions only, ensuring optimal performance in a fast-paced market.
Key Components:
MACD (Moving Average Convergence Divergence):
We've utilized three MACD indicators with varying parameters to capture different aspects of market momentum.
Averaging these MACD indicators helps smooth out noise and provides a more reliable signal for trading decisions.
RSI (Relative Strength Index):
RSI serves as a complementary indicator, providing insights into the strength of bullish trends.
By incorporating RSI, we enhance the accuracy of our entry and exit points, ensuring timely execution of trades.
Strategy Overview:
Long Position Entries:
Initiate long positions when all three MACD indicators signal bullish momentum and the RSI confirms bullish strength.
This combination of indicators increases the probability of successful trades, allowing us to capitalize on uptrends effectively.
Utilizing Linear Regression:
Linear regression is employed to identify consolidation phases in the market.
Recognizing consolidation periods helps us avoid trading during choppy price action, ensuring optimal performance.
Suitability for Grid Trading Bots:
Our strategy is well-suited for grid trading bots due to frequent price fluctuations and opportunities for grid activation.
The strategy's design accounts for price breakthroughs, which are advantageous for grid trading strategies.
Benefits of the Strategy:
Consistent Performance Across Cryptocurrencies:
Through rigorous testing on various cryptocurrency futures contracts, our strategy has demonstrated favorable results across different coins.
Its adaptability makes it a versatile tool for traders seeking consistent profits in the cryptocurrency market.
Integration of Advanced Techniques:
By integrating multiple indicators and employing linear regression, our strategy leverages advanced techniques to enhance trading performance.
This strategic approach ensures a comprehensive analysis of market conditions, leading to well-informed trading decisions.
Conclusion:
Our cryptocurrency scalping strategy offers a sophisticated yet user-friendly approach to trading in the fast-paced environment of the 1-minute timeframe. With its emphasis on automation, accuracy, and adaptability, our strategy empowers traders to navigate the complexities of the cryptocurrency market with confidence. Whether you're a seasoned trader or a novice investor, our strategy provides a reliable framework for achieving consistent profits and maximizing returns on your investment.

Kalman Filtered RSI Oscillator [BackQuant]Kalman Filtered RSI Oscillator
The Kalman Filtered RSI Oscillator is BackQuants new free indicator designed for traders seeking an advanced, empirical approach to trend detection and momentum analysis. By integrating the robustness of a Kalman filter with the adaptability of the Relative Strength Index (RSI), this tool offers a sophisticated method to capture market dynamics. This indicator is crafted to provide a clearer, more responsive insight into price trends and momentum shifts, enabling traders to make informed decisions in fast-moving markets.
Core Principles
Kalman Filter Dynamics:
At its core, the Kalman Filtered RSI Oscillator leverages the Kalman filter, renowned for its efficiency in predicting the state of linear dynamic systems amidst uncertainties. By applying it to the RSI calculation, the tool adeptly filters out market noise, offering a smoothed price source that forms the basis for more accurate momentum analysis. The inclusion of customizable parameters like process noise, measurement noise, and filter order allows traders to fine-tune the filter’s sensitivity to market changes, making it a versatile tool for various trading environments.
RSI Adaptation:
The RSI is a widely used momentum oscillator that measures the speed and change of price movements. By integrating the RSI with the Kalman filter, the oscillator not only identifies the prevailing trend but also provides a smoothed representation of momentum. This synergy enhances the indicator's ability to signal potential reversals and trend continuations with a higher degree of reliability.
Advanced Smoothing Techniques:
The indicator further offers an optional smoothing feature for the RSI, employing a selection of moving averages (HMA, THMA, EHMA, SMA, EMA, WMA, TEMA, VWMA) for traders seeking to reduce volatility and refine signal clarity. This advanced smoothing mechanism is pivotal for traders looking to mitigate the effects of short-term price fluctuations on the RSI's accuracy.
Empirical Significance:
Empirically, the Kalman Filtered RSI Oscillator stands out for its dynamic adjustment to market conditions. Unlike static indicators, the Kalman filter continuously updates its estimates based on incoming price data, making it inherently more responsive to new market information. This dynamic adaptation, combined with the RSI's momentum analysis, offers a powerful approach to understanding market trends and momentum with a depth not available in traditional indicators.
Trend Identification and Momentum Analysis:
Traders can use the Kalman Filtered RSI Oscillator to identify strong trends and momentum shifts. The color-coded RSI columns provide immediate visual cues on the market's direction and strength, aiding in quick decision-making.
Optimal for Various Market Conditions:
The flexibility in tuning the Kalman filter parameters makes this indicator suitable for a wide range of assets and market conditions, from volatile to stable markets. Traders can adjust the settings based on empirical testing to find the optimal configuration for their trading strategy.
Complementary to Other Analytical Tools:
While powerful on its own, the Kalman Filtered RSI Oscillator is best used in conjunction with other analytical tools and indicators. Combining it with volume analysis, price action patterns, or other trend-following indicators can provide a comprehensive view of the market, allowing for more nuanced and informed trading decisions.
The Kalman Filtered RSI Oscillator is a groundbreaking tool that marries empirical precision with advanced trend analysis techniques. Its innovative use of the Kalman filter to enhance the RSI's performance offers traders an unparalleled ability to navigate the complexities of modern financial markets. Whether you're a novice looking to refine your trading approach or a seasoned professional seeking advanced analytical tools, the Kalman Filtered RSI Oscillator represents a significant step forward in technical analysis capabilities.
Thus following all of the key points here are some sample backtests on the 1D Chart
Disclaimer: Backtests are based off past results, and are not indicative of the future.
INDEX:BTCUSD
INDEX:ETHUSD
BINANCE:SOLUSD

Adaptive Moving Average (AMA) Signals (Zeiierman)█ Overview
The Adaptive Moving Average (AMA) Signals indicator, enhances the classic concept of moving averages by making them adaptive to the market's volatility. This adaptability makes the AMA particularly useful in identifying market trends with varying degrees of volatility.
The core of the AMA's adaptability lies in its Efficiency Ratio (ER), which measures the directionality of the market over a given period. The ER is calculated by dividing the absolute change in price over a period by the sum of the absolute differences in daily prices over the same period.
⚪ Why It's Useful
The AMA Signals indicator is particularly useful because of its adaptability to changing market conditions. Unlike static moving averages, it dynamically adjusts, providing more relevant signals that can help traders capture trends earlier or identify reversals with greater accuracy. Its configurability makes it suitable for various trading strategies and timeframes, from day trading to swing trading.
█ How It Works
The AMA Signals indicator operates on the principle of adapting to market efficiency through the calculation of the Efficiency Ratio (ER), which measures the directionality of the market over a specified period. By comparing the net price change to total price movements, the AMA adjusts its sensitivity, becoming faster during trending markets and slower during sideways markets. This adaptability is enhanced by a gamma parameter that filters signals for either trend continuation or reversal, making it versatile across different market conditions.
change = math.abs(close - close )
volatility = math.sum(math.abs(close - close ), n)
ER = change / volatility
Efficiency Ratio (ER) Calculation: The AMA begins with the computation of the Efficiency Ratio (ER), which measures the market's directionality over a specified period. The ER is a ratio of the net price change to the total price movements, serving as a measure of the efficiency of price movements.
Adaptive Smoothing: Based on the ER, the indicator calculates the smoothing constants for the fastest and slowest Exponential Moving Averages (EMAs). These constants are then used to compute a Scaled Smoothing Coefficient (SC) that adapts the moving average to the market's efficiency, making it faster during trending periods and slower in sideways markets.
Signal Generation: The AMA applies a filter, adjusted by a "gamma" parameter, to identify trading signals. This gamma influences the sensitivity towards trend or reversal signals, with options to adjust for focusing on either trend-following or counter-trend signals.
█ How to Use
Trend Identification: Use the AMA to identify the direction of the trend. An upward moving AMA indicates a bullish trend, while a downward moving AMA suggests a bearish trend.
Trend Trading: Look for buy signals when the AMA is trending upwards and sell signals during a downward trend. Adjust the fast and slow EMA lengths to match the desired sensitivity and timeframe.
Reversal Trading: Set the gamma to a positive value to focus on reversal signals, identifying potential market turnarounds.
█ Settings
Period for ER calculation: Defines the lookback period for calculating the Efficiency Ratio, affecting how quickly the AMA responds to changes in market efficiency.
Fast EMA Length and Slow EMA Length: Determine the responsiveness of the AMA to recent price changes, allowing traders to fine-tune the indicator to their trading style.
Signal Gamma: Adjusts the sensitivity of the filter applied to the AMA, with the ability to focus on trend signals or reversal signals based on its value.
AMA Candles: An innovative feature that plots candles based on the AMA calculation, providing visual cues about the market trend and potential reversals.
█ Alerts
The AMA Signals indicator includes configurable alerts for buy and sell signals, as well as positive and negative trend changes.
-----------------
Disclaimer
The information contained in my Scripts/Indicators/Ideas/Algos/Systems does not constitute financial advice or a solicitation to buy or sell any securities of any type. I will not accept liability for any loss or damage, including without limitation any loss of profit, which may arise directly or indirectly from the use of or reliance on such information.
All investments involve risk, and the past performance of a security, industry, sector, market, financial product, trading strategy, backtest, or individual's trading does not guarantee future results or returns. Investors are fully responsible for any investment decisions they make. Such decisions should be based solely on an evaluation of their financial circumstances, investment objectives, risk tolerance, and liquidity needs.
My Scripts/Indicators/Ideas/Algos/Systems are only for educational purposes!

Divergence Toolkit (Real-Time)The Divergence Toolkit is designed to automatically detect divergences between the price of an underlying asset and any other @TradingView built-in or community-built indicator or script. This algorithm provides a comprehensive solution for identifying both regular and hidden divergences, empowering traders with valuable insights into potential trend reversals.
🔲 Methodology
Divergences occur when there is a disagreement between the price action of an asset and the corresponding indicator. Let's review the conditions for regular and hidden divergences.
Regular divergences indicate a potential reversal in the current trend.
Regular Bullish Divergence
Price Action - Forms a lower low.
Indicator - Forms a higher low.
Interpretation - Suggests that while the price is making new lows, the indicator is showing increasing strength, signaling a potential upward reversal.
Regular Bearish Divergence
Price Action - Forms a higher high.
Indicator - Forms a lower high.
Interpretation - Indicates that despite the price making new highs, the indicator is weakening, hinting at a potential downward reversal.
Hidden divergences indicate a potential continuation of the existing trend.
Hidden Bullish Divergence
Price Action - Forms a higher low.
Indicator - Forms a lower low.
Interpretation - Suggests that even though the price is retracing, the indicator shows increasing strength, indicating a potential continuation of the upward trend.
Hidden Bearish Divergence
Price Action - Forms a lower high.
Indicator - Forms a higher high.
Interpretation - Indicates that despite a retracement in price, the indicator is still strong, signaling a potential continuation of the downward trend.
In both regular and hidden divergences, the key is to observe the relationship between the price action and the indicator. Divergences can provide valuable insights into potential trend reversals or continuations.
The methodology employed in this script involves the detection of divergences through conditional price levels rather than relying on detected pivots. Traditionally, divergences are created by identifying pivots in both the underlying asset and the oscillator. However, this script employs a trailing stop on the oscillator to detect potential swings, providing a real-time approach to identifying divergences, you may find more info about it here (SuperTrend Toolkit) . We detect swings or pivots simply by testing for crosses between the indicator and its trailing stop.
type oscillator
float o = Oscillator Value
float s = Trailing Stop Value
oscillator osc = oscillator.new()
bool l = ta.crossunder(osc.o, osc.s) => Utilized as a formed high
bool h = ta.crossover (osc.o, osc.s) => Utilized as a formed low
// Note: these conditions alone could cause repainting when they are met but canceled at a later time before the bar closes. Hence, we wait for a confirmed bar.
// The script also includes the option to immediately alert when the conditions are met, if you choose so.
By testing for conditional price levels, the script achieves similar outcomes without the delays associated with pivot-based methods.
type bar
float o = open
float h = high
float l = low
float c = close
bar b = bar.new()
bool hi = b.h < b.h => A higher price level has been created
bool lo = b.l > b.l => A lower price level has been created
// Note: These conditions do not check for certain price swings hence they may seldom result in inaccurate detection.
🔲 Setup Guide
A simple example on one of my public scripts, Standardized MACD
🔲 Utility
We may auto-detect divergences to spot trend reversals & continuations.
🔲 Settings
Source - Choose an oscillator source of which to base the Toolkit on.
Zeroing - The Mid-Line value of the oscillator, for example RSI & MFI use 50.
Sensitivity - Calibrates the sensitivity of which Divergencies are detected, higher values result in more detections but less accuracy.
Lifetime - Maximum timespan to detect a Divergence.
Repaint - Switched on, the script will trigger Divergencies as they happen in Real-Time, could cause repainting when the conditions are met but canceled at a later time before bar closes.
🔲 Alerts
Bearish Divergence
Bullish Divergence
Bearish Hidden Divergence
Bullish Hidden Divergence
As well as the option to trigger 'any alert' call.
The Divergence Toolkit provides traders with a dynamic tool for spotting potential trend reversals and continuations. Its innovative approach to real-time divergence detection enhances the timeliness of identifying market opportunities.
