[blackcat] L3 Banker Fund AttackLevel 3
Background
This indicator is used to capture the movement of the banker fund. The buying and selling point is determined according to whether the momentum of the banker fund and the price momentum resonate.
How to use the indicator:
The red column line indicates that the banker fund accumulation signal appears, and the following 2 conditions are all satisfied to buy; (both above the green line of the banker fund attack threshold)
1. The yellow line and the purple line all cross the red accumulation histogram signal;
2. The yellow and purple trend lines are up
Key point: If the yellow line crosses the green line of the banker fund attack threshold, it will be pulled up or the big market will open! The main thing is to see the red accumulation histogram signal, or the green line that crosses the banker fund attack threshold. If there is a red accumulation histogram signal, it means that there are main low-acquisition chips, and start trading on the left to open a position. The area above the green line of the banker fund attack threshold belongs to the main force pulling stage. When the green line of the banker fund attack threshold is not broken upwards, there is still a lot of profit space, but if it can be effectively broken through, it is highly profitable!
Remarks
This indicator only effective for instruments that contains banker fund. If there is no obvious large fund inside, the indicator is not as meaningful as it is called.
I verified it worked well for > 4H or 1D timeframe. For the other time frames, you may need to check and verify by yourself.
Feedbacks are appreciated.
"accumulation" için komut dosyalarını ara

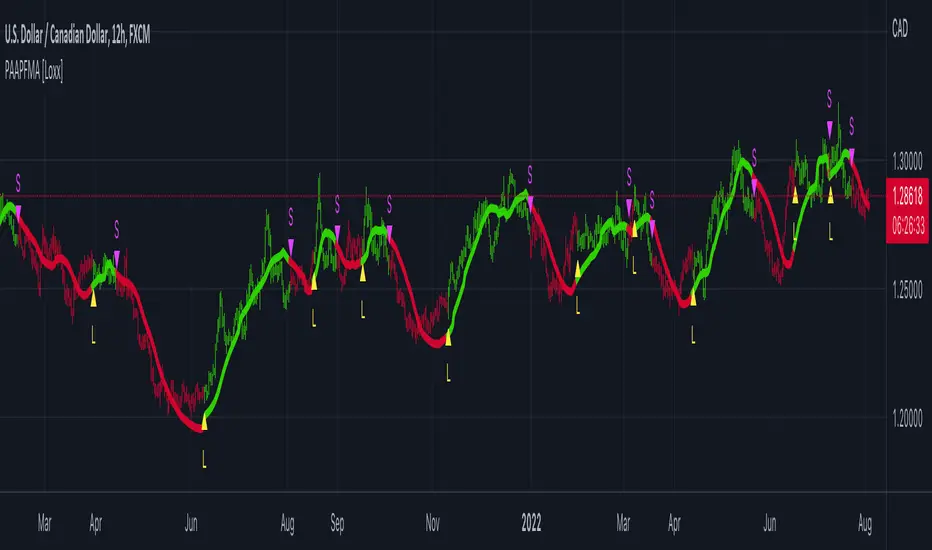
PA-Adaptive Polynomial Regression Fitted Moving Average [Loxx]PA-Adaptive Polynomial Regression Fitted Moving Average is a moving average that is calculated using Polynomial Regression Analysis. The purpose of this indicator is to introduce polynomial fitting that is to be used in future indicators. This indicator also has Phase Accumulation adaptive period inputs. Even though this first indicator is for demonstration purposes only, its still one of the only viable implementations of Polynomial Regression Analysis on TradingView is suitable for trading, and while this same method can be used to project prices forward, I won't be doing that since forecasting is generally worthless and causes unavoidable repainting. This indicator only repaints on the current bar. Once the bar closes, any signal on that bar won't change.
For other similar Polynomial Regression Fitted methodologies, see here
Poly Cycle
What is the Phase Accumulation Cycle?
The phase accumulation method of computing the dominant cycle is perhaps the easiest to comprehend. In this technique, we measure the phase at each sample by taking the arctangent of the ratio of the quadrature component to the in-phase component. A delta phase is generated by taking the difference of the phase between successive samples. At each sample we can then look backwards, adding up the delta phases.When the sum of the delta phases reaches 360 degrees, we must have passed through one full cycle, on average.The process is repeated for each new sample.
The phase accumulation method of cycle measurement always uses one full cycle’s worth of historical data.This is both an advantage and a disadvantage.The advantage is the lag in obtaining the answer scales directly with the cycle period.That is, the measurement of a short cycle period has less lag than the measurement of a longer cycle period. However, the number of samples used in making the measurement means the averaging period is variable with cycle period. longer averaging reduces the noise level compared to the signal.Therefore, shorter cycle periods necessarily have a higher out- put signal-to-noise ratio.
What is Polynomial Regression?
In statistics, polynomial regression is a form of regression analysis in which the relationship between the independent variable x and the dependent variable y is modelled as an nth degree polynomial in x. Polynomial regression fits a nonlinear relationship between the value of x and the corresponding conditional mean of y, denoted E(y |x). Although polynomial regression fits a nonlinear model to the data, as a statistical estimation problem it is linear, in the sense that the regression function E(y | x) is linear in the unknown parameters that are estimated from the data. For this reason, polynomial regression is considered to be a special case of multiple linear regression.
Things to know
You can select from 33 source types
The source is smoothed before being injected into the Polynomial fitting algorithm, there are 35+ moving averages to choose from for smoothing
The output of the Polynomial fitting algorithm is then smoothed to create the signal, there are 35+ moving averages to choose from for smoothing
Included
Alerts
Signals
Bar coloring
PA-Adaptive TRIX Log [Loxx]PA-Adaptive TRIX Log is a Phase Accumulation Adaptive TRIX Log indicator. This adaptation smooths the signal to catch larger trends.
What is TRIX?
TRIX is a momentum oscillator that displays the percent rate of change of a TEMA . It was developed in the early 1980's by Jack Hutson, an editor for "Technical Analysis of Stocks and Commodities" magazine. With its triple smoothing, TRIX is designed to filter insignificant price movements. In his article he uses a logarithm of a price (which is in many versions, left out).
What is the Phase Accumulation Cycle?
The phase accumulation method of computing the dominant cycle is perhaps the easiest to comprehend. In this technique, we measure the phase at each sample by taking the arctangent of the ratio of the quadrature component to the in-phase component. A delta phase is generated by taking the difference of the phase between successive samples. At each sample we can then look backwards, adding up the delta phases.When the sum of the delta phases reaches 360 degrees, we must have passed through one full cycle, on average.The process is repeated for each new sample.
The phase accumulation method of cycle measurement always uses one full cycle’s worth of historical data.This is both an advantage and a disadvantage.The advantage is the lag in obtaining the answer scales directly with the cycle period.That is, the measurement of a short cycle period has less lag than the measurement of a longer cycle period. However, the number of samples used in making the measurement means the averaging period is variable with cycle period. longer averaging reduces the noise level compared to the signal.Therefore, shorter cycle periods necessarily have a higher out- put signal-to-noise ratio.
Included
Bar coloring
2 signal options
Alerts

Volume Indicators PackageCONTAINS 3 OF MY BEST VOLUME INDICATORS ALL FOR THE PRICE OF ONE!
CONTAINS:
Average Dollar Volume in RED
Up/Down Volume Ratio in Green
Volume Buzz/Volume Run Rate in BLUE
If you would like to get these individually, I also have scripts for that too.
Below is information about all three of these indicators, what they do, and why they are important.
---------------------------------------------------------------------------------------------AVERAGE DOLLAR VOLUME----------------------------------------------------------------------------------------
Dollar volume is simply the volume traded multiplied times the cost of the stock.
Dollar volume is an extremely important metric for finding stocks with enough liquidity for market makers to position themselves in. Market Liquidity is defined as market's feature whereby an individual or firm can quickly purchase or sell an asset without causing a drastic change in the asset's price. The key concept you want to understand is that these big instructions with billions of dollars need liquidity in a stock in order to even think about buying it, and therefore these institutions will demand a large dollar volume . A good dollar volume amount, that represents a pretty liquid name, is typically above 100 million $ average. Why are institutions important? Simple because they are the ones who make stocks move, and I mean really move. If you want to see large growth from a stock in a short amount of time, you need institutions wielding billions of dollars to be fighting one another to buy more shares. Institutions are the ones who make or break a stock, this is why we call them market makers.
My script calculates average dollar volume using four averages: the 50, the 30, the 20, and the 10 period. I use multiple averages in order to provide the accurate and up to date information to you. It then selects the minimum of these averages and divides this value by 1 million and displays this number to you.
TL;DR? If you want monster moves from your stocks, you need to pick names with average high liquidity(dollar volume >= $100 million). The number presented to you is in millions of whatever currency the name is traded in.
---------------------------------------------------------------------------------------------UP/DOWN VOLUME RATIO-----------------------------------------------------------------------------------------
Up/Down Volume Ratio is calculated by summing volume on days when it closes up and divide that total by the volume on days when the stock closed down.
High volume up days are typically a sign of accumulation(buying) by big players, while down days are signs of distribution(selling) by big market players. The Up Down volume ratio takes this assumption and turns it into a tangible number that's easier for the trader to understand. My formula is calculated using the past 50 periods, be warned it will not display a value for stocks with under 50 periods of trading history. This indicator is great for identify accumulation of growth stocks early on in their moves, most of the time you would like a growth stocks U/D value to be above 2, showing institutional sponsorship of a stock.
Up/Down Volume value interpretation:
U/D < 1 -> Bearish outlook, as sellers are in control
U/D = 1 -> Sellers and Buyers are equal
U/D > 1 -> Bullish outlook, as buyers are in control
U/D > 2 -> Bullish outlook, significant accumulation underway by market makers
U/D >= 3 -> MONSTER STOCK ALERT, market makers can not get enough of this stock and are ravenous to buy more
U/D values greater than 2 are rare and typically do not last very long, and U/D >= 3 are extremely rare one example I kind find of a stock's U/D peaking above 3 was Google back in 2005.
-----------------------------------------------------------------------------------------------------VOLUME BUZZ-----------------------------------------------------------------------------------------------
Volume Buzz/ Volume Run Rate as seen on TC2000 and MarketSmith respectively.
Basically, the volume buzz tells you what percentage over average(100 time period moving average) the volume traded was. You can use this indicator to more readily identify above-average trading volume and accumulation days on charts. The percentage will show up in the top left corner, make sure to click the settings button and uncheck the second box(left of plot) in order to get rid of the chart line.

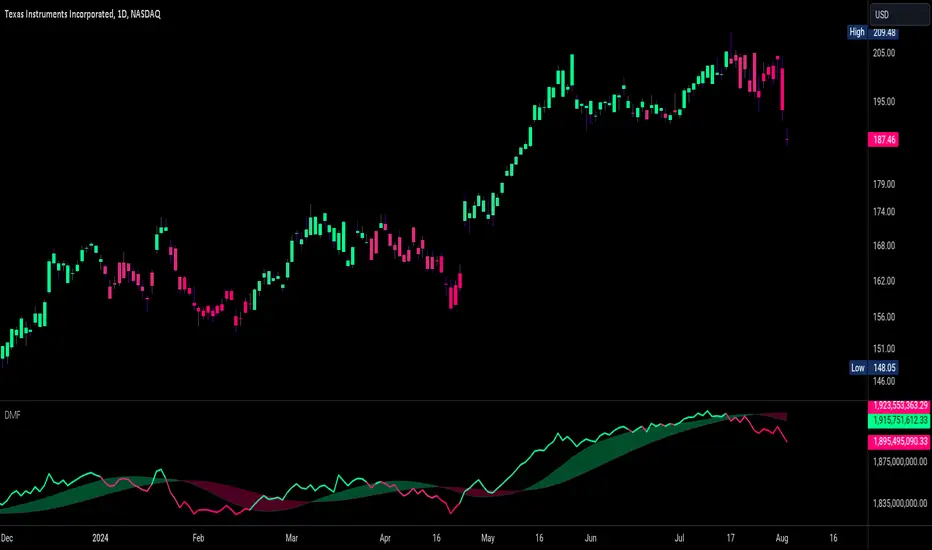
Dynamic Money FlowDynamic Money Flow is a volume indicator based on Marc Chaikin's Money Flow with a few improvements.
It can be used to confirm break-outs and trends.
Zero line crosses and divergences can provide useful signals while considering chart analysis as well.
Two weaknesses of CMF have been already fixed by Colin Twiggs (IncredibleCharts)...
1.CMF uses Chaikin's accumulation/distribution line to calculate the flow of money.
Accumulation/distribution line does not take the gaps into account. This can be solved using true range.
I call it true accumulation/distribution.
2.Oscillators have a tendency to center because of averaging calculations.
DMF is average of flowing volume divided by average of total volume. This means indicator plots the change of first factor compared to the other one. In Simple Averaging method every data is given an equal weight thus when the last data drops it will have heavy impact on the averages and the change of them.
It is much easier to identity these impacts after the drop of very high or very low data... So reducing the weight exponentially is a better option.
3.There is something else with CMF... changes of close price is ignored, because the formula only compares close price to its range.
To include the movements of close beside the close to range comparison, the distance between two last close prices should be compared to true range as well.
So volume can be distributed between close to range comparison (True Accumulation/Distribution) and close to close comparison automatically. And then results are summed to have a single multiplier.
An example for how close to close comparison affects DMF...
Or here you can see how lower wicks keep TMF (same as CMF in this case) from crossing zero line while price is trending down.
Market Waves [Smart Trend & Signals]Market Waves
Overview
Market Waves is a comprehensive technical analysis tool designed to identify market trends with minimal lag while filtering out noise. By combining a modified Hull Moving Average (HMA) with Volatility Bands (ATR), this indicator provides a clear visual representation of market direction, entry signals, and automated Take Profit targets.
Key Features
1. Low-Lag Trend Detection
The core of this indicator uses a custom HMA variation to smooth out price action without the delay common in standard moving averages.
• Bullish Trend: The trend ribbon turns Teal when price breaks above the lower volatility band.
• Bearish Trend: The trend ribbon turns Red when price breaks below the upper volatility band.
2. Smart Signals & Power Filter
The indicator generates two types of signals to help you gauge entry quality:
• Standard Signals (BUY / SELL): Generated purely on trend reversals. Good for early entries.
• Power Signals (BUY+ / SELL+): These are high-probability setups that pass a multi-factor filter:
• Trend Confirmation: The primary trend must flip.
• RSI Momentum: RSI must be above 50 (for Buy) or below 50 (for Sell).
• Volume Spike: Volume must exceed the 20-period average (optional in settings).
3. Automated Take Profit Targets
Upon every new signal, the indicator automatically projects three Take Profit levels based on market volatility (ATR) at the moment of entry:
• TP1: Conservative target (1x Risk).
• TP2: Moderate target (2x Risk).
• MAX PROFIT: Aggressive target (4x Risk).
4. Accumulation Bar Coloring
Candles are colored to reflect the true strength of the move:
• Teal/Red: Strong trend active.
• Gray: Accumulation or consolidation phase. This helps traders avoid chopping markets or weak signals.
5. Confidence Score
A dynamic percentage (50% - 99%) is displayed above signals, calculated based on the steepness and momentum of the wave change, giving you an instant metric of the trend's initial strength.
How to Use
1. Identify Trend: Look at the colored ribbon. Do not trade against the ribbon color.
2. Wait for Signals: Look for "BUY" or "SELL" labels. For higher accuracy, wait for the "+" signals (e.g., "BUY+").
3. Confirm with Color: Ensure the bar color is not Gray (Weak/Accumulation). A Teal bar confirms a Buy; a Red bar confirms a Sell.
4. Manage Trade: Use the trend ribbon as a trailing stop-loss and the projected TP lines for exiting positions.
Settings
• Wave Length: Adjusts the smoothness of the trend (Default: 24).
• Sensitivity Factor: Multiplier for the ATR bands. Higher values reduce false signals but may delay entry (Default: 2.0).
• Show Signals/TP: Toggles for visual elements to keep the chart clean.

Smart Trader, Episode 04, by Ata Sabanci, Candles and Z ScoresSmart Trader, Episode 04
Candles and Z-Scores: A Statistical Approach to Market Analysis
━━━━━━━━━━━━━━━━━━━━━━━━━━━━━━━━━━━━━━━━━━━
OVERVIEW
This indicator applies Z-Score statistical analysis to measure how unusual current market conditions are compared to historical norms. It simultaneously analyzes five key metrics: Price, Total Volume, Buy Volume, Sell Volume, and Delta (Buy minus Sell) . The system detects 60 academically-researched market scenarios and provides visual feedback through Z-Lines (support/resistance levels), Event Markers, Trend Channels, and a comprehensive Dashboard.
━━━━━━━━━━━━━━━━━━━━━━━━━━━━━━━━━━━━━━━━━━━
CORE CONCEPT: WHY Z-SCORE?
A Z-Score measures how many standard deviations a value is from its mean. In financial markets, extreme Z-Scores indicate statistically rare events that often precede significant price movements.
Mathematical Formula:
Z = (Current Value - Mean) / Standard Deviation
Interpretation:
• Z ≥ +2.0: Extremely high (occurs approximately 2.5% of the time)
• Z ≥ +1.0: Above average
• Z ≈ 0: Normal (near the mean)
• Z ≤ -1.0: Below average
• Z ≤ -2.0: Extremely low (occurs approximately 2.5% of the time)
━━━━━━━━━━━━━━━━━━━━━━━━━━━━━━━━━━━━━━━━━━━
ACADEMIC FOUNDATION
This indicator is inspired by / grounded in market microstructure literature (abbreviated citations in-script) from market microstructure literature:
• Price-Volume Relationship - Karpoff (1987), Journal of Financial and Quantitative Analysis, Cambridge
Volume is positively correlated with price change magnitude
• Order Flow Imbalance - Cont, Kukanov, Stoikov (2014), Journal of Financial Econometrics
Order imbalance drives price more reliably than raw volume
• Informed Trading (PIN Model) - Easley, Kiefer, O'Hara, Paperman (1996), Journal of Finance
Buy/Sell imbalance reveals informed trader activity
• Mixture of Distributions - Tauchen & Pitts (1983), Clark (1973)
Volume clusters with volatility regimes
• Volume Predictability - Gervais, Kaniel, Mingelgrin (2001)
Volume shocks predict future returns
• Liquidity & Order Imbalance - Chordia, Roll, Subrahmanyam (2002)
Order imbalance affects short-term returns
• Volume-Return Dynamics - Llorente, Michaely, Saar, Wang (2002)
Speculation vs. risk-sharing patterns
• Reversal vs. Continuation - Campbell, Grossman, Wang (MIT)
High volume predicts lower autocorrelation
━━━━━━━━━━━━━━━━━━━━━━━━━━━━━━━━━━━━━━━━━━━
VOLUME ENGINE
The indicator offers two methods for decomposing total volume into Buy and Sell components:
Method 1: Geometry (Approximation)
Uses candle structure to estimate buying and selling pressure:
Buy Volume = Total Volume × (Close - Low) / (High - Low)
Sell Volume = Total Volume × (High - Close) / (High - Low)
• Works on all instruments without additional data requirements
• Fast calculation
• Less precise than intrabar method
Method 2: Intrabar (Precise)
Uses Lower Timeframe (LTF) tick/second data to aggregate actual up-ticks versus down-ticks:
• More accurate volume decomposition
• Requires LTF data availability
• Configurable LTF: 1T (tick), 1S, 15S, 1M
Delta Calculation:
Delta = Buy Volume - Sell Volume
━━━━━━━━━━━━━━━━━━━━━━━━━━━━━━━━━━━━━━━━━━━
Z-SCORE SYSTEM
The system calculates Z-Scores for five metrics simultaneously, using a configurable lookback period (default: 20 bars):
• Zp (Price Z-Score): Measures price deviation from its mean
• Zv (Volume Z-Score): Measures total volume deviation
• Zbuy (Buy Volume Z-Score): Measures buying pressure deviation
• Zsell (Sell Volume Z-Score): Measures selling pressure deviation
• ZΔ (Delta Z-Score): Measures order flow imbalance deviation
Threshold Constants:
• ZH (Z High) = 2.0: Extreme threshold
• ZM (Z Medium) = 1.0: Moderate threshold
• Z0 (Z Zero) = 0.5: Near-zero threshold
Group System:
The analysis window is divided into groups (default: 5 groups × 20 bars = 100 bar total window). Group numbers (1, 2, 3...) are displayed above candles when enabled, helping identify the relative age of detected levels.
━━━━━━━━━━━━━━━━━━━━━━━━━━━━━━━━━━━━━━━━━━━
Z-LINES (SUPPORT/RESISTANCE LEVELS)
When any metric reaches an extreme Z-Score, the system marks that price level as a significant support or resistance zone.
Detection Logic:
• Upper Z-Line: Drawn from the HIGH when Z ≥ upper threshold (default +2.0)
• Lower Z-Line: Drawn from the LOW when Z ≤ lower threshold (default -2.0)
Multi-Metric Detection:
Z-Lines can be triggered by any of the five metrics (Price, Volume, Buy, Sell, Delta). When multiple metrics trigger at similar price levels, they are clustered together into a single combined label showing all contributing metrics.
Persistence:
Z-Lines persist for the entire analysis window (Period × Groups bars) and are NOT removed when price touches them. This allows traders to see historical support/resistance levels that may still be relevant.
Anti-Overlap System:
Labels are automatically repositioned to prevent overlap. The "Label Min Gap (%)" setting controls minimum vertical separation between ALL labels (both upper and lower), ensuring readability even when multiple levels cluster together.
━━━━━━━━━━━━━━━━━━━━━━━━━━━━━━━━━━━━━━━━━━━
EVENT DETECTION ENGINE (60 SCENARIOS)
The system analyzes 60 distinct market scenarios based on Z-Score combinations. Each scenario is derived from academic research and assigned a confidence score based on signal strength and alignment.
Notation:
• Zp = Price Z-Score
• Zv = Total Volume Z-Score
• Zbuy = Buy Volume Z-Score
• Zsell = Sell Volume Z-Score
• ZΔ = Delta Z-Score
• dirP = Price direction (+1 if Zp > 0.5, -1 if Zp < -0.5, else 0)
• = Previous bar value
• ZH = 2.0 (High threshold)
• ZM = 1.0 (Medium threshold)
• Z0 = 0.5 (Zero threshold)
─────────────────────────────────────────────────────────────
CATEGORY A: PRICE-VOLUME (Events 1-10)
Based on: Karpoff (1987), Tauchen-Pitts (1983), Clark (1973)
─────────────────────────────────────────────────────────────
Event 1: Breakout Confirmed
|Zp| ≥ ZH AND Zv ≥ ZH AND sign(ZΔ) = dirP AND dirP ≠ 0
Direction: Bullish/Bearish (follows price direction)
Event 2: Trend Strength Confirmed
|Zp| ≥ ZH AND Zv ≥ ZH
Direction: Follows price direction
Event 3: Fragile Move
|Zp| ≥ ZH AND Zv ≤ -ZM
Direction: Warning (price move without volume support)
Event 4: Weak Rally
Zp ≥ ZH AND Zv ≤ -ZH
Direction: Warning (price up without volume)
Event 5: Weak Selloff
Zp ≤ -ZH AND Zv ≤ -ZH
Direction: Warning (price down without volume)
Event 6: Momentum Build
ZM ≤ |Zp| < ZH AND Zv ≥ ZH
Direction: Follows price direction
Event 7: Churn
|Zp| ≤ Z0 AND Zv ≥ ZH
Direction: Neutral (high volume, low price movement)
Event 8: Quiet Compression
|Zp| ≤ Z0 AND Zv ≤ -ZH
Direction: Neutral (low volume, low price movement)
Event 9: High Volume Regime
Zv ≥ ZH
Direction: Neutral
Event 10: Low Volume Regime
Zv ≤ -ZH
Direction: Neutral
─────────────────────────────────────────────────────────────
CATEGORY B: ORDER-FLOW / DELTA (Events 11-16)
Based on: Cont, Kukanov, Stoikov (2014), Easley, Kiefer, O'Hara, Paperman (1996)
─────────────────────────────────────────────────────────────
Event 11: Imbalance Drives Price
|ZΔ| ≥ ZH AND sign(ZΔ) = dirP AND dirP ≠ 0
Direction: Follows price direction (dirP), with delta alignment required
Event 12: Divergence Top
Zp ≥ ZH AND ZΔ ≤ -ZH
Direction: Warning (distribution at top)
Event 13: Divergence Bottom
Zp ≤ -ZH AND ZΔ ≥ ZH
Direction: Warning (accumulation at bottom)
Event 14: Absorption Positive
|Zp| ≤ Z0 AND Zv ≥ ZH AND ZΔ ≥ ZH
Direction: Bullish (buy absorption, support forming)
Event 15: Absorption Negative
|Zp| ≤ Z0 AND Zv ≥ ZH AND ZΔ ≤ -ZH
Direction: Bearish (sell absorption, resistance forming)
Event 16: Depth Wall
Zv ≥ ZH AND |ZΔ| ≥ ZH AND |Zp| ≤ Z0
Direction: Neutral (market depth absorbing)
─────────────────────────────────────────────────────────────
CATEGORY C: BUY VS SELL (Events 17-23)
Based on: Easley, Kiefer, O'Hara, Paperman (1996), Chordia, Roll, Subrahmanyam (2002)
─────────────────────────────────────────────────────────────
Event 17: Aggressive Buy Dominance
Zbuy ≥ ZH AND ZΔ ≥ ZH AND Zsell ≤ -ZM
Direction: Bullish
Event 18: Aggressive Sell Dominance
Zsell ≥ ZH AND ZΔ ≤ -ZH AND Zbuy ≤ -ZM
Direction: Bearish
Event 19: Two-Sided Battle
Zbuy ≥ ZH AND Zsell ≥ ZH AND |ZΔ| ≤ Z0
Direction: Neutral (buyers and sellers equally strong)
Event 20: Battle with Buy Edge
Zbuy ≥ ZH AND Zsell ≥ ZH AND ZM ≤ ZΔ < ZH
Direction: Bullish
Event 21: Battle with Sell Edge
Zbuy ≥ ZH AND Zsell ≥ ZH AND -ZH < ZΔ ≤ -ZM
Direction: Bearish
Event 22: Hidden Accumulation
Zbuy ≥ ZH AND |Zp| ≤ Z0 AND Zv ≥ ZH
Direction: Bullish (buy shock without price movement)
Event 23: Hidden Distribution
Zsell ≥ ZH AND |Zp| ≤ Z0 AND Zv ≥ ZH
Direction: Bearish (sell shock without price movement)
─────────────────────────────────────────────────────────────
CATEGORY D: PREDICTABILITY (Events 24-26)
Based on: Gervais, Kaniel, Mingelgrin (2001), Karpoff (1987)
─────────────────────────────────────────────────────────────
Event 24: Volume Shock Positive Drift
Zv ≥ ZH AND |Zp| ≤ ZM
Direction: Follows price direction
Event 25: Volume Shock Negative Drift
Zv ≤ -ZH AND |Zp| ≤ ZM
Direction: Opposite to price direction
Event 26: Abnormal Volume Info Arrival
Zv ≥ ZH
Direction: Neutral
─────────────────────────────────────────────────────────────
CATEGORY E: REVERSAL VS CONTINUATION (Events 27-30)
Based on: Campbell, Grossman, Wang (MIT), Llorente, Michaely, Saar, Wang (2002)
─────────────────────────────────────────────────────────────
Event 27: High Vol Reversal Risk
Zv ≥ ZH
Direction: Warning (high volume implies lower positive autocorrelation)
Event 28: Low Vol Continuation Risk
Zv ≤ -ZH
Direction: Follows price direction (trend likely continues)
Event 29: Speculation Continuation
Zv ≥ ZH AND |ZΔ| ≥ ZM AND sign(ZΔ) = dirP AND dirP ≠ 0
Direction: Follows price direction
Event 30: Risk Sharing Reversal
Zv ≥ ZH AND |ZΔ| ≤ Z0
Direction: Warning (potential reversal)
─────────────────────────────────────────────────────────────
CATEGORY F: IMBALANCE LAG (Events 31-33)
Based on: Chordia, Roll, Subrahmanyam (2002)
─────────────────────────────────────────────────────────────
Event 31: Persistent Imbalance Push
|ZΔ| ≥ ZM AND |ZΔ | ≥ ZM AND sign(ZΔ) = sign(ZΔ )
Direction: Follows delta direction (persistent pressure)
Event 32: Imbalance Pressure Decay
(ZΔ ≥ ZM AND ZΔ ≤ -ZM) OR (ZΔ ≤ -ZM AND ZΔ ≥ ZM)
Direction: Warning (imbalance sign flip)
Event 33: Intraday Imbalance Predicts
|ZΔ| ≥ ZM
Direction: Follows delta direction
─────────────────────────────────────────────────────────────
CATEGORY G: SUPPORT/RESISTANCE (Events 34-36)
Based on: Peskir (Manchester)
─────────────────────────────────────────────────────────────
Event 34: SR Barrier Event
|Zp| ≤ Z0 AND Zv ≥ ZH
Direction: Neutral (price stalls with high volume)
Event 35: Volume Backed SR Level
|Zp| ≤ Z0 AND Zv ≥ ZH AND |ZΔ| ≥ ZM
Direction: Follows delta direction
Event 36: Volume Poor SR Level
|Zp| ≤ Z0 AND Zv ≤ -ZM
Direction: Warning (weak S/R without volume)
─────────────────────────────────────────────────────────────
CATEGORY H: EXTENDED ANALYSIS (Events 37-50)
Based on: Extended market microstructure analysis
─────────────────────────────────────────────────────────────
Event 37: Climax Buy
Zbuy ≥ ZH AND Zp ≥ ZH AND Zv ≥ ZH
Direction: Warning (extreme buying exhaustion, potential top)
Event 38: Climax Sell
Zsell ≥ ZH AND Zp ≤ -ZH AND Zv ≥ ZH
Direction: Warning (extreme selling exhaustion, potential bottom)
Event 39: Stealth Accumulation
Zbuy ≥ ZM AND |Zp| ≤ Z0 AND Zv ≤ Z0
Direction: Bullish (quiet buying)
Event 40: Stealth Distribution
Zsell ≥ ZM AND |Zp| ≤ Z0 AND Zv ≤ Z0
Direction: Bearish (quiet selling)
Event 41: Volume Divergence Bull
Zp ≤ -ZM AND Zv ≤ -ZM
Direction: Bullish (price down but volume declining)
Event 42: Volume Divergence Bear
Zp ≥ ZM AND Zv ≤ -ZM
Direction: Bearish (price up but volume declining)
Event 43: Delta Price Alignment
|Zp| ≥ ZM AND |ZΔ| ≥ ZM AND sign(Zp) = sign(ZΔ)
Direction: Follows price direction (strong trend confirmation)
Event 44: Extreme Compression
|Zp| ≤ Z0 AND Zv ≤ -ZH
Direction: Neutral (very low volatility)
Event 45: Volatility Expansion
|Zp| ≥ ZH AND Zv ≥ ZH
Direction: Follows price direction (breakout from compression)
Event 46: Buy Exhaustion
Zbuy ≥ ZH AND Zp ≤ Z0
Direction: Warning (high buy but price fails)
Event 47: Sell Exhaustion
Zsell ≥ ZH AND Zp ≥ -Z0
Direction: Warning (high sell but price holds)
Event 48: Trend Acceleration
|Zp| ≥ ZM AND |Zp| > |Zp | AND Zv ≥ ZM
Direction: Follows price direction (increasing momentum)
Event 49: Trend Deceleration
|Zp| ≥ ZM AND |Zp| < |Zp | AND sign(Zp) = sign(Zp )
Direction: Warning (decreasing momentum)
Event 50: Multi Divergence
(Zp ≥ ZM AND ZΔ ≤ -ZM) OR (Zp ≤ -ZM AND ZΔ ≥ ZM) + |Zp| ≥ ZM AND Zv ≤ -ZM
Direction: Warning (multiple divergence signals)
─────────────────────────────────────────────────────────────
CATEGORY I: TREND-INTEGRATED (Events 51-60)
Based on: Combined price-volume-delta trend analysis
─────────────────────────────────────────────────────────────
Event 51: Trend Breakout Confirmed
|Zp| ≥ ZH AND Zv ≥ ZH AND |ZΔ| ≥ ZM AND sign(ZΔ) = dirP AND dirP ≠ 0
Direction: Follows price direction
Event 52: Trend Support Test
Zp ≥ ZM AND Z0 ≤ Zp < ZM AND ZΔ ≥ Z0
Direction: Bullish (pullback in uptrend)
Event 53: Trend Resistance Test
Zp ≤ -ZM AND -ZM < Zp ≤ -Z0 AND ZΔ ≤ -Z0
Direction: Bearish (rally in downtrend)
Event 54: Trend Reversal Signal
sign(Zp) ≠ sign(Zp ) AND |Zp| ≥ ZM AND |Zp | ≥ ZM
Direction: Follows new price direction (momentum flip)
Event 55: Channel Absorption
|Zp| ≤ Z0 AND Zv ≥ ZH
Direction: Neutral (range-bound with volume)
Event 56: Trend Continuation Volume
|Zp| ≥ ZM AND Zv ≥ ZM AND sign(ZΔ) = dirP AND dirP ≠ 0
Direction: Follows price direction (healthy trend with volume)
Event 57: Trend Exhaustion
|Zp| ≥ ZM AND Zv ≤ -ZM AND |Zp| < |Zp |
Direction: Warning (trend losing steam)
Event 58: Range Breakout Pending
|Zp| ≤ Z0 AND Zv ≤ -ZH AND |ZΔ| ≥ ZM
Direction: Follows delta direction (compression with imbalance)
Event 59: Trend Quality High
|Zp| ≥ ZM AND sign(ZΔ) = dirP AND Zv ≥ Z0 AND dirP ≠ 0
Direction: Follows price direction (strong aligned signals)
Event 60: Trend Quality Low
|Zp| ≥ ZM AND sign(ZΔ) ≠ dirP AND dirP ≠ 0
Direction: Warning (conflicting signals)
━━━━━━━━━━━━━━━━━━━━━━━━━━━━━━━━━━━━━━━━━━━
TREND CHANNEL SYSTEM
The trend channel system is adapted from Smart Trader Episode 03 to provide consistent visual context for price action analysis.
How It Works:
• Divides the chart into blocks based on Z-Score groups
• Calculates OHLC (Open, High, Low, Close) for each block
• Detects Higher Highs/Higher Lows (uptrend) or Lower Highs/Lower Lows (downtrend) patterns
• Draws channel lines connecting block extremes
• Classifies by angle: steep angles indicate trends, flat angles indicate ranges
Channel Classifications:
• UPTREND: Higher highs and higher lows detected
• DOWNTREND: Lower highs and lower lows detected
• RANGE: Channel angle below threshold (default 10 degrees)
Label Information:
• Trend direction (UPTREND/DOWNTREND/RANGE)
• Channel boundary prices
• Distance from current price (absolute and percentage)
• Channel angle in degrees
━━━━━━━━━━━━━━━━━━━━━━━━━━━━━━━━━━━━━━━━━━━
DASHBOARD
The dashboard provides a comprehensive real-time view of all Z-Score metrics and detected events.
Dashboard Sections:
1. Header Row
Displays indicator name and current calculation mode (CLOSED or LIVE).
2. Metric Rows (Price, Total Volume, Buy Volume, Sell Volume, Delta)
Each row displays:
• Value: Current metric value
• Z: Calculated Z-Score
• Visual: Graphical Z-bar showing position relative to mean
• Status: Interpretation (Extreme High, Above Avg, Normal, Below Avg, Extreme Low)
• Upper: Oldest active upper Z-Line in window (Label Mirror)
• Lower: Oldest active lower Z-Line in window (Label Mirror)
3. Event Detection Section
• Count of triggered events out of 60 total scenarios
• Market Bias: Bull/Bear/Neutral percentage with visual bar
• Strongest Event: Highest confidence event currently triggered
• #2 Event: Second highest confidence event
4. Footer
Shows engine type (Geometry/Intrabar), Z-Score period, calculation basis, and number of valid bars.
━━━━━━━━━━━━━━━━━━━━━━━━━━━━━━━━━━━━━━━━━━━
ALERT SYSTEM
The indicator uses native alertcondition() functions, keeping the settings menu clean while providing comprehensive alert options in TradingView's alert dialog.
Available Alert Categories:
• Master Alerts: Any event, Any bullish, Any bearish, Any warning
• Single Event Alerts: Individual alerts for key events (Breakout, Climax, Divergence, etc.)
• Category Alerts: Alerts by event category (Price-Volume, Order-Flow, etc.)
• Confluence Alerts: 2+, 3+, 4+, or 5+ aligned events
• Bias Shift Alerts: 10%, 20%, or 30% shifts in market bias
• High Confidence Alerts: Events with 60%+, 70%+, 80%+, or 90%+ confidence
• Divergence Alerts: Price vs Volume or Price vs Delta divergences
━━━━━━━━━━━━━━━━━━━━━━━━━━━━━━━━━━━━━━━━━━━
DATA ACCURACY AND LIMITATIONS
This indicator is 100% VOLUME-BASED and requires Lower Timeframe (LTF) intrabar data for accurate calculations when using the Intrabar method.
Data Accuracy Levels:
• 1T (Tick): Most accurate, real volume distribution per tick
• 1S (1 Second): Reasonably accurate approximation
• 15S (15 Seconds): Good approximation, longer historical data available
• 1M (1 Minute): Rough approximation, maximum historical data range
Backtest and Replay Limitations:
• Replay mode results may differ from live trading due to data availability
• For longer backtest periods, use higher LTF settings (15S or 1M)
• Not all symbols/exchanges support tick-level data
• Crypto and Forex typically have better LTF data availability than stocks
A Note on Data Access:
Higher TradingView plans provide access to more historical intrabar data, which directly impacts the accuracy of volume-based calculations. More precise volume data leads to more reliable calculations.
━━━━━━━━━━━━━━━━━━━━━━━━━━━━━━━━━━━━━━━━━━━
LANGUAGE SUPPORT (TRI-LINGUAL UI)
This indicator includes a built-in language switch with three interface languages :
• English (EN)
• Türkçe (TR)
• 한국어 (KO)
The selected language updates key interface text such as the Dashboard headers/rows , tooltips , and the Event Engine outputs (event names, category names, and direction labels). Turkish diacritics and Korean Hangul are supported for clean, native readability.
Why only three languages?
Each additional language requires duplicating strings throughout the code, which increases script size/memory usage and compilation time. To keep the indicator optimized and responsive, language options are intentionally limited to three.
━━━━━━━━━━━━━━━━━━━━━━━━━━━━━━━━━━━━━━━━━━━
⚠️ DISCLAIMER
FOR EDUCATIONAL AND RESEARCH PURPOSES ONLY
This indicator is designed as an educational and research tool based on academic market microstructure literature. It is NOT financial advice and should NOT be used as the sole basis for trading decisions.
Important Notices:
• Past performance does not guarantee future results
• All trading involves risk of substantial loss
• The indicator's signals are statistical probabilities, not certainties
• Always conduct your own research and consult qualified financial advisors
• The creator assumes no responsibility for trading losses
Research Sources:
This indicator is built upon peer-reviewed academic research from:
• Journal of Financial and Quantitative Analysis (Cambridge University Press)
• Journal of Finance
• Journal of Financial Econometrics
• MIT Working Papers
• arXiv Financial Mathematics

Whale OBV Hunter [Divergence]ENGLISH:
How it works This indicator automatically compares price action against volume flow (OBV). It hunts for "Divergences".
Normally, if price drops, OBV should drop. If price drops but OBV rises, it means "Whales" are absorbing the selling pressure (Accumulation).
How to use it
Buy Signal (Accumulation):
Look for Green Lines and the label "Whale Accumulation".
Meaning: Price made a lower low, but OBV made a higher low (Bullish Divergence). This is a strong signal for an upward reversal.
Action: Look for a LONG entry.
Sell Signal (Distribution):
Look for Red Lines and the label "Whale Distribution".
Meaning: Price is making higher highs, but OBV is dropping (Bearish Divergence). Smart money is leaving.
Action: Take profits or look for a SHORT entry.
Settings (Lookback):
Default is 5. If you see too much noise (too many signals), increase this number to 10 in the settings to spot only major institutional movements.

Wyckoff Schematic by Kingshuk GhoshThe "Wyckoff Schematic" is a Pine Script indicator that automatically detects and visualizes Wyckoff Method accumulation and distribution patterns in real-time. This professional tool helps traders identify smart money movements, phase transitions, and critical market structure points.
Key Features-
1. Wyckoff Pattern Detection
Auto-detection of all Wyckoff phases (A through E)
Accumulation patterns: SC, AR, Spring, SOS, LPS
Distribution patterns: BC, UTAD, LPSY
Real-time phase identification with color-coded visualization
2. Multi-Timeframe Analysis-
Main chart analysis with customizable lookback period
1M Wave View showing monthly perspective in a compact overlay
Daily data integration for current month analysis
Swing point detection with trend lines
3. Advanced Visualization-
Phase boxes with semi-transparent overlays
Critical event labels with anti-clutter spacing
Horizontal support/resistance lines (dynamic)
Zigzag trend lines for price structure
Comprehensive table showing current status and key events
4. Customizable Parameters-
Adjustable lookback period (20-300 bars)
Configurable volume spike multiplier
Customizable display options (labels, boxes, lines)
Adjustable zigzag sensitivity
Configurable wave view height and swing legs
Display Settings: Event labels, phase boxes, support/resistance lines
Visual Settings: Label size, transparency, offset percentage
Zigzag Settings: High/low length
Wave View Settings: Toggle, height percentage, swing legs
Color Scheme:
Phase A: Red
Phase B: Teal
Phase C: Blue
Phase D: Green
Phase E: Yellow
Bullish: Green
Bearish: Red
Alert System:
Critical event alerts: SC, AR, Spring, SOS, LPS, BC, UTAD, LPSY
Phase transition alerts: Markup phase entry ,Customizable alert conditions
How to Use-
For Beginners:
Apply the indicator to any chart
Enable "Auto-Detect Wyckoff Patterns"
Look for colored phase boxes (A-E)
Watch for critical event labels (SC, AR, Spring, etc.)
Check the table in top-right corner for current status
For Advanced Users:
Adjust lookback period based on trading timeframe
Modify volume multiplier for sensitivity
Customize display to reduce clutter
Use wave view for higher timeframe context
Set alerts for specific Wyckoff events
Unique Selling Points:
Comprehensive Detection: Covers all Wyckoff phases and critical events
Clean Visualization: Anti-overlap labeling, organized display
Multi-Timeframe: Combines current chart with monthly perspective
Educational: Helps learn Wyckoff methodology through visualization
Professional: Suitable for both retail and institutional analysis
Performance Notes:
Uses dynamic requests for multi-timeframe data
Includes max object limits to prevent performance issues
Efficient calculation methods for real-time analysis
Intended Users:
Price action traders
Wyckoff method practitioners
Market structure analysts
Swing traders and position traders
Educational purposes for learning market manipulation patterns
Works best on 4H,Daily,Weekly & Monthly Time frame
Suitable for all markets (stocks, forex, crypto, futures)
Support:
The indicator includes comprehensive tooltips and visual cues to help users understand each Wyckoff event and phase. The table provides quick reference to current market conditions and detected patterns.
This indicator transforms complex Wyckoff methodology into actionable visual signals, making institutional accumulation/distribution patterns accessible to all traders.
Disclaimer: This indicator is for educational purposes only. Always practice proper risk management and combine with your own analysis before making trading decisions. Happy trading.

Fractal Market Geometry [JOAT]
Fractal Market Geometry
Overview
Fractal Market Geometry is an open-source overlay indicator that combines fractal analysis with harmonic pattern detection, Fibonacci retracements and extensions, Elliott Wave concepts, and Wyckoff phase identification. It provides traders with a geometric framework for understanding market structure and identifying potential reversal patterns with multi-factor signal confirmation.
What This Indicator Does
The indicator calculates and displays:
Fractal Detection - Identifies fractal highs and lows using Williams-style pivot analysis with configurable period
Fractal Dimension - Calculates market complexity using range-based dimension estimation
Harmonic Patterns - Detects Gartley, Butterfly, Bat, Crab, Shark, Cypher, and ABCD patterns using Fibonacci ratios
Fibonacci Retracements - Key levels at 38.2%, 50%, and 61.8%
Fibonacci Extensions - Projection level at 161.8%
Elliott Wave Count - Simplified wave counting based on pivot detection (1-5)
Wyckoff Phase - Volume-based phase identification (Accumulation, Markup, Distribution, Neutral)
Golden Spiral Levels - ATR-based support and resistance levels using phi (1.618) ratio
Trend Detection - EMA crossover trend identification (20/50 EMA)
How It Works
Fractal detection uses a configurable period to identify swing points:
detectFractalHigh(simple int period) =>
bool result = true
float centerVal = high
for i = 0 to period - 1
if high >= centerVal or high >= centerVal
result := false
break
Harmonic pattern detection uses Fibonacci ratio analysis between swing points. Each pattern has specific ratio requirements:
Gartley: AB 0.382-0.618, BC 0.382-0.886, CD 1.27-1.618
Butterfly: AB 0.382-0.5, BC 0.382-0.886, CD 1.618-2.24
Bat: AB 0.5-0.618, BC 1.13-1.618, CD 1.618-2.24
Crab: AB 0.382-0.618, BC 0.382-0.886, CD 2.24-3.618
Shark: AB 0.382-0.618, BC 1.13-1.618, CD 1.618-2.24
Cypher: AB 0.382-0.618, BC 1.13-1.414, CD 0.786-0.886
Wyckoff phase detection analyzes volume relative to price movement:
wyckoffPhase(simple int period) =>
float avgVol = ta.sma(volume, period)
float priceChg = ta.change(close, period)
string phase = "NEUTRAL"
if volume > avgVol * 1.5 and math.abs(priceChg) < close * 0.02
phase := "ACCUMULATION"
else if volume > avgVol * 1.5 and math.abs(priceChg) > close * 0.05
phase := "MARKUP"
else if volume < avgVol * 0.7
phase := "DISTRIBUTION"
phase
Signal Generation
Signals use multi-factor confirmation for accuracy:
BUY Signal: Fractal low + Uptrend (EMA20 > EMA50) + RSI 30-55 + Bullish candle + Volume confirmation
SELL Signal: Fractal high + Downtrend (EMA20 < EMA50) + RSI 45-70 + Bearish candle + Volume confirmation
Pattern Detection: Label appears when harmonic pattern completes at current bar
Dashboard Panel (Top-Right)
Dimension - Fractal dimension value (market complexity measure)
Last High - Most recent fractal high price
Last Low - Most recent fractal low price
Pattern - Current harmonic pattern name or NONE
Elliott Wave - Current wave count (Wave 1-5) or OFF
Wyckoff - Current market phase or OFF
Trend - BULLISH, BEARISH, or NEUTRAL based on EMA crossover
Signal - BUY, SELL, or WAIT status
Visual Elements
Fractal Markers - Small triangles at fractal highs (down arrow) and lows (up arrow)
Geometry Lines - Dashed lines connecting the most recent fractal high and low
Fibonacci Levels - Clean horizontal lines at 38.2%, 50%, and 61.8% retracement levels
Fibonacci Extension - Horizontal line at 161.8% extension level
Golden Spiral Levels - Support and resistance lines based on ATR x 1.618
3D Fractal Field - Optional depth layers around swing levels (OFF by default)
Harmonic Pattern Markers - Small diamond shapes when Crab, Shark, or Cypher patterns detected
Pattern Labels - Text label showing pattern name when detected
Signal Labels - BUY/SELL labels on confirmed multi-factor signals
Input Parameters
Fractal Period (default: 5) - Bars on each side for fractal detection
Geometry Depth (default: 3) - Complexity of geometric calculations
Pattern Sensitivity (default: 0.8) - Tolerance for pattern ratio matching
Show Fibonacci Levels (default: true) - Display retracement levels
Show Fibonacci Extensions (default: true) - Display extension level
Elliott Wave Detection (default: true) - Enable wave counting
Wyckoff Analysis (default: true) - Enable phase detection
Golden Spiral Levels (default: true) - Display spiral support/resistance
Show Fractal Points (default: true) - Display fractal markers
Show Geometry Lines (default: true) - Display connecting lines
Show Pattern Labels (default: true) - Display pattern name labels
Show 3D Fractal Field (default: false) - Display depth layers
Show Harmonic Patterns (default: true) - Display pattern markers
Show Buy/Sell Signals (default: true) - Display signal labels
Suggested Use Cases
Identify potential reversal zones using harmonic pattern completion
Use Fibonacci levels for entry, stop-loss, and target planning
Monitor Wyckoff phases for accumulation/distribution awareness
Track Elliott Wave counts for trend structure analysis
Use fractal dimension to gauge market complexity
Wait for multi-factor signal confirmation before entering trades
Timeframe Recommendations
Best on 1H to Daily charts. Lower timeframes produce more fractals but with less significance. Higher timeframes provide stronger levels and more reliable signals.
Limitations
Harmonic pattern detection uses simplified ratio ranges and may not match all textbook definitions
Elliott Wave counting is basic and does not include all wave rules
Wyckoff phase detection is volume-based approximation
Fractal dimension calculation is simplified
Signals require fractal confirmation which has inherent lag equal to the fractal period
Open-Source and Disclaimer
This script is published as open-source under the Mozilla Public License 2.0 for educational purposes. It does not constitute financial advice. Past performance does not guarantee future results. Always use proper risk management.
- Made with passion by officialjackofalltrades

Harmonic Liquidity Waves [JOAT]Harmonic Liquidity Waves
Overview
Harmonic Liquidity Waves is an open-source oscillator indicator that combines multiple volume-based analysis techniques into a unified liquidity flow framework. It integrates VWAP calculations, Chaikin Money Flow (CMF), Money Flow Index (MFI), and Klinger Volume Oscillator (KVO) with custom harmonic wave calculations to provide a comprehensive view of volume dynamics and money flow.
What This Indicator Does
The indicator calculates and displays:
Liquidity Flow - Volume-weighted price movement accumulated over a lookback period
Harmonic Wave - Multi-depth smoothed oscillator derived from liquidity flow
Chaikin Money Flow (CMF) - Classic accumulation/distribution indicator
Money Flow Index (MFI) - Volume-weighted RSI showing buying/selling pressure
Klinger Volume Oscillator (KVO) - Trend-volume relationship indicator
Wave Interference - Combined constructive/destructive wave patterns
Volume Profile POC - Point of Control from simplified volume distribution
How It Works
The core liquidity flow calculation tracks volume-weighted price changes:
calculateLiquidityFlow(series float vol, series float price, simple int period) =>
float priceChange = ta.change(price)
float volumeFlow = vol * math.sign(priceChange)
// Accumulated over period using buffer array
float avgFlow = flowSum / period
avgFlow
The harmonic oscillator applies multi-depth smoothing:
harmonicOscillator(series float flow, simple int depth, simple int period) =>
float harmonic = 0.0
for i = 1 to depth
float wave = ta.ema(flow, period * i) / i
harmonic += wave
harmonic / depth
CMF measures accumulation/distribution using the Money Flow Multiplier:
float mfm = ((close - low) - (high - close)) / (high - low)
float mfv = mfm * vol
float cmf = ta.sum(mfv, period) / ta.sum(vol, period) * 100
Signal Generation
Liquidity shift signals occur when:
Bullish Shift: Smoothed wave crosses above signal line
Bearish Shift: Smoothed wave crosses below signal line
Strong signals require volume indicator confirmation:
Strong Bull: Bullish shift + CMF > 0 + MFI > 50 + KVO > 0
Strong Bear: Bearish shift + CMF < 0 + MFI < 50 + KVO < 0
Divergence detection compares price pivots with liquidity wave pivots to identify potential reversals.
Dashboard Panel (Bottom-Right)
Wave Strength - Normalized wave magnitude
Volume Pressure - Current volume vs average percentage
Flow Direction - BUYING or SELLING based on wave sign
Histogram - Wave minus signal line value
CMF - Chaikin Money Flow reading
MFI - Money Flow Index value (0-100)
KVO - Klinger oscillator value
Vol Confluence - Combined volume indicator score
Signal - Current actionable status
Visual Elements
Liquidity Wave - Main oscillator line
Wave Signal - Smoothed signal line for crossover detection
Wave Histogram - Difference between wave and signal
Wave Interference - Area plot showing combined wave patterns
CMF/KVO/MFI Lines - Individual volume indicator plots
Divergence Labels - BULL DIV / BEAR DIV markers
Shift Markers - Triangles for basic shifts, labels for strong shifts
Input Parameters
Wave Period (default: 21) - Base period for liquidity calculations
Volume Weight (default: 1.5) - Multiplier for volume emphasis
Harmonic Depth (default: 3) - Number of smoothing layers
Smoothing (default: 3) - Final wave smoothing period
Suggested Use Cases
Identify accumulation/distribution phases using CMF and wave direction
Confirm momentum with MFI overbought/oversold readings
Watch for divergences between price and liquidity flow
Use strong signals when multiple volume indicators align
Timeframe Recommendations
Best on 15m to Daily charts. Volume-based indicators require sufficient trading activity for meaningful readings.
Limitations
Volume data quality varies by exchange and instrument
Divergence detection uses pivot-based lookback and may lag
Volume Profile POC is simplified and not a full profile analysis
Open-Source and Disclaimer
This script is published as open-source under the Mozilla Public License 2.0 for educational purposes. It does not constitute financial advice. Past performance does not guarantee future results. Always use proper risk management.
- Made with passion by officialjackofalltrades

Ultimate MACD [captainua]Ultimate MACD - Comprehensive MACD Trading System
Overview
This indicator combines traditional MACD calculations with advanced features including divergence detection, volume analysis, histogram analysis tools, regression forecasting, strong top/bottom detection, and multi-timeframe confirmation to provide a comprehensive MACD-based trading system. The script calculates MACD using configurable moving average types (EMA, SMA, RMA, WMA) and applies various smoothing methods to reduce noise while maintaining responsiveness. The combination of these features creates a multi-layered confirmation system that reduces false signals by requiring alignment across multiple indicators and timeframes.
Core Calculations
MACD Calculation:
The script calculates MACD using the standard formula: MACD Line = Fast MA - Slow MA, Signal Line = Moving Average of MACD Line, Histogram = MACD Line - Signal Line. The default parameters are Fast=12, Slow=26, Signal=9, matching the traditional MACD settings. The script supports four moving average types:
- EMA (Exponential Moving Average): Standard and most responsive, default choice
- SMA (Simple Moving Average): Equal weight to all periods
- RMA (Wilder's Moving Average): Smoother, less responsive
- WMA (Weighted Moving Average): Recent prices weighted more heavily
The price source can be configured as Close (standard), Open, High, Low, HL2, HLC3, or OHLC4. Alternative sources provide different sensitivity characteristics for various trading strategies.
Configuration Presets:
The script includes trading style presets that automatically configure MACD parameters:
- Scalping: Fast/Responsive settings (8,18,6 with minimal smoothing)
- Day Trading: Balanced settings (10,22,7 with minimal smoothing)
- Swing Trading: Standard settings (12,26,9 with moderate smoothing)
- Position Trading: Smooth/Conservative settings (15,35,12 with higher smoothing)
- Custom: Full manual control over all parameters
Histogram Smoothing:
The histogram can be smoothed using EMA to reduce noise and filter minor fluctuations. Smoothing length of 1 = raw histogram (no smoothing), higher values (3-5) = smoother histogram. Increased smoothing reduces noise but may delay signals slightly.
Percentage Mode:
MACD values can be converted to percentage of price (MACD/Close*100) for cross-instrument comparison. This is useful when comparing MACD signals across instruments with different price levels (e.g., BTC vs ETH). The percentage mode normalizes MACD values, making them comparable regardless of instrument price.
MACD Scale Factor:
A scale factor multiplier (default 1.0) allows adjusting MACD display size for better visibility. Use 0.3-0.5 if MACD appears too compressed, or 2.0-3.0 if too small.
Dynamic Overbought/Oversold Levels:
Overbought and oversold levels are calculated dynamically based on MACD's mean and standard deviation over a lookback period. The formula: OB = MACD Mean + (StdDev × OB Multiplier), OS = MACD Mean - (StdDev × OS Multiplier). This adapts to current market conditions, widening in volatile markets and narrowing in calm markets. The lookback period (default 20) controls how quickly the levels adapt: longer periods (30-50) = more stable levels, shorter (10-15) = more responsive.
OB/OS Background Coloring:
Optional background coloring can highlight the entire panel when MACD enters overbought or oversold territory, providing prominent visual indication of extreme conditions. The background colors are drawn on top of the main background to ensure visibility.
Divergence Detection
Regular Divergence:
The script uses the MACD line (not histogram) for divergence detection, which provides more reliable signals. Bullish divergence: Price makes a lower low while MACD line makes a higher low. Bearish divergence: Price makes a higher high while MACD line makes a lower high. Divergences often precede reversals and are powerful reversal signals.
Pivot-Based Divergence:
The divergence detection uses actual pivot points (pivotlow/pivothigh) instead of simple lowest/highest comparisons. This provides more accurate divergence detection by identifying significant pivot lows/highs in both price and MACD line. The pivot-based method compares two recent pivot points: for bullish divergence, price makes a lower low while MACD makes a higher low at the pivot points. This method reduces false divergences by requiring actual pivot points rather than just any low/high within a period.
The pivot lookback parameters (left and right) control how many bars on each side of a pivot are required for confirmation. Higher values = more conservative pivot detection.
Hidden Divergence:
Continuation patterns that signal trend continuation rather than reversal. Bullish hidden divergence: Price makes a higher low but MACD makes a lower low. Bearish hidden divergence: Price makes a lower high but MACD makes a higher high. These patterns indicate the trend is likely to continue in the current direction.
Zero-Line Filter:
The "Don't Touch Zero Line" option ensures divergences occur in proper context: for bullish divergence, MACD must stay below zero; for bearish divergence, MACD must stay above zero. This filters out divergences that occur in neutral zones.
Range Filtering:
Minimum and maximum lookback ranges control the time window between pivots to consider for divergence. This helps filter out divergences that are too close together (noise) or too far apart (less relevant).
Volume Confirmation System
Volume threshold filtering requires current volume to exceed the volume SMA multiplied by the threshold factor. The formula: Volume Confirmed = Volume > (Volume SMA × Threshold). If the threshold is set to 1.0 or lower, volume confirmation is effectively disabled (always returns true). This allows you to use the indicator without volume filtering if desired. Volume confirmation significantly increases divergence and signal reliability.
Volume Climax and Dry-Up Detection:
The script can mark bars with extremely high volume (volume climax) or extremely low volume (volume dry-up). Volume climax indicates potential reversal points or strong momentum continuation. Volume dry-up indicates low participation and may produce unreliable signals. These markers use standard deviation multipliers to identify extreme volume conditions.
Zero-Line Cross Detection
MACD zero-line crosses indicate momentum shifts: above zero = bullish momentum, below zero = bearish momentum. The script includes alert conditions for zero-line crosses with cooldown protection to prevent alert spam. Zero-line crosses can provide early warning signals before MACD crosses the signal line.
Histogram Analysis Tools
Histogram Moving Average:
A moving average applied to the histogram itself helps identify histogram trend direction and acts as a signal line for histogram movements. Supports EMA, SMA, RMA, and WMA types. Useful for identifying when histogram momentum is strengthening or weakening.
Histogram Bollinger Bands:
Bollinger Bands are applied to the MACD histogram instead of price. The calculation: Basis = SMA(Histogram, Period), StdDev = stdev(Histogram, Period), Upper = Basis + (StdDev × Deviation Multiplier), Lower = Basis - (StdDev × Deviation Multiplier). This creates dynamic zones around the histogram that adapt to histogram volatility. When the histogram touches or exceeds the bands, it indicates extreme conditions relative to recent histogram behavior.
Stochastic MACD (StochMACD):
Stochastic MACD applies the Stochastic oscillator formula to the MACD histogram instead of price. This normalizes the histogram to a 0-100 scale, making it easier to identify overbought/oversold conditions on the histogram itself. The calculation: %K = ((Histogram - Lowest Histogram) / (Highest Histogram - Lowest Histogram)) × 100. %K is smoothed, and %D is calculated as the moving average of smoothed %K. Standard thresholds are 80 (overbought) and 20 (oversold).
Regression Forecasting
The script includes advanced regression forecasting that predicts future MACD values using mathematical models. This helps anticipate potential MACD movements and provides forward-looking context for trading decisions.
Regression Types:
- Linear: Simple trend line (y = mx + b) - fastest, works well for steady trends
- Polynomial: Quadratic curve (y = ax² + bx + c) - captures curvature in MACD movement
- Exponential Smoothing: Weighted average with more weight on recent values - responsive to recent changes
- Moving Average: Uses difference between short and long MA to estimate trend - stable and smooth
Forecast Horizon:
Number of bars to forecast ahead (default 5, max 50 for linear/MA, max 20 for polynomial due to performance). Longer horizons predict further ahead but may be less accurate.
Confidence Bands:
Optional upper/lower bands around forecast show prediction uncertainty based on forecast error (standard deviation of prediction vs actual). Wider bands = higher uncertainty. The confidence level multiplier (default 1.5) controls band width.
Forecast Display:
Forecast appears as dotted lines extending forward from current bar, with optional confidence bands. All forecast values respect percentage mode and scale factor settings.
Strong Top/Bottom Signals
The script detects strong recovery from extreme MACD levels, generating "sBottom" and "sTop" signals. These identify significant reversal potential when MACD recovers substantially from overbought/oversold extremes.
Strong Bottom (sBottom):
Triggered when:
1. MACD was at or near its lowest point in the bottom period (default 10 bars)
2. MACD was in or near the oversold zone
3. MACD has recovered by at least the threshold amount (default 0.5) from the lowest point
4. Recovery persists for confirmation bars (default 2 consecutive bars)
5. MACD has moved out of the oversold zone
6. Volume is above average
7. All enabled filters pass
8. Minimum bars have passed since last signal (reset period, default 5 bars)
Strong Top (sTop):
Triggered when:
1. MACD was at or near its highest point in the top period (default 7 bars)
2. MACD was in or near the overbought zone
3. MACD has declined by at least the threshold amount (default 0.5) from the highest point
4. Decline persists for confirmation bars (default 2 consecutive bars)
5. MACD has moved out of the overbought zone
6. Volume is above average
7. All enabled filters pass
8. Minimum bars have passed since last signal (reset period, default 5 bars)
Label Placement:
sTop/sBottom labels appear on the historical bar where the actual extreme occurred (not on current bar), showing the exact MACD value at that extreme. Labels respect the unified distance checking system to prevent overlaps with Buy/Sell Strength labels.
Signal Strength Calculation
The script calculates a composite signal strength score (0-100) based on multiple factors:
- MACD distance from signal line (0-50 points): Larger separation indicates stronger signal
- Volume confirmation (0-15 points): Volume above average adds points
- Secondary timeframe alignment (0-15 points): Higher timeframe agreement adds points
- Distance from zero line (0-20 points): Closer to zero can indicate stronger reversal potential
Higher scores (70+) indicate stronger, more reliable signals. The signal strength is displayed in the statistics table and can be used as a filter to only accept signals above a threshold.
Smart Label Placement System
The script includes an advanced label placement system that tracks MACD extremes and places Buy/Sell Strength labels at optimal locations:
Label Placement Algorithm:
- Labels appear on the current bar at confirmation (not on historical extreme bars), ensuring they're visible when the signal is confirmed
- The system tracks pending signals when MACD enters OB/OS zones or crosses the signal line
- During tracking, the system continuously searches for the true extreme (lowest MACD for buys, highest MACD for sells) within a configurable historical lookback period
- Labels are only finalized when: (1) MACD exits the OB/OS zone, (2) sufficient bars have passed (2x minimum distance), (3) MACD has recovered/declined by a configurable percentage from the extreme (default 15%), and (4) tracking has stopped (no better extreme found)
Label Spacing and Overlap Prevention:
- Minimum Bars Between Labels: Base distance requirement (default 5 bars)
- Label Spacing Multiplier: Scales the base distance (default 1.5x) for better distribution. Higher values = more spacing between labels
- Effective distance = Base Distance × Spacing Multiplier (e.g., 5 × 1.5 = 7.5 bars minimum)
- Unified distance checking prevents overlaps between all label types (Buy Strength, Sell Strength, sTop, sBottom)
Strength-Based Filtering:
- Label Strength Minimum (%): Only labels with strength at or above this threshold are displayed (default 75%)
- When multiple potential labels are close together, the system automatically compares strengths and keeps only the strongest one
- This ensures only the most significant signals are displayed, reducing chart clutter
Zero Line Polarity Enforcement:
- Enforce Zero Line Polarity (default enabled): Ensures labels follow traditional MACD interpretation
- Buy Strength labels only appear when the tracked extreme MACD value was below zero (negative territory)
- Sell Strength labels only appear when the tracked extreme MACD value was above zero (positive territory)
- This prevents counter-intuitive labels (e.g., Buy labels above zero line) and aligns with standard MACD trading principles
Recovery/Decline Confirmation:
- Recovery/Decline Confirm (%): Percent move away from the extreme required before finalizing (default 15%)
- For Buy labels: MACD must recover by at least this percentage from the tracked bottom
- For Sell labels: MACD must decline by at least this percentage from the tracked top
- Higher values = more confirmation required, fewer but more reliable labels
Historical Lookback:
- Historical Lookback for Label Placement: Number of bars to search for true extremes (default 20)
- The system searches within this period to find the actual lowest/highest MACD value
- Higher values analyze more history but may be slower; lower values are faster but may miss some extremes
Cross Quality Score
The script calculates a MACD cross quality score (0-100) that rates crossover quality based on:
- Cross angle (0-50 points): Steeper crosses = stronger signals
- Volume confirmation (0-25 points): Volume above average adds points
- Distance from zero line (0-25 points): Crosses near zero line are stronger
This score helps identify high-quality crossovers and can be used as a filter to only accept signals meeting minimum quality threshold.
Filtering System
Histogram Filter:
Requires histogram to be above zero for buy signals, below zero for sell signals. Ensures momentum alignment before generating signals.
Signal Strength Filter:
Requires minimum signal strength score for signals. Higher threshold = only strongest signals pass. This combines multiple confirmation factors into a single filter.
Cross Quality Filter:
Requires minimum cross quality score for signals. Rates crossover quality based on angle, volume, momentum, and distance from zero. Only signals meeting minimum quality threshold will be generated.
All filters use the pattern: filterResult = not filterEnabled OR conditionMet. This means if a filter is disabled, it always passes (returns true). Filters can be combined, and all must pass for a signal to fire.
Multi-Timeframe Analysis
The script can display MACD from a secondary (higher) timeframe and use it for confirmation. When secondary timeframe confirmation is enabled, signals require the higher timeframe MACD to align (bullish/bearish) with the signal direction. This ensures signals align with the larger trend context, reducing counter-trend trades.
Secondary Timeframe MACD:
The secondary timeframe MACD uses the same calculation parameters (fast, slow, signal, MA type) as the main MACD but from a higher timeframe. This provides context for the current timeframe's MACD position relative to the larger trend. The secondary MACD lines are displayed on the chart when enabled.
Noise Filtering
Noise filtering hides small histogram movements below a threshold. This helps focus on significant moves and reduces chart clutter. When enabled, only histogram movements above the threshold are displayed. Typical threshold values are 0.1-0.5 for most instruments, depending on the instrument's price range and volatility.
Signal Debounce
Signal debounce prevents duplicate MACD cross signals within a short time period. Useful when MACD crosses back and forth quickly, creating multiple signals. Debounce ensures only one signal per period, reducing signal spam during choppy markets. This is separate from alert cooldown, which applies to all alert types.
Background Color Modes
The script offers three background color modes:
- Dynamic: Full MACD heatmap based on OB/OS conditions, confidence, and momentum. Provides rich visual feedback.
- Monotone: Soft neutral background but still allows overlays (OB/OS zones). Keeps the chart clean without overpowering candles.
- Off: No MACD background (only overlays and plots). Maximum chart cleanliness.
When OB/OS background colors are enabled, they are drawn on top of the main background to ensure visibility.
Statistics Table
A real-time statistics table displays current MACD values, signal strength, distance from zero line, secondary timeframe alignment, volume confirmation status, and all active filter statuses. The table dynamically adjusts to show only enabled features, keeping it clean and relevant. The table position can be configured (Top Left, Top Right, Bottom Left, Bottom Right).
Performance Statistics Table
An optional performance statistics table shows comprehensive filter diagnostics:
- Total buy/sell signals (raw crossover count before filters)
- Filtered buy/sell signals (signals that passed all filters)
- Overall pass rates (percentage of signals that passed filters)
- Rejected signals count
- Filter-by-filter rejection diagnostics showing which filters rejected how many signals
This table helps optimize filter settings by showing which filters are most restrictive and how they impact signal frequency. The diagnostics format shows rejections as "X B / Y S" (X buy signals rejected, Y sell signals rejected) or "Disabled" if the filter is not active.
Alert System
The script includes separate alert conditions for each signal type:
- MACD Cross: MACD line crosses above/below Signal line (with or without secondary confirmation)
- Zero-Line Cross: MACD crosses above/below zero
- Divergence: Regular and hidden divergence detections
- Secondary Timeframe: Higher timeframe MACD crosses
- Histogram MA Cross: Histogram crosses above/below its moving average
- Histogram Zero Cross: Histogram crosses above/below zero
- StochMACD: StochMACD overbought/oversold entries and %K/%D crosses
- Histogram BB: Histogram touches/breaks Bollinger Bands
- Volume Events: Volume climax and dry-up detections
- OB/OS: MACD entry/exit from overbought/oversold zones
- Strong Top/Bottom: sTop and sBottom signal detections
Each alert type has its own cooldown system to prevent alert spam. The cooldown requires a minimum number of bars between alerts of the same type, reducing duplicate alerts during volatile periods. Alert types can be filtered to only evaluate specific alert types (All, MACD Cross, Zero Line, Divergence, Secondary Timeframe, Histogram MA, Histogram Zero, StochMACD, Histogram BB, Volume Events, OB/OS, Strong Top/Bottom).
How Components Work Together
MACD crossovers provide the primary signal when the MACD line crosses the Signal line. Zero-line crosses indicate momentum shifts and can provide early warning signals. Divergences identify potential reversals before they occur.
Volume confirmation ensures signals occur with sufficient market participation, filtering out low-volume false breakouts. Histogram analysis tools (MA, Bollinger Bands, StochMACD) provide additional context for signal reliability and identify significant histogram zones.
Signal strength combines multiple confirmation factors into a single score, making it easy to filter for only the strongest signals. Cross quality score rates crossover quality to identify high-quality setups. Multi-timeframe confirmation ensures signals align with higher timeframe trends, reducing counter-trend trades.
Usage Instructions
Getting Started:
The default configuration shows MACD(12,26,9) with standard EMA calculations. Start with default settings and observe behavior, then customize settings to match your trading style. You can use configuration presets for quick setup based on your trading style.
Customizing MACD Parameters:
Adjust Fast Length (default 12), Slow Length (default 26), and Signal Length (default 9) based on your trading timeframe. Shorter periods (8,17,7) for faster signals, longer (15,30,12) for smoother signals. You can change the moving average type: EMA for responsiveness, RMA for smoothness, WMA for recent price emphasis.
Price Source Selection:
Choose Close (standard), or alternative sources (HL2, HLC3, OHLC4) for different sensitivity. HL2 uses the midpoint of the high-low range, HLC3 and OHLC4 incorporate more price information.
Histogram Smoothing:
Set smoothing to 1 for raw histogram (no smoothing), or increase (3-5) for smoother histogram that reduces noise. Higher smoothing reduces false signals but may delay signals slightly.
Percentage Mode:
Enable percentage mode when comparing MACD across instruments with different price levels. This normalizes MACD values, making them directly comparable.
Dynamic OB/OS Levels:
The dynamic thresholds automatically adapt to volatility. Adjust the multipliers (default 1.5) to fine-tune sensitivity: higher values (2.0-3.0) = more extreme thresholds (fewer signals), lower (1.0-1.5) = more frequent signals. Adjust the lookback period to control how quickly levels adapt. Enable OB/OS background colors for visual indication of extreme conditions.
Volume Confirmation:
Set volume threshold to 1.0 (default, effectively disabled) or higher (1.2-1.5) for standard confirmation. Higher values require more volume for confirmation. Set to 0.1 to completely disable volume filtering.
Filters:
Enable filters gradually to find your preferred balance. Start with histogram filter for basic momentum alignment, then add signal strength filter (threshold 50+) for moderate signals, then cross quality filter (threshold 50+) for high-quality crossovers. Combine filters for highest-quality signals but expect fewer signals.
Divergence:
Enable divergence detection and adjust pivot lookback parameters. Pivot-based divergence provides more accurate detection using actual pivot points. Hidden divergence is useful for trend-following strategies. Adjust range parameters to filter divergences by time window.
Zero-Line Crosses:
Zero-line cross alerts are automatically available when alerts are enabled. These provide early warning signals for momentum shifts.
Histogram Analysis Tools:
Enable Histogram Moving Average to see histogram trend direction. Enable Histogram Bollinger Bands to identify extreme histogram zones. Enable Stochastic MACD to normalize histogram to 0-100 scale for overbought/oversold identification.
Multi-Timeframe:
Enable secondary timeframe MACD to see higher timeframe context. Enable secondary confirmation to require higher timeframe alignment for signals.
Signal Strength:
Signal strength is automatically calculated and displayed in the statistics table. Use signal strength filter to only accept signals above a threshold (e.g., 50 for moderate, 70+ for strong signals only).
Smart Label Placement:
Configure label placement settings to control label appearance and quality:
- Label Strength Minimum (%): Set threshold (default 75%) to show only strong signals. Higher = fewer, stronger labels
- Label Spacing Multiplier: Adjust spacing (default 1.5x) for better distribution. Higher = more spacing between labels
- Recovery/Decline Confirm (%): Set confirmation requirement (default 15%). Higher = more confirmation, fewer labels
- Enforce Zero Line Polarity: Enable (default) to ensure Buy labels only appear when tracked extreme was below zero, Sell labels only when above zero
- Historical Lookback: Adjust search period (default 20 bars) for finding true extremes. Higher = more history analyzed
Cross Quality:
Cross quality score is automatically calculated for crossovers. Use cross quality filter to only accept high-quality crossovers (threshold 50+ for moderate, 70+ for high quality).
Alerts:
Set up alerts for your preferred signal types. Enable alert cooldown (default enabled, 5 bars) to prevent alert spam. Use alert type filter to only evaluate specific alert types (All, MACD Cross, Zero Line, Divergence, Secondary Timeframe, Histogram MA, Histogram Zero, StochMACD, Histogram BB, Volume Events, OB/OS, Strong Top/Bottom). Each signal type has its own alert condition, so you can be selective about which signals trigger alerts.
Visual Elements and Signal Markers
The script uses various visual markers to indicate signals and conditions:
- MACD Line: Green when above signal (bullish), red when below (bearish) if dynamic colors enabled. Optional black outline for enhanced visibility
- Signal Line: Orange line with optional black outline for enhanced visibility
- Histogram: Color-coded based on direction and momentum (green for bullish rising, lime for bullish falling, red for bearish falling, orange for bearish rising)
- Zero Line: Horizontal reference line at MACD = 0
- Fill to Zero: Green/red semi-transparent fill between MACD line and zero line showing bullish/bearish territory
- Fill Between OB/OS: Blue semi-transparent fill between overbought/oversold thresholds highlighting neutral zone
- OB/OS Background Colors: Background coloring when MACD enters overbought/oversold zones
- Background Colors: Dynamic or monotone backgrounds indicating MACD state, or custom chart background
- Divergence Labels: "🐂" for bullish, "🐻" for bearish, "H Bull" for hidden bullish, "H Bear" for hidden bearish
- Divergence Lines: Colored lines connecting pivot points when divergences are detected
- Volume Climax Markers: ⚡ symbol for extremely high volume
- Volume Dry-Up Markers: 💧 symbol for extremely low volume
- Buy/Sell Strength Labels: Show signal strength percentage (e.g., "Buy Strength: 75%")
- Strong Top/Bottom Labels: "sTop" and "sBottom" for extreme level recoveries
- Secondary MACD Lines: Purple lines showing higher timeframe MACD
- Histogram MA: Orange line showing histogram moving average
- Histogram BB: Blue bands around histogram showing extreme zones
- StochMACD Lines: %K and %D lines with overbought/oversold thresholds
- Regression Forecast: Dotted blue lines extending forward with optional confidence bands
Signal Priority and Interpretation
Signals are generated independently and can occur simultaneously. Higher-priority signals generally indicate stronger setups:
1. MACD Cross with Multiple Filters - Highest priority: Requires MACD crossover plus all enabled filters (histogram, signal strength, cross quality) and secondary timeframe confirmation if enabled. These are the most reliable signals.
2. Zero-Line Cross - High priority: Indicates momentum shift. Can provide early warning signals before MACD crosses the signal line.
3. Divergence Signals - Medium-High priority: Pivot-based divergence is more reliable than simple divergence. Hidden divergence indicates continuation rather than reversal.
4. MACD Cross with Basic Filters - Medium priority: MACD crosses signal line with basic histogram filter. Less reliable alone but useful when combined with other confirmations.
Best practice: Wait for multiple confirmations. For example, a MACD crossover combined with divergence, volume confirmation, and secondary timeframe alignment provides the strongest setup.
Chart Requirements
For proper script functionality and compliance with TradingView requirements, ensure your chart displays:
- Symbol name: The trading pair or instrument name should be visible
- Timeframe: The chart timeframe should be clearly displayed
- Script name: "Ultimate MACD " should be visible in the indicator title
These elements help traders understand what they're viewing and ensure proper script identification. The script automatically includes this information in the indicator title and chart labels.
Performance Considerations
The script is optimized for performance:
- Calculations use efficient Pine Script functions (ta.ema, ta.sma, etc.) which are optimized by TradingView
- Conditional execution: Features only calculate when enabled
- Label management: Old labels are automatically deleted to prevent accumulation
- Array management: Divergence label arrays are limited to prevent memory accumulation
The script should perform well on all timeframes. On very long historical data with many enabled features, performance may be slightly slower, but it remains usable.
Known Limitations and Considerations
- Dynamic OB/OS levels can vary significantly based on recent MACD volatility. In very volatile markets, levels may be wider; in calm markets, they may be narrower.
- Volume confirmation requires sufficient historical volume data. On new instruments or very short timeframes, volume calculations may be less reliable.
- Higher timeframe MACD uses request.security() which may have slight delays on some data feeds.
- Stochastic MACD requires the histogram to have sufficient history. Very short periods on new charts may produce less reliable StochMACD values initially.
- Divergence detection requires sufficient historical data to identify pivot points. Very short lookback periods may produce false positives.
Practical Use Cases
The indicator can be configured for different trading styles and timeframes:
Swing Trading:
Use MACD(12,26,9) with secondary timeframe confirmation. Enable divergence detection. Use signal strength filter (threshold 50+) and cross quality filter (threshold 50+) for higher-quality signals. Enable histogram analysis tools for additional context.
Day Trading:
Use MACD(8,17,7) or use "Day Trading" preset with minimal histogram smoothing for faster signals. Enable zero-line cross alerts for early signals. Use volume confirmation with threshold 1.2-1.5. Enable histogram MA for momentum tracking.
Trend Following:
Use MACD(12,26,9) or longer periods (15,30,12) for smoother signals. Enable secondary timeframe confirmation for trend alignment. Hidden divergence signals are useful for trend continuation entries. Use cross quality filter to identify high-quality crossovers.
Reversal Trading:
Focus on divergence detection (pivot-based for accuracy) combined with zero-line crosses. Enable volume confirmation. Use histogram Bollinger Bands to identify extreme histogram zones. Enable StochMACD for overbought/oversold identification.
Multi-Timeframe Analysis:
Enable secondary timeframe MACD to see context from larger timeframes. For example, use daily MACD on hourly charts to understand the larger trend context. Enable secondary confirmation to require higher timeframe alignment for signals.
Practical Tips and Best Practices
Getting Started:
Start with default settings and observe MACD behavior. The default configuration (MACD 12,26,9 with EMA) is balanced and works well across different markets. After observing behavior, customize settings to match your trading style. Consider using configuration presets for quick setup.
Reducing Repainting:
All signals are based on confirmed bars, minimizing repainting. The script uses confirmed bar data for all calculations to ensure backtesting accuracy.
Signal Quality:
MACD crosses with multiple filters provide the highest-quality signals because they require alignment across multiple indicators. These signals have lower frequency but higher reliability. Use signal strength scores to identify the strongest signals (70+). Use cross quality scores to identify high-quality crossovers (70+).
Filter Combinations:
Start with histogram filter for basic momentum alignment, then add signal strength filter for moderate signals, then cross quality filter for high-quality crossovers. Combining all filters significantly reduces false signals but also reduces signal frequency. Find your balance based on your risk tolerance.
Volume Filtering:
Set volume threshold to 1.0 (default, effectively disabled) or lower to effectively disable volume filtering if you trade instruments with unreliable volume data or want to test without volume confirmation. Standard confirmation uses 1.2-1.5 threshold.
MACD Period Selection:
Standard MACD(12,26,9) provides balanced signals suitable for most trading. Shorter periods (8,17,7) for faster signals, longer (15,30,12) for smoother signals. Adjust based on your timeframe and trading style. Consider using configuration presets for optimized settings.
Moving Average Type:
EMA provides balanced responsiveness with smoothness. RMA is smoother and less responsive. WMA gives more weight to recent prices. SMA gives equal weight to all periods. Choose based on your preference for responsiveness vs. smoothness.
Divergence:
Pivot-based divergence is more reliable than simple divergence because it uses actual pivot points. Hidden divergence indicates continuation rather than reversal, useful for trend-following strategies. Adjust pivot lookback parameters to control sensitivity.
Dynamic Thresholds:
Dynamic OB/OS thresholds automatically adapt to volatility. In volatile markets, thresholds widen; in calm markets, they narrow. Adjust the multipliers to fine-tune sensitivity. Enable OB/OS background colors for visual indication.
Zero-Line Crosses:
Zero-line crosses indicate momentum shifts and can provide early warning signals before MACD crosses the signal line. Enable alerts for zero-line crosses to catch these early signals.
Alert Management:
Enable alert cooldown (default enabled, 5 bars) to prevent alert spam. Use alert type filter to only evaluate specific alert types. Signal debounce (default enabled, 3 bars) prevents duplicate MACD cross signals during choppy markets.
Technical Specifications
- Pine Script Version: v6
- Indicator Type: Non-overlay (displays in separate panel below price chart)
- Repainting Behavior: Minimal - all signals are based on confirmed bars, ensuring accurate backtesting results
- Performance: Optimized with conditional execution. Features only calculate when enabled.
- Compatibility: Works on all timeframes (1 minute to 1 month) and all instruments (stocks, forex, crypto, futures, etc.)
- Edge Case Handling: All calculations include safety checks for division by zero, NA values, and boundary conditions. Alert cooldowns and signal debounce handle edge cases where conditions never occurred or values are NA.
Technical Notes
- All MACD values respect percentage mode conversion when enabled
- Volume confirmation uses cached volume SMA for performance
- Label arrays (divergence) are automatically limited to prevent memory accumulation
- Background coloring: OB/OS backgrounds are drawn on top of main background to ensure visibility
- All calculations are optimized with conditional execution - features only calculate when enabled (performance optimization)
- Signal strength calculation combines multiple factors into a single score for easy filtering
- Cross quality calculation rates crossover quality based on angle, volume, and distance from zero
- Secondary timeframe MACD uses request.security() for higher timeframe data access
- Histogram analysis features (Bollinger Bands, MA, StochMACD) provide additional context beyond basic MACD signals
- Statistics table dynamically adjusts to show only enabled features, keeping it clean and relevant
- Divergence detection uses MACD line (not histogram) for more reliable signals
- Configuration presets automatically optimize MACD parameters for different trading styles
- Smart label placement: Labels appear on current bar at confirmation, using strength from tracked extreme point
- Label spacing uses effective distance (base distance × spacing multiplier) for better distribution
- Zero line polarity enforcement ensures Buy labels only appear when tracked extreme MACD < 0, Sell labels only when tracked extreme MACD > 0
- Label finalization requires MACD exit from OB/OS zone, sufficient bars passed, and recovery/decline percentage confirmation
- Strength-based filtering automatically compares and keeps only the strongest label when multiple signals are close together
- Enhanced visualization: Line outlines drawn behind main lines for superior visibility (black default, configurable)
- Enhanced visualization: Fill between MACD and zero line provides instant visual feedback (green above, red below)
- Enhanced visualization: Fill between OB/OS thresholds highlights neutral zone when dynamic levels are active
- Custom chart background overrides background mode when enabled, allowing theme-consistent indicator panels

CandelaCharts - Composite Pressure Index 📝 Overview
The CandelaCharts – Composite Pressure Index (CPI) is a multi-factor oscillator that blends RSI , Money Flow Index (MFI) , and Chaikin Money Flow (CMF) into a single, stretchable “pressure” line. Instead of looking at three separate indicators, CPI compresses price momentum and volume flow into one normalized curve around 0 , then amplifies extremes using a rolling z-score .
The result is a dynamic gauge of buying vs. selling pressure that can travel beyond ±1 during strong regime shifts, helping you spot exhaustion, climaxes, and trend-strength phases more intuitively.
📦 Features
Composite pressure engine – Combines RSI, MFI, and CMF into a single normalized oscillator around 0, giving you a unified view of market pressure.
Custom weighting of components – Independently weight RSI, MFI, and CMF to prioritize pure price momentum or volume-driven signals.
Rolling z-score stretch – Uses a configurable z-score window to “stretch” the composite values, letting the line exceed ±1 during extremes instead of staying capped.
Adaptive amplitude control – An amplitude (gain) factor lets you scale how aggressive or subtle the CPI swings appear.
EMA smoothing – Optional smoothing removes noise while preserving the timing of swings and reversals.
Visual pressure band – Zero, +1, and -1 reference lines with a shaded band make it easy to see when pressure is “normal” vs. extended.
Dynamic color gradients – Warm/orange tones above 0 for bullish pressure and cool/blue tones below 0 for bearish pressure, with saturation increasing as pressure intensifies.
NA-safe statistics – Custom mean and standard deviation routines ensure stable behavior from the start of the chart and during partial history.
⚙️ Settings
RSI Length : Lookback length for RSI . Higher values smooth the RSI component; lower values make it more reactive to short-term price momentum.
MFI Length : Lookback length for the manual Money Flow Index . Adjust this to control how sensitive CPI is to price–volume interaction.
CMF Length : Lookback length for Chaikin Money Flow . This defines the window used to assess accumulation/distribution through volume flow.
RSI Weight : Relative importance of RSI within the composite. Increasing this emphasizes pure price momentum in the CPI.
MFI Weight : Relative importance of MFI. Higher values strengthen the influence of volume-weighted price moves.
CMF Weight : Relative importance of CMF. Raising this highlights accumulation/distribution as a driver of the pressure index.
Smoothing : EMA length applied to the stretched CPI line. A value of 1 effectively disables smoothing, while higher values reduce noise at the cost of a slight lag.
Z-score Window : Rolling window used to compute the mean and standard deviation of the raw composite. This defines the statistical context for what counts as “extreme”. Shorter windows adapt faster; longer windows give a more stable regime.
Amplitude : Gain factor applied to the z-scored composite. Values above 1.0 exaggerate swings and make extremes more visually pronounced; values below 1.0 compress them.
⚡️ Showcase
Composite Pressure Index
Mean Line
Divergences
📒 Usage
1. Identify directional pressure regimes
Use 0 as the key balance line:
CPI > 0 → Net bullish pressure (buyers in control).
CPI < 0 → Net bearish pressure (sellers in control).
You can treat prolonged stays above or below 0 as confirmations of trend direction, especially when price structure agrees.
2. Read statistical extremes instead of fixed levels
Because CPI is stretched via a z-score , values beyond ±1 typically represent statistically meaningful extremes within your chosen window:
CPI > +1 → Overextended bullish pressure / potential euphoria.
CPI < -1 → Overextended bearish pressure / potential capitulation.
These zones are not automatic reversal signals, but they highlight areas where monitoring for exhaustion, blow-offs, or risk-reward shifts can be beneficial.
3. Spot divergences with price
Classic divergence logic applies particularly well when pressure is composite:
Bearish divergence – Price makes higher highs, but CPI makes lower highs or fails to confirm.
Bullish divergence – Price makes lower lows, but CPI makes higher lows or shows less downside extension.
These patterns can be integrated with support/resistance, liquidity levels, and other CandelaCharts tools.
4. Tune the weights to your strategy
Adjust the three weights to match your focus:
Higher RSI weight → More sensitivity to pure price momentum (good for breakout or trend-following systems).
Higher MFI weight → Greater emphasis on price–volume interaction (ideal for spotting volume-confirmed moves).
Higher CMF weight → Stronger focus on accumulation/distribution (helpful for swing and position traders).
5. Integrate with existing setups
The CPI is designed to sit comfortably below price:
Use it as a “context” oscillator underneath your main price-action and liquidity models.
Combine CPI extremes and divergences with key levels, range models, or order flow signals for higher-confluence entries.
🚨 Alerts
The indicator does not provide any alerts!
⚠️ Disclaimer
Trading involves significant risk, and many participants may incur losses. The content on this site is not intended as financial advice and should not be interpreted as such. Decisions to buy, sell, hold, or trade securities, commodities, or other financial instruments carry inherent risks and are best made with guidance from qualified financial professionals. Past performance is not indicative of future results.

Buy / Sell Volume + % (Classic + Pressure)Buy / Sell Volume % (Classic + Pressure)
Overview
Buy / Sell Volume (Classic + Pressure) is a volume decomposition and dominance indicator designed to help traders understand how trading volume is distributed between buying and selling pressure on each candle.
Instead of treating volume as a single number, this indicator splits total volume into estimated Buy Volume and Sell Volume, visualizes them symmetrically, and summarizes dominance using a compact on-chart dashboard.
The indicator is intended as a context and confirmation tool, not a trade signal generator.
Core Concepts
1. Buy / Sell Volume Decomposition
The indicator estimates buying and selling activity based on the position of the close within the candle’s high–low range:
Closes near the high → more buying pressure
Closes near the low → more selling pressure
Middle closes → balanced activity
This provides a clear visual view of demand vs supply on every bar.
2. Dual Calculation Modes
🔹 Classic Mode (Default)
Uses pure candle-range logic
Buy Volume + Sell Volume = Total Volume (exact conservation)
No smoothing or directional bias
Values closely match traditional volume behavior
Best for:
Structural analysis
Accumulation / distribution studies
Comparing against raw volume
🔹 Pressure Mode
Introduces a directional bias:
Bullish candles slightly favor buy volume
Bearish candles slightly favor sell volume
Optional EMA smoothing reduces noise
Still volume-conserving (Buy + Sell = Total Volume)
Best for:
Identifying dominance
Trend continuation confirmation
Absorption vs initiative activity
Visual Elements
Volume Bars
Buy Volume plotted above zero
Sell Volume plotted below zero
Optional Total Volume Envelope for context
Color by Dominance
Bright colors when one side dominates
Faded colors when dominance is weak
Helps instantly identify:
Accumulation
Distribution
Absorption
Dashboard (Optional)
A compact dashboard displays:
Buy %
Sell %
Dominance State
BUY DOM
SELL DOM
BALANCED
The dashboard can be toggled ON/OFF and switched between Normal and Compact size to suit multi-pane layouts.
How to Use This Indicator
This indicator works best as a confirmation layer, not a standalone system.
Common Use Cases
Confirming breakouts or breakdowns
Spotting accumulation or distribution near key levels
Identifying absorption during consolidations
Filtering false price moves
Examples
Price rising + strong Buy % → constructive demand
Price rising + strong Sell % → possible distribution
Flat price + balanced volume → absorption / compression
What This Indicator Is NOT
❌ Not true order-flow or bid/ask data
❌ Not a buy/sell signal generator
❌ Not predictive on its own
All calculations are candle-based estimations, designed for context and insight, not execution timing.
Best Use
Works on all timeframes
Most reliable on liquid instruments
Especially useful when combined with:
Support / resistance
Trend structure
Market regime or breadth indicators
Summary
Buy / Sell Volume (Classic + Pressure) helps traders go beyond raw volume by visualizing who is in control of each candle, how strong that control is, and whether volume behavior supports price action.
Used correctly, it can significantly improve trade selectivity, confidence, and risk awareness.

Short-Term Bubble Risk [Phantom] Short-Term Bubble Risk
Concept
This indicator visualizes short-term market risk by measuring how far price is stretched relative to its recent weekly trend.
Instead of focusing on absolute price levels, it looks at price behavior.
A similar reading means similar market conditions, whether price is high or low.
The goal is to help identify areas of potential accumulation and potential distribution in a clear, visual way.
How It Works
The indicator compares the weekly closing price to a weekly moving average and displays the deviation as a histogram.
When price is far below its average, risk is considered lower
When price is far above its average, risk is considered higher
The zero line represents fair value, where price equals its weekly average.
Features
Color-coded histogram showing short-term risk levels
Designed to work across different assets and price ranges
Optional bar coloring on the main chart using weekly risk data
Safe to use on any timeframe (risk is calculated on weekly data)
Settings
# Moving Average Length (Weeks):
Adjusts how sensitive the indicator is to price changes
# Color Visibility Toggles:
Allows hiding or showing specific risk zones
# Bar Coloring:
Option to color chart candles based on weekly risk levels
Usage
This indicator is best used as a risk lens, not a timing tool.
Common uses include:
Identifying potential accumulation zones during weakness
Spotting overextended conditions during strong moves
Comparing short-term risk across different assets
Adding context to trend-following or DCA strategies
Trade Ideas
# Lower-risk zones (cool colors):
Can support accumulation or patience during downtrends
# Higher-risk zones (warm colors):
Can signal caution, reduced exposure, or profit-taking
Always combine with:
Trend direction
Market structure
Higher-timeframe context
Limitations
This indicator does not predict tops or bottoms
High risk can remain high during strong trends
Low risk does not guarantee immediate reversals
It should not be used as a standalone trading system.
Disclaimer
This indicator is for educational and informational purposes only.
It is not financial advice.
Always do your own research and manage risk appropriately.

ALT Risk Metric StrategyHere's a professional write-up for your ALT Risk Strategy script:
ALT/BTC Risk Strategy - Multi-Crypto DCA with Bitcoin Correlation Analysis
Overview
This strategy uses Bitcoin correlation as a risk indicator to time entries and exits for altcoins. By analyzing how your chosen altcoin performs relative to Bitcoin, the strategy identifies optimal accumulation periods (when alt/BTC is oversold) and profit-taking opportunities (when alt/BTC is overbought). Perfect for traders who want to outperform Bitcoin by strategically timing altcoin positions.
Key Innovation: Why Alt/BTC Matters
Most traders focus solely on USD price, but Alt/BTC ratios reveal true altcoin strength:
When Alt/BTC is low → Altcoin is undervalued relative to Bitcoin (buy opportunity)
When Alt/BTC is high → Altcoin has outperformed Bitcoin (take profits)
This approach captures the rotation between BTC and alts that drives crypto cycles
Key Features
📊 Advanced Technical Analysis
RSI (60% weight): Primary momentum indicator on weekly timeframe
Long-term MA Deviation (35% weight): Measures distance from 150-period baseline
MACD (5% weight): Minor confirmation signal
EMA Smoothing: Filters noise while maintaining responsiveness
All calculations performed on Alt/BTC pairs for superior market timing
💰 3-Tier DCA System
Level 1 (Risk ≤ 70): Conservative entry, base allocation
Level 2 (Risk ≤ 50): Increased allocation, strong opportunity
Level 3 (Risk ≤ 30): Maximum allocation, extreme undervaluation
Continuous buying: Executes every bar while below threshold for true DCA behavior
Cumulative sizing: L3 triggers = L1 + L2 + L3 amounts combined
📈 Smart Profit Management
Sequential selling: Must complete L1 before L2, L2 before L3
Percentage-based exits: Sell portions of position, not fixed amounts
Auto-reset on re-entry: New buy signals reset sell progression
Prevents premature full exits during volatile conditions
🤖 3Commas Automation
Pre-configured JSON webhooks for Custom Signal Bots
Multi-exchange support: Binance, Coinbase, Kraken, Bitfinex, Bybit
Flexible quote currency: USD, USDT, or BUSD
Dynamic order sizing: Automatically adjusts to your tier thresholds
Full webhook documentation compliance
🎨 Multi-Asset Support
Pre-configured for popular altcoins:
ETH (Ethereum)
SOL (Solana)
ADA (Cardano)
LINK (Chainlink)
UNI (Uniswap)
XRP (Ripple)
DOGE
RENDER
Custom option for any other crypto
How It Works
Risk Metric Calculation (0-100 scale):
Fetches weekly Alt/BTC price data for stability
Calculates RSI, MACD, and deviation from 150-period MA
Normalizes MACD to 0-100 range using 500-bar lookback
Combines weighted components: (MACD × 0.05) + (RSI × 0.60) + (Deviation × 0.35)
Applies 5-period EMA smoothing for cleaner signals
Color-Coded Risk Zones:
Green (0-30): Extreme buying opportunity - Alt heavily oversold vs BTC
Lime/Yellow (30-70): Accumulation range - favorable risk/reward
Orange (70-85): Caution zone - consider taking initial profits
Red/Maroon (85-100+): Euphoria zone - aggressive profit-taking
Entry Logic:
Buys execute every candle when risk is below threshold
As risk decreases, position sizing automatically scales up
Example: If risk drops from 60→25, you'll be buying at L1 rate until it hits 50, then L2 rate, then L3 rate
Exit Logic:
Sells only trigger when in profit AND risk exceeds thresholds
Sequential execution ensures partial profit-taking
If new buy signal occurs before all sells complete, sell levels reset to L1
Configuration Guide
Choosing Your Altcoin:
Select crypto from dropdown (or use CUSTOM for unlisted coins)
Pick your exchange
Choose quote currency (USD, USDT, BUSD)
Risk Metric Tuning:
Long Term MA (default 150): Higher = more extreme signals, Lower = more frequent
RSI Length (default 10): Lower = more volatile, Higher = smoother
Smoothing (default 5): Increase for less noise, decrease for faster reaction
Buy Settings (Aggressive DCA Example):
L1 Threshold: 70 | Amount: $5
L2 Threshold: 50 | Amount: $6
L3 Threshold: 30 | Amount: $7
Total L3 buy = $18 per candle when deeply oversold
Sell Settings (Balanced Exit Example):
L1: 70 threshold, 25% position
L2: 85 threshold, 35% position
L3: 100 threshold, 40% position (final exit)
3Commas Setup
Bot Configuration:
Create Custom Signal Bot in 3Commas
Set trading pair to your altcoin/USD (e.g., ETH/USD, SOL/USDT)
Order size: Select "Send in webhook, quote" to use strategy's dollar amounts
Copy Bot UUID and Secret Token
Script Configuration:
Paste credentials into 3Commas section inputs
Check "Enable 3Commas Alerts"
Save and apply to chart
TradingView Alert:
Create Alert → Condition: "alert() function calls only"
Webhook URL: api.3commas.io
Enable "Webhook URL" checkbox
Expiration: Open-ended
Strategy Advantages
✅ Outperform Bitcoin: Designed specifically to beat BTC by timing alt rotations
✅ Capture Alt Seasons: Automatically accumulates when alts lag, sells when they pump
✅ Risk-Adjusted Sizing: Buys more when cheaper (better risk/reward)
✅ Emotional Discipline: Systematic approach removes fear and FOMO
✅ Multi-Asset: Run same strategy across multiple altcoins simultaneously
✅ Proven Indicators: Combines RSI, MACD, and MA deviation - battle-tested tools
Backtesting Insights
Optimal Timeframes:
Daily chart: Best for backtesting and signal generation
Weekly data is fetched internally regardless of display timeframe
Historical Performance Characteristics:
Accumulates heavily during bear markets and BTC dominance periods
Captures explosive altcoin rallies when BTC stagnates
Sequential selling preserves capital during extended downtrends
Works best on established altcoins with multi-year history
Risk Considerations:
Requires capital reserves for extended accumulation periods
Some altcoins may never recover if fundamentals deteriorate
Past correlation patterns may not predict future performance
Always size positions according to personal risk tolerance
Visual Interface
Indicator Panel Displays:
Dynamic color line: Green→Lime→Yellow→Orange→Red as risk increases
Horizontal threshold lines: Dashed lines mark your buy/sell levels
Entry/Exit labels: Green labels for buys, Orange/Red/Maroon for sells
Real-time risk value: Numerical display on price scale
Customization:
All threshold lines are adjustable via inputs
Color scheme clearly differentiates buy zones (green spectrum) from sell zones (red spectrum)
Line weights emphasize most extreme thresholds (L3 buy and L3 sell)
Strategy Philosophy
This strategy is built on the principle that altcoins move in cycles relative to Bitcoin. During Bitcoin rallies, alts often bleed against BTC (high sell, accumulate). When Bitcoin consolidates, alts pump (take profits). By measuring risk on the Alt/BTC chart instead of USD price, we time these rotations with precision.
The 3-tier system ensures you're always averaging in at better prices and scaling out at better prices, maximizing your Bitcoin-denominated returns.
Advanced Tips
Multi-Bot Strategy:
Run this on 5-10 different altcoins simultaneously to:
Diversify correlation risk
Capture whichever alt is pumping
Smooth equity curve through rotation
Pairing with BTC Strategy:
Use alongside the BTC DCA Risk Strategy for complete portfolio coverage:
BTC strategy for core holdings
ALT strategies for alpha generation
Rebalance between them based on BTC dominance
Threshold Calibration:
Check 2-3 years of historical data for your chosen alt
Note where risk metric sat during major bottoms (set buy thresholds)
Note where it peaked during euphoria (set sell thresholds)
Adjust for your risk tolerance and holding period
Credits
Strategy Development & 3Commas Integration: Claude AI (Anthropic)
Technical Analysis Framework: RSI, MACD, Moving Average theory
Implementation: pommesUNDwurst
Disclaimer
This strategy is for educational purposes only. Cryptocurrency trading involves substantial risk of loss. Altcoins are especially volatile and many fail completely. The strategy assumes liquid markets and reliable Alt/BTC price data. Always do your own research, understand the fundamentals of any asset you trade, and never risk more than you can afford to lose. Past performance does not guarantee future results. The authors are not financial advisors and assume no liability for trading decisions.
Additional Warning: Using leverage or trading illiquid altcoins amplifies risk significantly. This strategy is designed for spot trading of established cryptocurrencies with deep liquidity.
Tags: Altcoin, Alt/BTC, DCA, Risk Metric, Dollar Cost Averaging, 3Commas, ETH, SOL, Crypto Rotation, Bitcoin Correlation, Automated Trading, Alt Season
Feel free to modify any sections to better match your style or add specific backtesting results you've observed! 🚀Claude is AI and can make mistakes. Please double-check responses. Sonnet 4.5

On Balance Volume [BrightSideTrading]
# On Balance Volume - Complete User Guide
## Overview
This enhanced OBV indicator provides clean, actionable volume analysis with intelligent signal filtering. It combines On-Balance Volume (OBV) with a smoothed signal line to identify shifts in buying and selling pressure without chart clutter.
**Key Features:**
- Real-time OBV and signal line visualization
- Smart crossover detection with confirmation filtering
- Z-Score momentum analysis
- Customizable signal alerts with V-shaped markers
- Window-normalized option for detrended analysis
---
## What is On-Balance Volume (OBV)?
OBV is a volume-based momentum indicator that accumulates volume on up days and subtracts volume on down days. It answers a fundamental question: **Is volume flowing in (buying) or out (selling)?**
**Formula:**
- If Close > Previous Close: OBV = Previous OBV + Volume
- If Close < Previous Close: OBV = Previous OBV - Volume
- If Close = Previous Close: OBV = Previous OBV (unchanged)
**What it tells you:**
- **Rising OBV** = Accumulation (smart money buying)
- **Falling OBV** = Distribution (smart money selling)
- **OBV above zero line** = Net positive buying pressure
- **OBV below zero line** = Net negative selling pressure
---
## Interface & Settings
### **MAIN VISUALIZATION**
**OBV Line (Green/Red Ribbon)**
- Green when OBV is above the signal line (bullish trend)
- Red when OBV is below the signal line (bearish trend)
- Toggles between window-normalized (detrended) and raw values
**Signal Line (Orange)**
- Smoothed average of OBV
- Crossovers with OBV generate buy/sell signals
- Default: 21-period SMA
**V-Shaped Markers**
- Green upward V = Bullish crossover (buy signal)
- Red downward V = Bearish crossover (sell signal)
- Appears at the OBV value when signal is triggered
**Zero Line (Yellow)**
- Center equilibrium point for volume balance
- Acts as support/resistance for OBV
- Separates buying pressure (above) from selling pressure (below)
---
### **SOURCE GROUP**
**Source**
- **Default:** Close
- **Options:** Open, High, Low, or any custom value
- Controls which price value triggers OBV direction changes
- Most traders use Close for standard OBV calculation
---
### **SIGNAL SMOOTHING GROUP**
**Show Signal?**
- **Default:** ON
- Toggle visibility of the signal line
- Disable if you prefer to see raw OBV only
**Smoothing Type**
- **SMA (Simple Moving Average)** - Default, standard smoothing
- **EMA (Exponential Moving Average)** - Faster response, weights recent bars more heavily
- **Choose SMA** for consistent, traditional OBV signals
- **Choose EMA** for faster trend identification (more whipsaws possible)
**Smoothing Length**
- **Default:** 21 bars
- **Range:** 1-200 bars
- **Lower values** (5-14): Faster signals, more noise
- **Higher values** (30-50): Slower signals, fewer false alarms
- **Recommendation:** Use 21-25 for most timeframes
---
### **SIGNAL FILTERING GROUP**
This is your primary control for signal quality and frequency.
**Show Signal Markers?**
- **Default:** ON
- Toggle the V-shaped buy/sell markers on/off
- Disable if markers distract from your analysis
**Signal Filter Type**
- **None** - Shows every single crossover (noisy, best for skilled traders)
- **Confirmation Bars** - Waits N bars before confirming signal (recommended)
- **Strength-Based** - Only signals during strong momentum (filters weakest moves)
#### **CONFIRMATION BARS MODE** (Recommended)
Best for reducing false signals while staying responsive to real moves.
**Confirmation Bars**
- **Default:** 2 bars
- **Range:** 1-10 bars
- Waits for the signal to hold for N consecutive bars after crossover
- **Setting 1:** Every crossover (same as "None")
- **Setting 2:** Wait 1 bar confirmation (good balance)
- **Setting 3:** Wait 2 bars confirmation (filters 50% of noise)
- **Setting 4+:** Very selective, misses quick reversals
**How it works:**
1. OBV crosses signal line → Confirmation counter starts
2. If OBV stays on correct side for 2 bars → V-marker appears
3. If OBV crosses back → Counter resets, no signal
#### **STRENGTH-BASED MODE**
Only signals when momentum is statistically significant.
**Min Z-Score Strength**
- **Default:** 0.3
- **Range:** 0.0-3.0
- Requires OBV deviation from its mean to reach this threshold
- **Setting 0.1-0.3:** More signals, lower quality
- **Setting 0.5-0.8:** Moderate signals, good quality
- **Setting 1.0+:** Only the strongest momentum shifts
**How it works:**
- Calculates how far OBV is from its 50-bar average (Z-score)
- Only shows signals when this distance is meaningful
- Automatically avoids weak, choppy market conditions
---
### **VISUALS & COLORS GROUP**
**Highlight Crossovers?**
- **Default:** ON
- Master toggle for all signal markers
- Turn OFF to see only the OBV/signal lines
**Apply Ribbon Filling?**
- **Default:** ON
- Colors the space between OBV and signal line
- Green fill = OBV above signal (bullish)
- Red fill = OBV below signal (bearish)
- Provides clear visual trend confirmation
- Turn OFF for minimal chart clutter
---
### **STATS & ZONES GROUP**
**Use Window-Normalized OBV (visual only)?**
- **Default:** ON
- Removes long-term trend from OBV for clearer short-term signals
- Detrends the indicator to highlight recent momentum changes
- **ON:** Better for swing trading and identifying reversals
- **OFF:** Better for trend-following strategies
- Note: Z-Score always uses raw OBV for statistical accuracy
**OBV Normalize Window**
- **Default:** 200 bars
- Lookback period for detrending calculation
- Larger values = more aggressive detrending
- Adjust if you want OBV to oscillate more/less around zero
**Show Z-Score (OBV)?**
- **Default:** ON
- Displays statistical momentum indicator below main chart
- Ranges from -3 to +3 (most data within -2 to +2)
- High Z-Score = Strong buying momentum
- Low Z-Score = Strong selling momentum
**Z-Score Lookback**
- **Default:** 50 bars
- Period for calculating Z-Score mean and standard deviation
- Larger = smoother Z-Score, slower response
- Smaller = noisier Z-Score, faster response
**Show ROC (OBV Momentum)?**
- **Default:** OFF
- Rate of Change indicator for OBV velocity
- Useful for identifying momentum turning points
- Enable if you want to see speed of volume changes
**ROC Lookback**
- **Default:** 14 bars
- Period for ROC calculation
**Show Z-Score StdDev Zones?**
- **Default:** ON
- Shaded regions around zero line showing statistical boundaries
- Inner Zone (±1 Z) = Normal variation
- Outer Zone (±2 Z) = Extreme moves, potential reversals
- Helps identify overbought/oversold volume conditions
**Inner Zone (±Z)**
- **Default:** 1.0
- First boundary for standard deviation zones
- Most normal trading occurs within ±1
**Outer Zone (±Z)**
- **Default:** 2.0
- Second boundary for extreme conditions
- Crossing these zones indicates significant momentum shift
---
## Trading Strategy Examples
### **Strategy 1: Signal Line Crossovers (Beginner)**
**Setup:**
- Signal Filter Type: **Confirmation Bars**
- Confirmation Bars: **2-3**
- Show Signal Markers: **ON**
**Rules:**
1. **BUY signal** (green V): When OBV crosses above signal line and holds for 2-3 bars
- Confirms buying pressure is building
- Look for price to follow within 1-3 bars
2. **SELL signal** (red V): When OBV crosses below signal line and holds for 2-3 bars
- Confirms selling pressure is increasing
- Expect price decline
3. **Exit:** Take profits at next signal or use price support/resistance
**Best For:** Swing trading, intraday reversals, timeframes 5m-1h
---
### **Strategy 2: Zero Line Bounce (Intermediate)**
**Setup:**
- Signal Filter Type: **Strength-Based**
- Min Z-Score Strength: **0.5**
- Show Z-Score StdDev Zones: **ON**
**Rules:**
1. **Watch OBV approach zero line** during established trends
- OBV bouncing repeatedly off zero = trend is healthy
- OBV breaking through zero = trend reversal imminent
2. **Enter on bounce:** Buy when OBV bounces from zero line in uptrend
3. **Exit on break:** Close position when OBV breaks below zero line
4. **Confirm with Z-Score:** Only take trades when Z-Score shows momentum (|Z| > 0.5)
**Best For:** Trend traders, identifying trend strength, medium timeframes 15m-4h
---
### **Strategy 3: Momentum Extremes (Advanced)**
**Setup:**
- Signal Filter Type: **None**
- Show Z-Score StdDev Zones: **ON**
- Outer Zone: **2.0**
**Rules:**
1. **Identify extremes:** When Z-Score breaks outer zone (±2.0)
- Indicator is in extreme territory
- Likely overextended
2. **Fade extremes:** Take opposite position when Z-Score hits extreme
- High Z (>2.0) = OBV overbought, expect pullback
- Low Z (<-2.0) = OBV oversold, expect bounce
3. **Confirm:** Wait for crossover signal to enter
4. **Target:** Outer zone of opposite side or zero line
**Best For:** Range trading, mean reversion, experienced traders only
---
## Reading the Indicator in Different Markets
### **Strong Uptrend**
- OBV consistently above signal line (green)
- OBV well above zero line, rising higher lows
- Z-Score positive, trending upward
- **Action:** Buy dips to signal line, sell at resistance
### **Strong Downtrend**
- OBV consistently below signal line (red)
- OBV well below zero line, making lower highs
- Z-Score negative, trending downward
- **Action:** Sell rallies to signal line, cover at support
### **Consolidation/Choppy Market**
- OBV whipsaws around signal line frequently
- Crossovers occur every few bars
- Z-Score oscillating between -1 and +1
- **Action:** Increase confirmation bars to 3-4, or switch to strength-based filter
### **Accumulation (Bottom Formation)**
- OBV rising while price is flat or falling
- Volume flowing in despite downtrend (bullish divergence)
- Z-Score climbing while price lows hold
- **Action:** Expect breakout up; prepare buy near support
### **Distribution (Top Formation)**
- OBV falling while price is flat or rising
- Volume flowing out despite uptrend (bearish divergence)
- Z-Score falling while price continues higher
- **Action:** Expect breakdown down; prepare short near resistance
---
## Parameter Tuning Guide
### **Aggressive Settings (More Signals)**
- Smoothing Length: 14
- Signal Filter: None or Confirmation Bars: 1
- Min Z-Score: 0.1
- Best for: Day trading, high volatility stocks
- Risk: More false signals
### **Balanced Settings (Recommended)**
- Smoothing Length: 21
- Signal Filter: Confirmation Bars: 2
- Min Z-Score: 0.3
- Best for: Swing trading, most market conditions
- Risk/Reward: Moderate
### **Conservative Settings (Fewer Signals)**
- Smoothing Length: 30-40
- Signal Filter: Confirmation Bars: 3-4 or Strength-Based: 0.7+
- Min Z-Score: 0.8
- Best for: Position trading, high-conviction trades only
- Risk: May miss some moves
---
## Common Questions & Troubleshooting
**Q: Why are there more sell signals than buy signals?**
A: This reflects the actual market action. Markets often decline faster than they rise (fear > greed). Confirm signals with price action and support/resistance.
**Q: The indicator keeps whipsawing, should I hide it?**
A: Increase Confirmation Bars to 3-4 or switch to Strength-Based filter. Market conditions matter—choppy markets require stricter filters.
**Q: What's the difference between normalized and raw OBV?**
A: Normalized (detrended) shows shorter-term momentum by removing long-term trends. Raw OBV shows absolute accumulation/distribution over the full period. Use normalized for swing signals, raw for trend confirmation.
**Q: My signals come too late. How do I get faster entry?**
A: Reduce Smoothing Length (try 14 instead of 21), use EMA instead of SMA, or set Confirmation Bars to 1. Trade-off: More false signals.
**Q: Can I use this for day trading?**
A: Yes, on 1m-5m charts with aggressive settings. Use Confirmation Bars: 1 and focus on Z-Score > 0.5 entries only.
**Q: Should I trade every signal?**
A: No. Filter signals using: price near support/resistance, multiple indicators confirming, and Z-Score showing momentum. Best signals occur at key levels.
---
## Best Practices
1. **Always confirm with price action:** OBV signals work best when price is near support, resistance, or moving average. Don't trade signals in a vacuum.
2. **Use volume context:** Check if volume is increasing or decreasing on the signal. Strong signals have volume confirmation (increasing volume on OBV spikes).
3. **Adjust settings per timeframe:**
- 1m-5m: Smoothing 12, Confirmation 1, Z-Score 0.2
- 15m-1h: Smoothing 20, Confirmation 2, Z-Score 0.3
- 4h-1d: Smoothing 25, Confirmation 3, Z-Score 0.5
4. **Watch the zero line:** It's your friend. OBV behavior at the zero line reveals trend strength. Bounces = healthy trend. Breaks = reversal.
5. **Risk management:** No indicator is perfect. Use proper position sizing and stop losses. OBV should confirm your thesis, not be the only reason to trade.
6. **Combine with other indicators:**
- Price moving averages for trend confirmation
- RSI or Stochastic for overbought/oversold levels
- Support/resistance for entry/exit zones
- MACD for momentum divergences
---
## Disclaimer
This indicator is for educational and informational purposes only. It is not financial advice. Past performance does not guarantee future results. Always conduct your own research and consult with a financial advisor before making trading decisions. Trading carries risk, including potential loss of principal.
---
## Version History
**Version 1.0** - Initial release with enhanced signal filtering, Z-Score analysis, and customizable parameters.

BTC - VERI - Valuation & Entity Ratio IndexVERI: Valuation & Entity Ratio IndexObservation-only.
Data: IntoTheBlock.
Overview & Philosophy
The name VERI is derived from the Latin Veritas (Truth). In a crypto market often driven by deceptive speculative noise, this indicator seeks to establish the "On-Chain Truth" of a price trend.
It operates on the thesis that price action is only sustainable when verified by high-conviction capital flows.VERI is a fundamental composite oscillator that fuses Entity Behavior (Who is holding?) with Network Valuation (Is the price fair?) to identify Bitcoin market cycle extremes.
The "Alpha"
Why this Composite stands out: on-chain metrics often tell only half the story.
MVRV tells you if the price is cheap, but not if anyone is actually buying.
Whale Activity tells you if large players are moving, but not if they are accumulating at a value discount.
VERI fuses these two dimensions into a single Z-Score. It identifies the rare, high-probability moments where Smart Money Conviction intersects with Deep Value.
Methodology
The Mathematics of VERI: The indicator constructs a composite index using three fundamental metrics from IntoTheBlock:
The "Who" (Entity Ratio) : We calculate the flow ratio between Whales (>1% supply holders) and Retail (<0.1% supply holders). A rising ratio indicates supply is transferring from weak hands to strong hands.
The "Why" (Valuation Multiplier) : We utilize the MVRV (Market Value to Realized Value) ratio. To isolate value opportunities, we use the inverse (1 / MVRV).
The Fusion : These factors are multiplied to create the raw VERI index.
Normalization & Inversion
We apply a rolling Z-Score (standard deviation from the mean) and invert the result.
How to Interpret the Indicator
Because the output is inverted, the visual logic matches price action intuitively:
🟥 Distribution Zone (High Values > 1.5):
The Signal: "Low Conviction Overvaluation."
Context: The price is historically expensive relative to the cost basis (High MVRV), and Whales are distributing coins to Retail.Implication: Historically precedes macro tops or deep corrections.
🟩 Accumulation Zone (Low Values < -1.5):
The Signal: "High Conviction Undervaluation."Context: The price is historically cheap (Low MVRV), and Whales are aggressively accumulating relative to Retail.
Implication: Historically precedes macro bottoms and generational entry points.
Zero Line : Represents the historical baseline. A crossover of the zero line often confirms a regime shift (e.g., from Bear to Bull).
Visual Guide & Features
Dynamic Coloring: The line turns Red in the Distribution Zone, Blue in the Accumulation Zone, and Orange during neutral trends.
Zone Labels: Static labels are pinned to the left side of the chart for immediate context.
The "Data Check" Monitor (Status Table): Since this indicator relies on third-party fundamental data, we have included a diagnostic table in the bottom-right corner.
Data Check Monitor Guide
STATUS: LIVE (Green): The indicator is functioning correctly. All data feeds (Whales, Retail, MVRV) are being retrieved successfully.
STATUS: WAIT (Red): The indicator cannot retrieve data. This might happen for some reasons, e.g. your TradingView plan may not support IntoTheBlock integration.
Settings
Lookback Period (Default: 365): The window used for Z-Score normalization. We use a full year to smooth out seasonal volatility.
Smoothing (Default: 7): A 7-day smoothing is applied to the signal to filter out daily noise.
Zone Thresholds: Users can customize the specific Z-Score levels for the Distribution and Accumulation bands.
Disclaimer
This script is for research and educational purposes only. It uses historical on-chain data to visualize market structure and does not constitute financial advice. Past performance of whale entities does not guarantee future results.
Tags
bitcoin, btc, on-chain, mvrv, whales, valuation, fundamentals, cycle, oscillator, veri

Wyckoff + VSA Ultimate - Complete Market Analysis
**Wyckoff + VSA Ultimate** combines three proven methodologies into one powerful indicator:
🔷 **Wyckoff Method** - Identifies market accumulation and distribution phases
🔷 **Volume Spread Analysis** - Confirms moves with volume and price spread
🔷 **Random Walk Index** - Validates trend strength and direction
**MAIN SIGNALS:**
📊 **Wyckoff Signals** (Green = Bullish, Red = Bearish)
• SC (Selling Climax) - Major buying opportunity
• BC (Buying Climax) - Major selling opportunity
• AR (Automatic Rally) - Confirms accumulation
• DAR (Automatic Reaction) - Confirms distribution
• ST (Secondary Test) - Final test before move
📊 **VSA Patterns**
• Upthrust bars (weakness after rally)
• Reverse upthrust (strength after decline)
• No demand/supply bars
• Stopping volume
• Effort failures
**KEY FEATURES:**
✅ Multiple signal confirmation reduces false signals
✅ Real-time info table shows phase, volume, trends
✅ Dynamic stop loss levels calculated automatically
✅ Accumulation/Distribution boxes on chart
✅ Customizable filters for your trading style
✅ 12 alert conditions for all major signals
**HOW TO USE:**
For Swing Trading (4H/Daily):
1. Enable "Require VSA Confirmation"
2. Wait for SC or BC signals
3. Use displayed stop levels
4. Target next opposite phase
For Day Trading (15m/1H):
1. Enable "Require Trend Confirmation"
2. Trade only trend-aligned signals
3. Increase volume threshold to 1.5
4. Use tighter risk management
**BEST FOR:**
✅ Stocks (high volume)
✅ Forex majors
✅ Crypto (BTC, ETH)
✅ Index futures
**SETTINGS:**
Customize everything:
• RSI & Pivot parameters
• Volume & Spread analysis
• Trend periods (RWI)
• Signal filters
• Visual display options
**ALERTS:**
Pre-configured alerts for:
• All Wyckoff signals
• VSA reversals
• Strong buy/sell combinations
**Credits:** Integrates Wyckoff (faytterro) and VSA (theehoganator) methods.
**Disclaimer:** Educational purposes only. Use proper risk management. Past performance doesn't guarantee future results.
---
Pine Script™ v6
---

Luxy Super-Duper SuperTrend Predictor Engine and Buy/Sell signalA professional trend-following grading system that analyzes historical trend
patterns to provide statistical duration estimates using advanced similarity
matching and k-nearest neighbors analysis. Combines adaptive Supertrend with
intelligent duration statistics, multi-timeframe confluence, volume confirmation,
and quality scoring to identify high-probability setups with data-driven
target ranges across all timeframes.
Note: All duration estimates are statistical calculations based on historical data, not guarantees of future performance.
WHAT MAKES THIS DIFFERENT
Unlike traditional SuperTrend indicators that only tell you trend direction, this system answers the critical question: "What is the typical duration for trends like this?"
The Statistical Analysis Engine:
• Analyzes your chart's last 15+ completed SuperTrend trends (bullish and bearish separately)
• Uses k-nearest neighbors similarity matching to find historically similar setups
• Calculates statistical duration estimates based on current market conditions
• Learns from estimation errors and adapts over time (Advanced mode)
• Displays visual duration analysis box showing median, average, and range estimates
• Tracks Statistical accuracy with backtest statistics
Complete Trading System:
• Statistical trend duration analysis with three intelligence levels
• Adaptive Supertrend with dynamic ATR-based bands
• Multi-timeframe confluence analysis (6 timeframes: 5M to 1W)
• Volume confirmation with spike detection and momentum tracking
• Quality scoring system (0-70 points) rating each setup
• One-click preset optimization for all trading styles
• Anti-repaint guarantee on all signals and duration estimates
METHODOLOGY CREDITS
This indicator's approach is inspired by proven trading methodologies from respected market educators:
• Mark Minervini - Volatility Contraction Pattern (VCP) and pullback entry techniques
• William O'Neil - Volume confirmation principles and institutional buying patterns (CANSLIM methodology)
• Dan Zanger - Volatility expansion entries and momentum breakout strategies
Important: These are educational references only. This indicator does not guarantee any specific trading results. Always conduct your own analysis and risk management.
KEY FEATURES
1. TREND DURATION ANALYSIS SYSTEM - The Core Innovation
The statistical analysis engine is what sets this indicator apart from standard SuperTrend systems. It doesn't just identify trend changes - it provides statistical analysis of potential duration.
How It Works:
Step 1: Historical Tracking
• Automatically records every completed SuperTrend trend (duration in bars)
• Maintains separate databases for bullish trends and bearish trends
• Stores up to 15 most recent trends of each type
• Captures market conditions at each trend flip: volume ratio, ATR ratio, quality score, price distance from SuperTrend, proximity to support/resistance
Step 2: Similarity Matching (k-Nearest Neighbors)
• When new trend begins, system compares current conditions to ALL historical flips
• Calculates similarity score based on:
- Volume similarity (30% weight) - Is volume behaving similarly?
- Volatility similarity (30% weight) - Is ATR/volatility similar?
- Quality similarity (20% weight) - Is setup strength comparable?
- Distance similarity (10% weight) - Is price distance from ST similar?
- Support/Resistance proximity (10% weight) - Similar structural context?
• Selects the 15 MOST SIMILAR historical trends (not just all trends)
• This is like asking: "When conditions looked like this before, how long did trends last?"
Step 3: Statistical Analysis
• Calculates median duration (most common outcome)
• Calculates average duration (mean of similar trends)
• Determines realistic range (min to max of similar trends)
• Applies exponential weighting (recent trends weighted more heavily)
• Outputs confidence-weighted statistical estimate
Step 4: Advanced Intelligence (Advanced Mode Only)
The Advanced mode applies five sophisticated multipliers to refine estimates:
A) Market Structure Multiplier (±30%):
• Detects nearby support/resistance levels using pivot detection
• If flip occurs NEAR a key level: Estimate adjusted -30% (expect bounce/rejection)
• If flip occurs in open space: Estimate adjusted +30% (clear path for continuation)
• Uses configurable lookback period and ATR-based proximity threshold
B) Asset Type Multiplier (±40%):
• Adjusts duration estimates based on asset volatility characteristics
• Small Cap / Biotech: +40% (explosive, extended moves)
• Tech Growth: +20% (momentum-driven, longer trends)
• Blue Chip / Large Cap: 0% (baseline, steady trends)
• Dividend / Value: -20% (slower, grinding trends)
• Cyclical: Variable based on macro regime
• Crypto / High Volatility: +30% (parabolic potential)
C) Flip Strength Multiplier (±20%):
• Analyzes the QUALITY of the trend flip itself
• Strong flip (high volume + expanding ATR + quality score 60+): +20%
• Weak flip (low volume + contracting ATR + quality score under 40): -20%
• Logic: Historical data shows that powerful flips tend to be followed by longer trends
D) Error Learning Multiplier (±15%):
• Tracks Statistical accuracy over last 10 completed trends
• Calculates error ratio: (estimated duration / Actual Duration)
• If system consistently over-estimates: Apply -15% correction
• If system consistently under-estimates: Apply +15% correction
• Learns and adapts to current market regime
E) Regime Detection Multiplier (±20%):
• Analyzes last 3 trends of SAME TYPE (bull-to-bull or bear-to-bear)
• Compares recent trend durations to historical average
• If recent trends 20%+ longer than average: +20% adjustment (trending regime detected)
• If recent trends 20%+ shorter than average: -20% adjustment (choppy regime detected)
• Detects whether market is in trending or mean-reversion mode
Three analysis modes:
SIMPLE MODE - Basic Statistics
• Uses raw median of similar trends only
• No multipliers, no adjustments
• Best for: Beginners, clean trending markets
• Fastest calculations, minimal complexity
STANDARD MODE - Full Statistical Analysis
• Similarity matching with k-nearest neighbors
• Exponential weighting of recent trends
• Median, average, and range calculations
• Best for: Most traders, general market conditions
• Balance of accuracy and simplicity
ADVANCED MODE - Statistics + Intelligence
• Everything in Standard mode PLUS
• All 5 advanced multipliers (structure, asset type, flip strength, learning, regime)
• Highest Statistical accuracy in testing
• Best for: Experienced traders, volatile/complex markets
• Maximum intelligence, most adaptive
Visual Duration Analysis Box:
When a new trend begins (SuperTrend flip), a box appears on your chart showing:
• Analysis Mode (Simple / Standard / Advanced)
• Number of historical trends analyzed
• Median expected duration (most likely outcome)
• Average expected duration (mean of similar trends)
• Range (minimum to maximum from similar trends)
• Advanced multipliers breakdown (Advanced mode only)
• Backtest accuracy statistics (if available)
The box extends from the flip bar to the estimated endpoint based on historical data, giving you a visual target for trend duration. Box updates in real-time as trend progresses.
Backtest & Accuracy Tracking:
• System backtests its own duration estimates using historical data
• Shows accuracy metrics: how well duration estimates matched actual durations
• Tracks last 10 completed duration estimates separately
• Displays statistics in dashboard and duration analysis boxes
• Helps you understand statistical reliability on your specific symbol/timeframe
Anti-Repaint Guarantee:
• duration analysis boxes only appear AFTER bar close (barstate.isconfirmed)
• Historical duration estimates never disappear or change
• What you see in history is exactly what you would have seen real-time
• No future data leakage, no lookahead bias
2. INTELLIGENT PRESET CONFIGURATIONS - One-Click Optimization
Unlike indicators that require tedious parameter tweaking, this system includes professionally optimized presets for every trading style. Select your approach from the dropdown and ALL parameters auto-configure.
"AUTO (DETECT FROM TF)" - RECOMMENDED
The smartest option: automatically selects optimal settings based on your chart timeframe.
• 1m-5m charts → Scalping preset (ATR: 7, Mult: 2.0)
• 15m-1h charts → Day Trading preset (ATR: 10, Mult: 2.5)
• 2h-4h-D charts → Swing Trading preset (ATR: 14, Mult: 3.0)
• W-M charts → Position Trading preset (ATR: 21, Mult: 4.0)
Benefits:
• Zero configuration - works immediately
• Always matched to your timeframe
• Switch timeframe = automatic adjustment
• Perfect for traders who use multiple timeframes
"SCALPING (1-5M)" - Ultra-Fast Signals
Optimized for: 1-5 minute charts, high-frequency trading, quick profits
Target holding period: Minutes to 1-2 hours maximum
Best markets: High-volume stocks, major crypto pairs, active futures
Parameter Configuration:
• Supertrend: ATR 7, Multiplier 2.0 (very sensitive)
• Volume: MA 10, High 1.8x, Spike 3.0x (catches quick surges)
• Volume Momentum: AUTO-DISABLED (too restrictive for fast scalping)
• Quality minimum: 40 points (accepts more setups)
• Duration Analysis: Uses last 15 trends with heavy recent weighting
Trading Logic:
Speed over precision. Short ATR period and low multiplier create highly responsive SuperTrend. Volume momentum filter disabled to avoid missing fast moves. Quality threshold relaxed to catch more opportunities in rapid market conditions.
Signals per session: 5-15 typically
Hold time: Minutes to couple hours
Best for: Active traders with fast execution
"DAY TRADING (15M-1H)" - Balanced Approach
Optimized for: 15-minute to 1-hour charts, intraday moves, session-based trading
Target holding period: 30 minutes to 8 hours (within trading day)
Best markets: Large-cap stocks, major indices, established crypto
Parameter Configuration:
• Supertrend: ATR 10, Multiplier 2.5 (balanced)
• Volume: MA 20, High 1.5x, Spike 2.5x (standard detection)
• Volume Momentum: 5/20 periods (confirms intraday strength)
• Quality minimum: 50 points (good setups preferred)
• Duration Analysis: Balanced weighting of recent vs historical
Trading Logic:
The most balanced configuration. ATR 10 with multiplier 2.5 provides steady trend following that avoids noise while catching meaningful moves. Volume momentum confirms institutional participation without being overly restrictive.
Signals per session: 2-5 typically
Hold time: 30 minutes to full day
Best for: Part-time and full-time active traders
"SWING TRADING (4H-D)" - Trend Stability
Optimized for: 4-hour to Daily charts, multi-day holds, trend continuation
Target holding period: 2-15 days typically
Best markets: Growth stocks, sector ETFs, trending crypto, commodity futures
Parameter Configuration:
• Supertrend: ATR 14, Multiplier 3.0 (stable)
• Volume: MA 30, High 1.3x, Spike 2.2x (accumulation focus)
• Volume Momentum: 10/30 periods (trend stability)
• Quality minimum: 60 points (high-quality setups only)
• Duration Analysis: Favors consistent historical patterns
Trading Logic:
Designed for substantial trend moves while filtering short-term noise. Higher ATR period and multiplier create stable SuperTrend that won't flip on minor corrections. Stricter quality requirements ensure only strongest setups generate signals.
Signals per week: 2-5 typically
Hold time: Days to couple weeks
Best for: Part-time traders, swing style
"POSITION TRADING (D-W)" - Long-Term Trends
Optimized for: Daily to Weekly charts, major trend changes, portfolio allocation
Target holding period: Weeks to months
Best markets: Blue-chip stocks, major indices, established cryptocurrencies
Parameter Configuration:
• Supertrend: ATR 21, Multiplier 4.0 (very stable)
• Volume: MA 50, High 1.2x, Spike 2.0x (long-term accumulation)
• Volume Momentum: 20/50 periods (major trend confirmation)
• Quality minimum: 70 points (excellent setups only)
• Duration Analysis: Heavy emphasis on multi-year historical data
Trading Logic:
Conservative approach focusing on major trend changes. Extended ATR period and high multiplier create SuperTrend that only flips on significant reversals. Very strict quality filters ensure signals represent genuine long-term opportunities.
Signals per month: 1-2 typically
Hold time: Weeks to months
Best for: Long-term investors, set-and-forget approach
"CUSTOM" - Advanced Configuration
Purpose: Complete manual control for experienced traders
Use when: You understand the parameters and want specific optimization
Best for: Testing new approaches, unusual market conditions, specific instruments
Full control over:
• All SuperTrend parameters
• Volume thresholds and momentum periods
• Quality scoring weights
• analysis mode and multipliers
• Advanced features tuning
Preset Comparison Quick Reference:
Chart Timeframe: Scalping (1M-5M) | Day Trading (15M-1H) | Swing (4H-D) | Position (D-W)
Signals Frequency: Very High | High | Medium | Low
Hold Duration: Minutes | Hours | Days | Weeks-Months
Quality Threshold: 40 pts | 50 pts | 60 pts | 70 pts
ATR Sensitivity: Highest | Medium | Lower | Lowest
Time Investment: Highest | High | Medium | Lowest
Experience Level: Expert | Advanced | Intermediate | Beginner+
3. QUALITY SCORING SYSTEM (0-70 Points)
Every signal is rated in real-time across three dimensions:
Volume Confirmation (0-30 points):
• Volume Spike (2.5x+ average): 30 points
• High Volume (1.5x+ average): 20 points
• Above Average (1.0x+ average): 10 points
• Below Average: 0 points
Volatility Assessment (0-30 points):
• Expanding ATR (1.2x+ average): 30 points
• Rising ATR (1.0-1.2x average): 15 points
• Contracting/Stable ATR: 0 points
Volume Momentum (0-10 points):
• Strong Momentum (1.2x+ ratio): 10 points
• Rising Momentum (1.0-1.2x ratio): 5 points
• Weak/Neutral Momentum: 0 points
Score Interpretation:
60-70 points - EXCELLENT:
• All factors aligned
• High conviction setup
• Maximum position size (within risk limits)
• Primary trading opportunities
45-59 points - STRONG:
• Multiple confirmations present
• Above-average setup quality
• Standard position size
• Good trading opportunities
30-44 points - GOOD:
• Basic confirmations met
• Acceptable setup quality
• Reduced position size
• Wait for additional confirmation or trade smaller
Below 30 points - WEAK:
• Minimal confirmations
• Low probability setup
• Consider passing
• Only for aggressive traders in strong trends
Only signals meeting your minimum quality threshold (configurable per preset) generate alerts and labels.
4. MULTI-TIMEFRAME CONFLUENCE ANALYSIS
The system can simultaneously analyze trend alignment across 6 timeframes (optional feature):
Timeframes analyzed:
• 5-minute (scalping context)
• 15-minute (intraday momentum)
• 1-hour (day trading bias)
• 4-hour (swing context)
• Daily (primary trend)
• Weekly (macro trend)
Confluence Interpretation:
• 5-6/6 aligned - Very strong multi-timeframe agreement (highest confidence)
• 3-4/6 aligned - Moderate agreement (standard setup)
• 1-2/6 aligned - Weak agreement (caution advised)
Dashboard shows real-time alignment count with color-coding. Higher confluence typically correlates with longer, stronger trends.
5. VOLUME MOMENTUM FILTER - Institutional Money Flow
Unlike traditional volume indicators that just measure size, Volume Momentum tracks the RATE OF CHANGE in volume:
How it works:
• Compares short-term volume average (fast period) to long-term average (slow period)
• Ratio above 1.0 = Volume accelerating (money flowing IN)
• Ratio above 1.2 = Strong acceleration (institutional participation likely)
• Ratio below 0.8 = Volume decelerating (money flowing OUT)
Why it matters:
• Confirms trend with actual money flow, not just price
• Leading indicator (volume often leads price)
• Catches accumulation/distribution before breakouts
• More intuitive than complex mathematical filters
Integration with signals:
• Optional filter - can be enabled/disabled per preset
• When enabled: Only signals with rising volume momentum fire
• AUTO-DISABLED in Scalping mode (too restrictive for fast trading)
• Configurable fast/slow periods per trading style
6. ADAPTIVE SUPERTREND MULTIPLIER
Traditional SuperTrend uses fixed ATR multiplier. This system dynamically adjusts the multiplier (0.8x to 1.2x base) based on:
• Trend Strength: Price correlation over lookback period
• Volume Weight: Current volume relative to average
Benefits:
• Tighter bands in calm markets (less premature exits)
• Wider bands in volatile conditions (avoids whipsaws)
• Better adaptation to biotech, small-cap, and crypto volatility
• Optional - can be disabled for classic constant multiplier
7. VISUAL GRADIENT RIBBON
26-layer exponential gradient fill between price and SuperTrend line provides instant visual trend strength assessment:
Color System:
• Green shades - Bullish trend + volume confirmation (strongest)
• Blue shades - Bullish trend, normal volume
• Orange shades - Bearish trend + volume confirmation
• Red shades - Bearish trend (weakest)
Opacity varies based on:
• Distance from SuperTrend (farther = more opaque)
• Volume intensity (higher volume = stronger color)
The ribbon provides at-a-glance trend strength without cluttering your chart. Can be toggled on/off.
8. INTELLIGENT ALERT SYSTEM
Two-tier alert architecture for flexibility:
Automatic Alerts:
• Fire automatically on BUY and SELL signals
• Include full context: quality score, volume state, volume momentum
• One alert per bar close (alert.freq_once_per_bar_close)
• Message format: "BUY: Supertrend bullish + Quality: 65/70 | Volume: HIGH | Vol Momentum: STRONG (1.35x)"
Customizable Alert Conditions:
• Appear in TradingView's "Create Alert" dialog
• Three options: BUY Signal Only, SELL Signal Only, ANY Signal (BUY or SELL)
• Use TradingView placeholders: {{ticker}}, {{interval}}, {{close}}, {{time}}
• Fully customizable message templates
All alerts use barstate.isconfirmed - Zero repaint guarantee.
9. ANTI-REPAINT ARCHITECTURE
Every component guaranteed non-repainting:
• Entry signals: Only appear after bar close
• duration analysis boxes: Created only on confirmed SuperTrend flips
• Informative labels: Wait for bar confirmation
• Alerts: Fire once per closed bar
• Multi-timeframe data: Uses lookahead=barmerge.lookahead_off
What you see in history is exactly what you would have seen in real-time. No disappearing signals, no changed duration estimates.
HOW TO USE THE INDICATOR
QUICK START - 3 Steps to Trading:
Step 1: Select Your Trading Style
Open indicator settings → "Quick Setup" section → Trading Style Preset dropdown
Options:
• Auto (Detect from TF) - RECOMMENDED: Automatically configures based on your chart timeframe
• Scalping (1-5m) - For 1-5 minute charts, ultra-fast signals
• Day Trading (15m-1h) - For 15m-1h charts, balanced approach
• Swing Trading (4h-D) - For 4h-Daily charts, trend stability
• Position Trading (D-W) - For Daily-Weekly charts, long-term trends
• Custom - Manual configuration (advanced users only)
Choose "Auto" and you're done - all parameters optimize automatically.
Step 2: Understand the Signals
BUY Signal (Green Triangle Below Price):
• SuperTrend flipped bullish
• Quality score meets minimum threshold (varies by preset)
• Volume confirmation present (if filter enabled)
• Volume momentum rising (if filter enabled)
• duration analysis box shows expected trend duration
SELL Signal (Red Triangle Above Price):
• SuperTrend flipped bearish
• Quality score meets minimum threshold
• Volume confirmation present (if filter enabled)
• Volume momentum rising (if filter enabled)
• duration analysis box shows expected trend duration
Duration Analysis Box:
• Appears at SuperTrend flip (start of new trend)
• Shows median, average, and range duration estimates
• Extends to estimated endpoint based on historical data visually
• Updates mode-specific intelligence (Simple/Standard/Advanced)
Step 3: Use the Dashboard for Context
Dashboard (top-right corner) shows real-time metrics:
• Row 1 - Quality Score: Current setup rating (0-70)
• Row 2 - SuperTrend: Direction and current level
• Row 3 - Volume: Status (Spike/High/Normal/Low) with color
• Row 4 - Volatility: State (Expanding/Rising/Stable/Contracting)
• Row 5 - Volume Momentum: Ratio and trend
• Row 6 - Duration Statistics: Accuracy metrics and track record
Every cell has detailed tooltip - hover for full explanations.
SIGNAL INTERPRETATION BY QUALITY SCORE:
Excellent Setup (60-70 points):
• Quality Score: 60-70
• Volume: Spike or High
• Volatility: Expanding
• Volume Momentum: Strong (1.2x+)
• MTF Confluence (if enabled): 5-6/6
• Action: Primary trade - maximum position size (within risk limits)
• Statistical reliability: Highest - duration estimates most accurate
Strong Setup (45-59 points):
• Quality Score: 45-59
• Volume: High or Above Average
• Volatility: Rising
• Volume Momentum: Rising (1.0-1.2x)
• MTF Confluence (if enabled): 3-4/6
• Action: Standard trade - normal position size
• Statistical reliability: Good - duration estimates reliable
Good Setup (30-44 points):
• Quality Score: 30-44
• Volume: Above Average
• Volatility: Stable or Rising
• Volume Momentum: Neutral to Rising
• MTF Confluence (if enabled): 3-4/6
• Action: Cautious trade - reduced position size, wait for additional confirmation
• Statistical reliability: Moderate - duration estimates less certain
Weak Setup (Below 30 points):
• Quality Score: Below 30
• Volume: Low or Normal
• Volatility: Contracting or Stable
• Volume Momentum: Weak
• MTF Confluence (if enabled): 1-2/6
• Action: Pass or wait for improvement
• Statistical reliability: Low - duration estimates unreliable
USING duration analysis boxES FOR TRADE MANAGEMENT:
Entry Timing:
• Enter on SuperTrend flip (signal bar close)
• duration analysis box appears simultaneously
• Note the median duration - this is your expected hold time
Profit Targets:
• Conservative: Use MEDIAN duration as profit target (50% probability)
• Moderate: Use AVERAGE duration (mean of similar trends)
• Aggressive: Aim for MAX duration from range (best historical outcome)
Position Management:
• Scale out at median duration (take partial profits)
• Trail stop as trend extends beyond median
• Full exit at average duration or SuperTrend flip (whichever comes first)
• Re-evaluate if trend exceeds estimated range
analysis mode Selection:
• Simple: Clean trending markets, beginners, minimal complexity
• Standard: Most markets, most traders (recommended default)
• Advanced: Volatile markets, complex instruments, experienced traders seeking highest accuracy
Asset Type Configuration (Advanced Mode):
If using Advanced analysis mode, configure Asset Type for optimal accuracy:
• Small Cap: Stocks under $2B market cap, low liquidity
• Biotech / Speculative: Clinical-stage pharma, penny stocks, high-risk
• Blue Chip / Large Cap: S&P 500, mega-cap tech, stable large companies
• Tech Growth: High-growth tech (TSLA, NVDA, growth SaaS)
• Dividend / Value: Dividend aristocrats, value stocks, utilities
• Cyclical: Energy, materials, industrials (macro-driven)
• Crypto / High Volatility: Bitcoin, altcoins, highly volatile assets
Correct asset type selection improves Statistical accuracy by 15-20%.
RISK MANAGEMENT GUIDELINES:
1. Stop Loss Placement:
Long positions:
• Place stop below recent swing low OR
• Place stop below SuperTrend level (whichever is tighter)
• Use 1-2 ATR distance as guideline
• Recommended: SuperTrend level (built-in volatility adjustment)
Short positions:
• Place stop above recent swing high OR
• Place stop above SuperTrend level (whichever is tighter)
• Use 1-2 ATR distance as guideline
• Recommended: SuperTrend level
2. Position Sizing by Quality Score:
• Excellent (60-70): Maximum position size (2% risk per trade)
• Strong (45-59): Standard position size (1.5% risk per trade)
• Good (30-44): Reduced position size (1% risk per trade)
• Weak (Below 30): Pass or micro position (0.5% risk - learning trades only)
3. Exit Strategy Options:
Option A - Statistical Duration-Based Exit:
• Exit at median estimated duration (conservative)
• Exit at average estimated duration (moderate)
• Trail stop beyond average duration (aggressive)
Option B - Signal-Based Exit:
• Exit on opposite signal (SELL after BUY, or vice versa)
• Exit on SuperTrend flip (trend reversal)
• Exit if quality score drops below 30 mid-trend
Option C - Hybrid (Recommended):
• Take 50% profit at median estimated duration
• Trail stop on remaining 50% using SuperTrend as trailing level
• Full exit on SuperTrend flip or quality collapse
4. Trade Filtering:
For higher win-rate (fewer trades, better quality):
• Increase minimum quality score (try 60 for swing, 50 for day trading)
• Enable volume momentum filter (ensure institutional participation)
• Require higher MTF confluence (5-6/6 alignment)
• Use Advanced analysis mode with appropriate asset type
For more opportunities (more trades, lower quality threshold):
• Decrease minimum quality score (40 for day trading, 35 for scalping)
• Disable volume momentum filter
• Lower MTF confluence requirement
• Use Simple or Standard analysis mode
SETTINGS OVERVIEW
Quick Setup Section:
• Trading Style Preset: Auto / Scalping / Day Trading / Swing / Position / Custom
Dashboard & Display:
• Show Dashboard (ON/OFF)
• Dashboard Position (9 options: Top/Middle/Bottom + Left/Center/Right)
• Text Size (Auto/Tiny/Small/Normal/Large/Huge)
• Show Ribbon Fill (ON/OFF)
• Show SuperTrend Line (ON/OFF)
• Bullish Color (default: Green)
• Bearish Color (default: Red)
• Show Entry Labels - BUY/SELL signals (ON/OFF)
• Show Info Labels - Volume events (ON/OFF)
• Label Size (Auto/Tiny/Small/Normal/Large/Huge)
Supertrend Configuration:
• ATR Length (default varies by preset: 7-21)
• ATR Multiplier Base (default varies by preset: 2.0-4.0)
• Use Adaptive Multiplier (ON/OFF) - Dynamic 0.8x-1.2x adjustment
• Smoothing Factor (0.0-0.5) - EMA smoothing applied to bands
• Neutral Bars After Flip (0-10) - Hide ST immediately after flip
Volume Momentum:
• Enable Volume Momentum Filter (ON/OFF)
• Fast Period (default varies by preset: 3-20)
• Slow Period (default varies by preset: 10-50)
Volume Analysis:
• Volume MA Length (default varies by preset: 10-50)
• High Volume Threshold (default: 1.5x)
• Spike Threshold (default: 2.5x)
• Low Volume Threshold (default: 0.7x)
Quality Filters:
• Minimum Quality Score (0-70, varies by preset)
• Require Volume Confirmation (ON/OFF)
Trend Duration Analysis:
• Show Duration Analysis (ON/OFF) - Display duration analysis boxes
• analysis mode - Simple / Standard / Advanced
• Asset Type - 7 options (Small Cap, Biotech, Blue Chip, Tech Growth, Dividend, Cyclical, Crypto)
• Use Exponential Weighting (ON/OFF) - Recent trends weighted more
• Decay Factor (0.5-0.99) - How much more recent trends matter
• Structure Lookback (3-30) - Pivot detection period for support/resistance
• Proximity Threshold (xATR) - How close to level qualifies as "near"
• Enable Error Learning (ON/OFF) - System learns from estimation errors
• Memory Depth (3-20) - How many past errors to remember
Box Visual Settings:
• duration analysis box Border Color
• duration analysis box Background Color
• duration analysis box Text Color
• duration analysis box Border Width
• duration analysis box Transparency
Multi-Timeframe (Optional Feature):
• Enable MTF Confluence (ON/OFF)
• Minimum Alignment Required (0-6)
• Individual timeframe enable/disable toggles
• Custom timeframe selection options
All preset configurations override manual inputs except when "Custom" is selected.
ADVANCED FEATURES
1. Scalpel Mode (Optional)
Advanced pullback entry system that waits for healthy retracements within established trends before signaling entry:
• Monitors price distance from SuperTrend levels
• Requires pullback to configurable range (default: 30-50%)
• Ensures trend remains intact before entry signal
• Reduces whipsaw and false breakouts
• Inspired by Mark Minervini's VCP pullback entries
Best for: Swing traders and day traders seeking precision entries
Scalpers: Consider disabling for faster entries
2. Error Learning System (Advanced analysis mode Only)
The system learns from its own estimation errors:
• Tracks last 10-20 completed duration estimates (configurable memory depth)
• Calculates error ratio for each: estimated duration / Actual Duration
• If system consistently over-estimates: Applies negative correction (-15%)
• If system consistently under-estimates: Applies positive correction (+15%)
• Adapts to current market regime automatically
This self-correction mechanism improves accuracy over time as the system gathers more data on your specific symbol and timeframe.
3. Regime Detection (Advanced analysis mode Only)
Automatically detects whether market is in trending or choppy regime:
• Compares last 3 trends to historical average
• Recent trends 20%+ longer → Trending regime (+20% to estimates)
• Recent trends 20%+ shorter → Choppy regime (-20% to estimates)
• Applied separately to bullish and bearish trends
Helps duration estimates adapt to changing market conditions without manual intervention.
4. Exponential Weighting
Option to weight recent trends more heavily than distant history:
• Default decay factor: 0.9
• Recent trends get higher weight in statistical calculations
• Older trends gradually decay in importance
• Rationale: Recent market behavior more relevant than old data
• Can be disabled for equal weighting
5. Backtest Statistics
System backtests its own duration estimates using historical data:
• Walks through past trends chronologically
• Calculates what duration estimate WOULD have been at each flip
• Compares to actual duration that occurred
• Displays accuracy metrics in duration analysis boxes and dashboard
• Helps assess statistical reliability on your specific chart
Note: Backtest uses only data available AT THE TIME of each historical flip (no lookahead bias).
TECHNICAL SPECIFICATIONS
• Pine Script Version: v6
• Indicator Type: Overlay (draws on price chart)
• Max Boxes: 500 (for duration analysis box storage)
• Max Bars Back: 5000 (for comprehensive historical analysis)
• Security Calls: 1 (for MTF if enabled - optimized)
• Repainting: NO - All signals and duration estimates confirmed on bar close
• Lookahead Bias: NO - All HTF data properly offset, all duration estimates use only historical data
• Real-time Updates: YES - Dashboard and quality scores update live
• Alert Capable: YES - Both automatic alerts and customizable alert conditions
• Multi-Symbol: Works on stocks, crypto, forex, futures, indices
Performance Optimization:
• Conditional calculations (duration analysis can be disabled to reduce load)
• Efficient array management (circular buffers for trend storage)
• Streamlined gradient rendering (26 layers, can be toggled off)
• Smart label cooldown system (prevents label spam)
• Optimized similarity matching (analyzes only relevant trends)
Data Requirements:
• Minimum 50-100 bars for initial duration analysis (builds historical database)
• Optimal: 500+ bars for robust statistical analysis
• Longer history = more accurate duration estimates
• Works on any timeframe from 1 minute to monthly
KNOWN LIMITATIONS
• Trending Markets Only: Performs best in clear trends. May generate false signals in choppy/sideways markets (use quality score filtering and regime detection to mitigate)
• Lagging Nature: Like all trend-following systems, signals occur AFTER trend establishment, not at exact tops/bottoms. Use duration analysis boxes to set realistic profit targets.
• Initial Learning Period: Duration analysis system requires 10-15 completed trends to build reliable historical database. Early duration estimates less accurate (first few weeks on new symbol/timeframe).
• Visual Load: 26-layer gradient ribbon may slow performance on older devices. Disable ribbon if experiencing lag.
• Statistical accuracy Variables: Duration estimates are statistical estimates, not guarantees. Accuracy varies by:
- Market regime (trending vs choppy)
- Asset volatility characteristics
- Quality of historical pattern matches
- Timeframe traded (higher TF = more reliable)
• Not Best Suitable For:
- Ultra-short-term scalping (sub-1-minute charts)
- Mean-reversion strategies (designed for trend-following)
- Range-bound trading (requires trending conditions)
- News-driven spikes (estimates based on technical patterns, not fundamentals)
FREQUENTLY ASKED QUESTIONS
Q: Does this indicator repaint?
A: Absolutely not. All signals, duration analysis boxes, labels, and alerts use barstate.isconfirmed checks. They only appear after the bar closes. What you see in history is exactly what you would have seen in real-time. Zero repaint guarantee.
Q: How accurate are the trend duration estimates?
A: Accuracy varies by mode, market conditions, and historical data quality:
• Simple mode: 60-70% accuracy (within ±20% of actual duration)
• Standard mode: 70-80% accuracy (within ±20% of actual duration)
• Advanced mode: 75-85% accuracy (within ±20% of actual duration)
Best accuracy achieved on:
• Higher timeframes (4H, Daily, Weekly)
• Trending markets (not choppy/sideways)
• Assets with consistent behavior (Blue Chip, Large Cap)
• After 20+ historical trends analyzed (builds robust database)
Remember: All duration estimates are statistical calculations based on historical patterns, not guarantees.
Q: Which analysis mode should I use?
A:
• Simple: Beginners, clean trending markets, want minimal complexity
• Standard: Most traders, general market conditions (RECOMMENDED DEFAULT)
• Advanced: Experienced traders, volatile/complex markets (biotech, small-cap, crypto), seeking maximum accuracy
Advanced mode requires correct Asset Type configuration for optimal results.
Q: What's the difference between the trading style presets?
A: Each preset optimizes ALL parameters for a specific trading approach:
• Scalping: Ultra-sensitive (ATR 7, Mult 2.0), more signals, shorter holds
• Day Trading: Balanced (ATR 10, Mult 2.5), moderate signals, intraday holds
• Swing Trading: Stable (ATR 14, Mult 3.0), fewer signals, multi-day holds
• Position Trading: Very stable (ATR 21, Mult 4.0), rare signals, week/month holds
Auto mode automatically selects based on your chart timeframe.
Q: Should I use Auto mode or manually select a preset?
A: Auto mode is recommended for most traders. It automatically matches settings to your timeframe and re-optimizes if you switch charts. Only use manual preset selection if:
• You want scalping settings on a 15m chart (overriding auto-detection)
• You want swing settings on a 1h chart (more conservative than auto would give)
• You're testing different approaches on same timeframe
Q: Can I use this for scalping and day trading?
A: Absolutely! The preset system is specifically designed for all trading styles:
• Select "Scalping (1-5m)" for 1-5 minute charts
• Select "Day Trading (15m-1h)" for 15m-1h charts
• Or use "Auto" mode and it configures automatically
Volume momentum filter is auto-disabled in Scalping mode for faster signals.
Q: What is Volume Momentum and why does it matter?
A: Volume Momentum compares short-term volume (fast MA) to long-term volume (slow MA). It answers: "Is money flowing into this asset faster now than historically?"
Why it matters:
• Volume often leads price (early warning system)
• Confirms institutional participation (smart money)
• No lag like price-based indicators
• More intuitive than complex mathematical filters
When the ratio is above 1.2, you have strong evidence that institutions are accumulating (bullish) or distributing (bearish).
Q: How do I set up alerts?
A: Two options:
Option 1 - Automatic Alerts:
1. Right-click on chart → Add Alert
2. Condition: Select this indicator
3. Choose "Any alert() function call"
4. Configure notification method (app, email, webhook)
5. You'll receive detailed alerts on every BUY and SELL signal
Option 2 - Customizable Alert Conditions:
1. Right-click on chart → Add Alert
2. Condition: Select this indicator
3. You'll see three options in dropdown:
- "BUY Signal" (long signals only)
- "SELL Signal" (short signals only)
- "ANY Signal" (both BUY and SELL)
4. Choose desired option and customize message template
5. Uses TradingView placeholders: {{ticker}}, {{close}}, {{time}}, etc.
All alerts fire only on confirmed bar close (no repaint).
Q: What is Scalpel Mode and should I use it?
A: Scalpel Mode waits for healthy pullbacks within established trends before signaling entry. It reduces whipsaws and improves entry timing.
Recommended ON for:
• Swing traders (want precision entries on pullbacks)
• Day traders (willing to wait for better prices)
• Risk-averse traders (prefer fewer but higher-quality entries)
Recommended OFF for:
• Scalpers (need immediate entries, can't wait for pullbacks)
• Momentum traders (want to enter on breakout, not pullback)
• Aggressive traders (prefer more opportunities over precision)
Q: Why do some duration estimates show wider ranges than others?
A: Range width reflects historical trend variability:
• Narrow range: Similar historical trends had consistent durations (high confidence)
• Wide range: Similar historical trends had varying durations (lower confidence)
Wide ranges often occur:
• Early in analysis (fewer historical trends to learn from)
• In volatile/choppy markets (inconsistent trend behavior)
• On lower timeframes (more noise, less consistency)
The median and average still provide useful targets even when range is wide.
Q: Can I customize the dashboard position and appearance?
A: Yes! Dashboard settings include:
• Position: 9 options (Top/Middle/Bottom + Left/Center/Right)
• Text Size: Auto, Tiny, Small, Normal, Large, Huge
• Show/Hide: Toggle entire dashboard on/off
Choose position that doesn't overlap important price action on your specific chart.
Q: Which timeframe should I trade on?
A: Depends on your trading style and time availability:
• 1-5 minute: Active scalping, requires constant monitoring
• 15m-1h: Day trading, check few times per session
• 4h-Daily: Swing trading, check once or twice daily
• Daily-Weekly: Position trading, check weekly
General principle: Higher timeframes produce:
• Fewer signals (less frequent)
• Higher quality setups (stronger confirmations)
• More reliable duration estimates (better statistical data)
• Less noise (clearer trends)
Start with Daily chart if new to trading. Move to lower timeframes as you gain experience.
Q: Does this work on all markets (stocks, crypto, forex)?
A: Yes, it works on all markets with trending characteristics:
Excellent for:
• Stocks (especially growth and momentum names)
• Crypto (BTC, ETH, major altcoins)
• Futures (indices, commodities)
• Forex majors (EUR/USD, GBP/USD, etc.)
Best results on:
• Trending markets (not range-bound)
• Liquid instruments (tight spreads, good fills)
• Volatile assets (clear trend development)
Less effective on:
• Range-bound/sideways markets
• Ultra-low volatility instruments
• Illiquid small-caps (use caution)
Configure Asset Type (in Advanced analysis mode) to match your instrument for best accuracy.
Q: How many signals should I expect per day/week?
A: Highly variable based on:
By Timeframe:
• 1-5 minute: 5-15 signals per session
• 15m-1h: 2-5 signals per day
• 4h-Daily: 2-5 signals per week
• Daily-Weekly: 1-2 signals per month
By Market Volatility:
• High volatility = more SuperTrend flips = more signals
• Low volatility = fewer flips = fewer signals
By Quality Filter:
• Higher threshold (60-70) = fewer but better signals
• Lower threshold (30-40) = more signals, lower quality
By Volume Momentum Filter:
• Enabled = Fewer signals (only volume-confirmed)
• Disabled = More signals (all SuperTrend flips)
Adjust quality threshold and filters to match your desired signal frequency.
Q: What's the difference between entry labels and info labels?
A:
Entry Labels (BUY/SELL):
• Your primary trading signals
• Based on SuperTrend flip + all confirmations (quality, volume, momentum)
• Include quality score and confirmation icons
• These are actionable entry points
Info Labels (Volume Spike):
• Additional market context
• Show volume events that may support or contradict trend
• 8-bar cooldown to prevent spam
• NOT necessarily entry points - contextual information only
Control separately: Can show entry labels without info labels (recommended for clean charts).
Q: Can I combine this with other indicators?
A: Absolutely! This works well with:
• RSI: For divergences and overbought/oversold conditions
• Support/Resistance: Confluence with key levels
• Fibonacci Retracements: Pullback targets in Scalpel Mode
• Price Action Patterns: Flags, pennants, cup-and-handle
• MACD: Additional momentum confirmation
• Bollinger Bands: Volatility context
This indicator provides trend direction and duration estimates - complement with other tools for entry refinement and additional confluence.
Q: Why did I get a low-quality signal? Can I filter them out?
A: Yes! Increase the Minimum Quality Score in settings.
If you're seeing signals with quality below your preference:
• Day Trading: Set minimum to 50
• Swing Trading: Set minimum to 60
• Position Trading: Set minimum to 70
Only signals meeting the threshold will appear. This reduces frequency but improves win-rate.
Q: How do I interpret the MTF Confluence count?
A: Shows how many of 6 timeframes agree with current trend:
• 6/6 aligned: Perfect agreement (extremely rare, highest confidence)
• 5/6 aligned: Very strong alignment (high confidence)
• 4/6 aligned: Good alignment (standard quality setup)
• 3/6 aligned: Moderate alignment (acceptable)
• 2/6 aligned: Weak alignment (caution)
• 1/6 aligned: Very weak (likely counter-trend)
Higher confluence typically correlates with longer, stronger trends. However, MTF analysis is optional - you can disable it and rely solely on quality scoring.
Q: Is this suitable for beginners?
A: Yes, but requires foundational knowledge:
You should understand:
• Basic trend-following concepts (higher highs, higher lows)
• Risk management principles (position sizing, stop losses)
• How to read candlestick charts
• What volume and volatility mean
Beginner-friendly features:
• Auto preset mode (zero configuration)
• Quality scoring (tells you signal strength)
• Dashboard tooltips (hover for explanations)
• duration analysis boxes (visual profit targets)
Recommended for beginners:
1. Start with "Auto" or "Swing Trading" preset on Daily chart
2. Use Standard Analysis Mode (not Advanced)
3. Set minimum quality to 60 (fewer but better signals)
4. Paper trade first for 2-4 weeks
5. Study methodology references (Minervini, O'Neil, Zanger)
Q: What is the Asset Type setting and why does it matter?
A: Asset Type (in Advanced analysis mode) adjusts duration estimates based on volatility characteristics:
• Small Cap: Explosive moves, extended trends (+30-40%)
• Biotech / Speculative: Parabolic potential, news-driven (+40%)
• Blue Chip / Large Cap: Baseline, steady trends (0% adjustment)
• Tech Growth: Momentum-driven, longer trends (+20%)
• Dividend / Value: Slower, grinding trends (-20%)
• Cyclical: Macro-driven, variable (±10%)
• Crypto / High Volatility: Parabolic potential (+30%)
Correct configuration improves Statistical accuracy by 15-20%. Using Blue Chip settings on a biotech stock may underestimate trend length (you'll exit too early).
Q: Can I backtest this indicator?
A: Yes! TradingView's Strategy Tester works with this indicator's signals.
To backtest:
1. Note the entry conditions (SuperTrend flip + quality threshold + filters)
2. Create a strategy script using same logic
3. Run Strategy Tester on historical data
Additionally, the indicator includes BUILT-IN duration estimate validation:
• System backtests its own duration estimates
• Shows accuracy metrics in dashboard and duration analysis boxes
• Helps assess reliability on your specific symbol/timeframe
Q: Why does Volume Momentum auto-disable in Scalping mode?
A: Scalping requires ultra-fast entries to catch quick moves. Volume Momentum filter adds friction by requiring volume confirmation before signaling, which can cause missed opportunities in rapid scalping.
Scalping preset is optimized for speed and frequency - the filter is counterproductive for that style. It remains enabled for Day Trading, Swing Trading, and Position Trading presets where patience improves results.
You can manually enable it in Custom mode if desired.
Q: How much historical data do I need for accurate duration estimates?
A:
Minimum: 50-100 bars (indicator will function but duration estimates less reliable)
Recommended: 500+ bars (robust statistical database)
Optimal: 1000+ bars (maximum Statistical accuracy)
More history = more completed trends = better pattern matching = more accurate duration estimates.
New symbols or newly-switched timeframes will have lower Statistical accuracy initially. Allow 2-4 weeks for the system to build historical database.
IMPORTANT DISCLAIMERS
No Guarantee of Profit:
This indicator is an educational tool and does not guarantee any specific trading results. All trading involves substantial risk of loss. Duration estimates are statistical calculations based on historical patterns and are not guarantees of future performance.
Past Performance:
Historical backtest results and Statistical accuracy statistics do not guarantee future performance. Market conditions change constantly. What worked historically may not work in current or future markets.
Not Financial Advice:
This indicator provides technical analysis signals and statistical duration estimates only. It is not financial, investment, or trading advice. Always consult with a qualified financial advisor before making investment decisions.
Risk Warning:
Trading stocks, options, futures, forex, and cryptocurrencies involves significant risk. You can lose all of your invested capital. Never trade with money you cannot afford to lose. Only risk capital you can lose without affecting your lifestyle.
Testing Required:
Always test this indicator on a demo account or with paper trading before risking real capital. Understand how it works in different market conditions. Verify Statistical accuracy on your specific instruments and timeframes before trusting it with real money.
User Responsibility:
You are solely responsible for your trading decisions. The developer assumes no liability for trading losses, incorrect duration estimates, software errors, or any other damages incurred while using this indicator.
Statistical Estimation Limitations:
Trend Duration estimates are statistical estimates based on historical pattern matching. They are NOT guarantees. Actual trend durations may differ significantly from duration estimates due to unforeseen news events, market regime changes, or lack of historical precedent for current conditions.
CREDITS & ACKNOWLEDGMENTS
Methodology Inspiration:
• Mark Minervini - Volatility Contraction Pattern (VCP) concepts and pullback entry techniques
• William O'Neil - Volume analysis principles and CANSLIM institutional buying patterns
• Dan Zanger - Momentum breakout strategies and volatility expansion entries
Technical Components:
• SuperTrend calculation - Classic ATR-based trend indicator (public domain)
• Statistical analysis - Standard median, average, range calculations
• k-Nearest Neighbors - Classic machine learning similarity matching concept
• Multi-timeframe analysis - Standard request.security implementation in Pine Script
For questions, feedback, or support, please comment below or send a private message.
Happy Trading!

Scout Regiment - OBV# Scout Regiment - OBV Indicator
## English Documentation
### Overview
Scout Regiment - OBV (On-Balance Volume) is an advanced momentum indicator that combines volume and price movement to identify the strength of buying and selling pressure. This indicator features an oscillator-based approach with divergence detection to help traders spot potential trend reversals and confirm price movements.
### What is OBV?
On-Balance Volume (OBV) is a cumulative volume indicator that adds volume on up days and subtracts volume on down days:
- **Rising OBV**: Accumulation (buying pressure)
- **Falling OBV**: Distribution (selling pressure)
- **OBV Oscillator**: The difference between OBV and its smoothed moving average, making divergences easier to spot
### Key Features
#### 1. **OBV Oscillator Display**
Instead of displaying raw OBV values, this indicator shows the oscillator (difference between OBV and its smoothed line):
**Benefits:**
- Easier to identify divergences
- Clearer trend changes
- More sensitive to momentum shifts
- Zero line as reference point
**Visual Elements:**
- **Step Line**: Main OBV oscillator line
- Green: Positive oscillator (accumulation)
- Red: Negative oscillator (distribution)
- **Histogram**: Visual representation of oscillator strength
- Green bars: Above zero line
- Red bars: Below zero line
- **Zero Line**: White dotted horizontal line as reference
#### 2. **Smoothing Options**
Choose from multiple moving average types to smooth the OBV:
- **None**: Raw OBV (most sensitive)
- **SMA**: Simple Moving Average (equal weight)
- **EMA**: Exponential Moving Average (recent price emphasis) - Default
- **SMMA (RMA)**: Smoothed Moving Average (very smooth)
- **WMA**: Weighted Moving Average (linear weight)
- **VWMA**: Volume Weighted Moving Average (volume emphasis)
**Default Settings:**
- Type: EMA
- Length: 21 periods
- Best for: Most market conditions
#### 3. **Multi-Timeframe Analysis**
- Calculate OBV on any timeframe
- View higher timeframe momentum on lower timeframe charts
- Align trades with larger timeframe volume trends
- Empty field = Current chart timeframe
#### 4. **Visual Enhancements**
**Background Color**
- Light green: Positive oscillator (bullish volume pressure)
- Light red: Negative oscillator (bearish volume pressure)
- Optional display for cleaner charts
**Crossover Labels**
- "突破" (Breakout): When oscillator crosses above zero
- "跌破" (Breakdown): When oscillator crosses below zero
- Indicates potential trend changes
- Can be toggled on/off
#### 5. **Comprehensive Divergence Detection**
The indicator automatically detects four types of divergences:
**Regular Bullish Divergence (Yellow)**
- **Price**: Makes lower lows
- **OBV**: Makes higher lows
- **Signal**: Potential upward reversal
- **Label**: "看涨" (Bullish)
- **Use**: Enter long positions
**Regular Bearish Divergence (Blue)**
- **Price**: Makes higher highs
- **OBV**: Makes lower highs
- **Signal**: Potential downward reversal
- **Label**: "看跌" (Bearish)
- **Use**: Enter short positions or exit longs
**Hidden Bullish Divergence (Light Yellow)**
- **Price**: Makes higher lows
- **OBV**: Makes lower lows
- **Signal**: Trend continuation (uptrend)
- **Label**: "隐藏看涨" (Hidden Bullish)
- **Use**: Add to long positions
**Hidden Bearish Divergence (Light Blue)**
- **Price**: Makes lower highs
- **OBV**: Makes higher highs
- **Signal**: Trend continuation (downtrend)
- **Label**: "隐藏看跌" (Hidden Bearish)
- **Use**: Add to short positions
#### 6. **Customizable Divergence Detection**
**Pivot Lookback Settings:**
- **Left Lookback**: Bars to the left of pivot (default: 5)
- **Right Lookback**: Bars to the right of pivot (default: 5)
- Determines how "extreme" a point must be to qualify as a pivot
**Range Settings:**
- **Maximum Range**: Maximum bars between pivots (default: 60)
- **Minimum Range**: Minimum bars between pivots (default: 5)
- Filters out too-close or too-distant divergences
**Display Options:**
- Toggle regular divergences on/off
- Toggle hidden divergences on/off
- Toggle divergence labels on/off
- Show only the divergences you need
### Configuration Settings
#### Smoothing Settings
- **Smoothing Type**: Choose MA type (None/SMA/EMA/SMMA/WMA/VWMA)
- **Smoothing Length**: Number of periods for smoothing (default: 21)
#### Calculation Settings
- **Timeframe**: Select calculation timeframe (empty = current chart)
#### Display Settings
- **Show OBV Line**: Toggle step line display
- **Show OBV Histogram**: Toggle histogram display
- **Show Background Color**: Toggle background coloring
- **Show Crossover Labels**: Toggle breakout/breakdown labels
#### Divergence Settings
- **Pivot Right Lookback**: Right bars for pivot detection (default: 5)
- **Pivot Left Lookback**: Left bars for pivot detection (default: 5)
- **Range Maximum**: Max bars between divergences (default: 60)
- **Range Minimum**: Min bars between divergences (default: 5)
- **Show Regular Divergences**: Enable/disable regular divergences
- **Show Regular Labels**: Enable/disable regular divergence labels
- **Show Hidden Divergences**: Enable/disable hidden divergences
- **Show Hidden Labels**: Enable/disable hidden divergence labels
### How to Use
#### For Trend Confirmation
1. **Identify Trend with Price**
- Uptrend: Higher highs and higher lows
- Downtrend: Lower highs and lower lows
2. **Confirm with OBV Oscillator**
- Strong uptrend: OBV oscillator staying positive
- Strong downtrend: OBV oscillator staying negative
- Weak trend: OBV oscillator frequently crossing zero
3. **Volume Confirmation**
- Trend with increasing OBV = Strong trend
- Trend with decreasing OBV = Weak trend (watch for reversal)
#### For Divergence Trading
1. **Enable Divergence Detection**
- Start with regular divergences only
- Add hidden divergences for trend continuation
2. **Wait for Divergence Signal**
- Yellow label = Potential bullish reversal
- Blue label = Potential bearish reversal
3. **Confirm with Price Action**
- Wait for support/resistance break
- Look for candlestick confirmation
- Check higher timeframe alignment
4. **Enter Trade**
- Enter after confirmation
- Set stop loss beyond recent swing
- Target based on previous swing or support/resistance
#### For Breakout Trading
1. **Enable Crossover Labels**
- Identify when oscillator crosses zero line
2. **Confirm Volume Strength**
- Strong breakouts have large oscillator moves
- Weak breakouts barely cross zero
3. **Trade Direction**
- "突破" label = Enter long
- "跌破" label = Enter short
4. **Manage Position**
- Exit when oscillator crosses back
- Use price structure for stops
#### For Multi-Timeframe Analysis
1. **Set Higher Timeframe**
- Example: On 15min chart, set timeframe to 1H or 4H
2. **Identify Higher Timeframe Trend**
- Positive oscillator = Uptrend bias
- Negative oscillator = Downtrend bias
3. **Trade with the Trend**
- Only take long signals in uptrend
- Only take short signals in downtrend
4. **Time Entries**
- Use current timeframe for precise entry
- Confirm with higher timeframe direction
### Trading Strategies
#### Strategy 1: Regular Divergence Reversal
**Setup:**
1. Price in strong trend (up or down)
2. Regular divergence appears
3. Price reaches support/resistance level
**Entry:**
- Bullish: After "看涨" label, when price breaks above recent high
- Bearish: After "看跌" label, when price breaks below recent low
**Stop Loss:**
- Bullish: Below divergence low
- Bearish: Above divergence high
**Exit:**
- Take profit at next major support/resistance
- Or when opposite divergence appears
**Best For:** Swing trading, reversal trading
#### Strategy 2: Hidden Divergence Continuation
**Setup:**
1. Clear trend established
2. Price pulls back (retracement)
3. Hidden divergence appears
**Entry:**
- Bullish: After "隐藏看涨" label, when price resumes uptrend
- Bearish: After "隐藏看跌" label, when price resumes downtrend
**Stop Loss:**
- Behind the pullback swing point
**Exit:**
- Trail stop as trend continues
- Exit on regular divergence (reversal signal)
**Best For:** Trend following, adding to positions
#### Strategy 3: Zero Line Crossover
**Setup:**
1. Enable crossover labels
2. Oscillator crosses zero line
3. Confirm with price structure break
**Entry:**
- "突破" label = Buy signal
- "跌破" label = Sell signal
**Stop Loss:**
- Below/above recent swing
**Exit:**
- When oscillator crosses back over zero
- Or at predetermined target
**Best For:** Momentum trading, quick trades
#### Strategy 4: Multi-Timeframe Confluence
**Setup:**
1. Set indicator to higher timeframe (e.g., 4H on 1H chart)
2. Wait for higher TF oscillator to be positive (uptrend) or negative (downtrend)
3. Look for entries on current timeframe aligned with higher TF
**Entry:**
- Long: When both timeframes show positive oscillator or bullish divergence
- Short: When both timeframes show negative oscillator or bearish divergence
**Stop Loss:**
- Based on current timeframe structure
**Exit:**
- When higher timeframe oscillator turns negative (for longs) or positive (for shorts)
**Best For:** Swing trading, high-probability setups
### Best Practices
#### Volume Analysis
1. **Strong Moves Need Volume**
- Price increase + Rising OBV = Healthy uptrend
- Price increase + Falling OBV = Weak uptrend (warning)
2. **Watch for Confirmation**
- New highs with new OBV highs = Confirmed
- New highs without new OBV highs = Potential divergence
3. **Consider Context**
- Low volume periods (Asian session, holidays) = Less reliable
- High volume periods (News, London/NY overlap) = More reliable
#### Divergence Trading Tips
1. **Not All Divergences Work**
- Wait for price confirmation
- Stronger in oversold/overbought areas
- Better at support/resistance levels
2. **Multiple Divergences**
- Multiple divergences on same trend = Stronger signal
- Quick divergence failures = Ignore and wait for next
3. **Timeframe Matters**
- Higher timeframe divergences = More reliable
- Lower timeframe divergences = More frequent, less reliable
#### Smoothing Selection
1. **No Smoothing (None)**
- Most sensitive, more signals
- More noise, more false signals
- Best for: Scalping, very active trading
2. **EMA (Default)**
- Balanced approach
- Good for most strategies
- Best for: Swing trading, day trading
3. **SMMA (RMA)**
- Very smooth, fewer signals
- Less responsive to sudden changes
- Best for: Position trading, longer timeframes
### Indicator Combinations
**With Moving Averages:**
- Use EMAs for trend direction
- OBV for volume confirmation
- Enter when both align
**With RSI:**
- RSI for overbought/oversold
- OBV for volume confirmation
- Divergences on both = Stronger signal
**With Price Action:**
- Support/resistance for levels
- OBV for strength confirmation
- Breakouts with positive OBV = More likely to succeed
**With Bias Indicator:**
- Bias for price deviation
- OBV for volume confirmation
- Both showing divergence = High probability reversal
### Common Patterns
1. **Accumulation**: OBV rising while price consolidates (breakout likely)
2. **Distribution**: OBV falling while price consolidates (breakdown likely)
3. **Confirmation**: OBV and price both making new highs/lows (trend strong)
4. **Divergence**: OBV and price moving opposite directions (reversal warning)
5. **False Breakout**: Price breaks but OBV doesn't confirm (likely to fail)
### Performance Tips
- Disable unused display features for faster loading
- Start with regular divergences only, add hidden later
- Use histogram for quick visual reference
- Enable crossover labels for clear entry signals
- Test different smoothing lengths for your market
### Alert Conditions
The indicator includes alerts for:
- Regular bullish divergence detected
- Regular bearish divergence detected
- Hidden bullish divergence detected
- Hidden bearish divergence detected
**How to Set Alerts:**
1. Click on the indicator name
2. Select "Add Alert"
3. Choose condition
4. Configure notification method
---
## 中文说明文档
### 概述
Scout Regiment - OBV(能量潮)是一个高级动量指标,结合成交量和价格变动来识别买卖压力的强度。该指标采用振荡器方法并具有背离检测功能,帮助交易者发现潜在的趋势反转并确认价格走势。
### 什么是OBV?
能量潮(OBV)是一个累积成交量指标,在上涨日累加成交量,在下跌日减去成交量:
- **上升的OBV**:积累(买入压力)
- **下降的OBV**:派发(卖出压力)
- **OBV振荡器**:OBV与其平滑移动平均线之间的差值,使背离更容易识别
### 核心功能
#### 1. **OBV振荡器显示**
该指标不显示原始OBV值,而是显示振荡器(OBV与其平滑线之间的差值):
**优势:**
- 更容易识别背离
- 趋势变化更清晰
- 对动量变化更敏感
- 零线作为参考点
**视觉元素:**
- **阶梯线**:主OBV振荡器线
- 绿色:正振荡器(积累)
- 红色:负振荡器(派发)
- **柱状图**:振荡器强度的可视化表示
- 绿色柱:零线以上
- 红色柱:零线以下
- **零线**:白色虚线作为参考
#### 2. **平滑选项**
选择多种移动平均类型来平滑OBV:
- **None**:原始OBV(最敏感)
- **SMA**:简单移动平均(等权重)
- **EMA**:指数移动平均(强调近期价格)- 默认
- **SMMA (RMA)**:平滑移动平均(非常平滑)
- **WMA**:加权移动平均(线性权重)
- **VWMA**:成交量加权移动平均(强调成交量)
**默认设置:**
- 类型:EMA
- 长度:21周期
- 适合:大多数市场状况
#### 3. **多时间框架分析**
- 在任何时间框架上计算OBV
- 在低时间框架图表上查看高时间框架动量
- 使交易与更大时间框架的成交量趋势保持一致
- 空字段 = 当前图表时间框架
#### 4. **视觉增强**
**背景颜色**
- 浅绿色:正振荡器(看涨成交量压力)
- 浅红色:负振荡器(看跌成交量压力)
- 可选显示,图表更清爽
**穿越标签**
- "突破":振荡器向上穿越零线
- "跌破":振荡器向下穿越零线
- 指示潜在趋势变化
- 可开关
#### 5. **全面的背离检测**
指标自动检测四种类型的背离:
**常规看涨背离(黄色)**
- **价格**:创新低
- **OBV**:创更高的低点
- **信号**:潜在向上反转
- **标签**:"看涨"
- **用途**:进入多头仓位
**常规看跌背离(蓝色)**
- **价格**:创新高
- **OBV**:创更低的高点
- **信号**:潜在向下反转
- **标签**:"看跌"
- **用途**:进入空头仓位或退出多头
**隐藏看涨背离(浅黄色)**
- **价格**:创更高的低点
- **OBV**:创更低的低点
- **信号**:趋势延续(上升趋势)
- **标签**:"隐藏看涨"
- **用途**:加仓多头
**隐藏看跌背离(浅蓝色)**
- **价格**:创更低的高点
- **OBV**:创更高的高点
- **信号**:趋势延续(下降趋势)
- **标签**:"隐藏看跌"
- **用途**:加仓空头
#### 6. **可自定义的背离检测**
**枢轴回溯设置:**
- **左侧回溯**:枢轴点左侧K线数(默认:5)
- **右侧回溯**:枢轴点右侧K线数(默认:5)
- 决定一个点要多"极端"才能成为枢轴点
**范围设置:**
- **最大范围**:枢轴点之间最大K线数(默认:60)
- **最小范围**:枢轴点之间最小K线数(默认:5)
- 过滤太近或太远的背离
**显示选项:**
- 开关常规背离
- 开关隐藏背离
- 开关背离标签
- 只显示需要的背离
### 配置设置
#### 平滑设置
- **平滑类型**:选择MA类型(None/SMA/EMA/SMMA/WMA/VWMA)
- **平滑长度**:平滑周期数(默认:21)
#### 计算设置
- **时间周期**:选择计算时间框架(空 = 当前图表)
#### 显示设置
- **显示OBV点线**:切换阶梯线显示
- **显示OBV柱状图**:切换柱状图显示
- **显示背景颜色**:切换背景着色
- **显示突破标签**:切换突破/跌破标签
#### 背离设置
- **枢轴右侧回溯**:枢轴检测右侧K线数(默认:5)
- **枢轴左侧回溯**:枢轴检测左侧K线数(默认:5)
- **回看范围最大值**:背离之间最大K线数(默认:60)
- **回看范围最小值**:背离之间最小K线数(默认:5)
- **显示常规背离**:启用/禁用常规背离
- **显示常规背离标签**:启用/禁用常规背离标签
- **显示隐藏背离**:启用/禁用隐藏背离
- **显示隐藏背离标签**:启用/禁用隐藏背离标签
### 使用方法
#### 趋势确认
1. **用价格识别趋势**
- 上升趋势:更高的高点和更高的低点
- 下降趋势:更低的高点和更低的低点
2. **用OBV振荡器确认**
- 强劲上升趋势:OBV振荡器保持正值
- 强劲下降趋势:OBV振荡器保持负值
- 弱势趋势:OBV振荡器频繁穿越零线
3. **成交量确认**
- 趋势伴随上升的OBV = 强趋势
- 趋势伴随下降的OBV = 弱趋势(注意反转)
#### 背离交易
1. **启用背离检测**
- 先从常规背离开始
- 添加隐藏背离用于趋势延续
2. **等待背离信号**
- 黄色标签 = 潜在看涨反转
- 蓝色标签 = 潜在看跌反转
3. **用价格行为确认**
- 等待支撑/阻力突破
- 寻找K线确认
- 检查更高时间框架对齐
4. **进入交易**
- 确认后进入
- 在近期波动之外设置止损
- 基于前一波动或支撑/阻力设定目标
#### 突破交易
1. **启用穿越标签**
- 识别振荡器何时穿越零线
2. **确认成交量强度**
- 强突破有大振荡器移动
- 弱突破勉强穿越零线
3. **交易方向**
- "突破"标签 = 进入多头
- "跌破"标签 = 进入空头
4. **管理仓位**
- 振荡器反向穿越时退出
- 使用价格结构设置止损
#### 多时间框架分析
1. **设置更高时间框架**
- 例如:在15分钟图上,设置时间框架为1H或4H
2. **识别更高时间框架趋势**
- 正振荡器 = 上升趋势偏向
- 负振荡器 = 下降趋势偏向
3. **顺趋势交易**
- 仅在上升趋势中接受多头信号
- 仅在下降趋势中接受空头信号
4. **把握入场时机**
- 使用当前时间框架进行精确进入
- 用更高时间框架方向确认
### 交易策略
#### 策略1:常规背离反转
**设置:**
1. 价格处于强趋势(上涨或下跌)
2. 出现常规背离
3. 价格到达支撑/阻力水平
**入场:**
- 看涨:在"看涨"标签后,价格突破近期高点时
- 看跌:在"看跌"标签后,价格跌破近期低点时
**止损:**
- 看涨:背离低点之下
- 看跌:背离高点之上
**退出:**
- 在下一个主要支撑/阻力获利
- 或出现相反背离时
**适合:**波段交易、反转交易
#### 策略2:隐藏背离延续
**设置:**
1. 建立明确趋势
2. 价格回调(回撤)
3. 出现隐藏背离
**入场:**
- 看涨:在"隐藏看涨"标签后,价格恢复上升趋势时
- 看跌:在"隐藏看跌"标签后,价格恢复下降趋势时
**止损:**
- 在回调波动点之后
**退出:**
- 随着趋势延续移动止损
- 出现常规背离(反转信号)时退出
**适合:**趋势跟随、加仓
#### 策略3:零线穿越
**设置:**
1. 启用穿越标签
2. 振荡器穿越零线
3. 用价格结构突破确认
**入场:**
- "突破"标签 = 买入信号
- "跌破"标签 = 卖出信号
**止损:**
- 近期波动之下/之上
**退出:**
- 振荡器反向穿越零线时
- 或在预定目标
**适合:**动量交易、快速交易
#### 策略4:多时间框架汇合
**设置:**
1. 设置指标到更高时间框架(例如,在1H图上设置4H)
2. 等待更高TF振荡器为正(上升趋势)或负(下降趋势)
3. 在当前时间框架上寻找与更高TF一致的入场机会
**入场:**
- 多头:两个时间框架都显示正振荡器或看涨背离时
- 空头:两个时间框架都显示负振荡器或看跌背离时
**止损:**
- 基于当前时间框架结构
**退出:**
- 更高时间框架振荡器变为负(多头)或正(空头)时
**适合:**波段交易、高概率设置
### 最佳实践
#### 成交量分析
1. **强势波动需要成交量**
- 价格上涨 + 上升的OBV = 健康上升趋势
- 价格上涨 + 下降的OBV = 弱上升趋势(警告)
2. **注意确认**
- 新高伴随新OBV高点 = 已确认
- 新高没有新OBV高点 = 潜在背离
3. **考虑背景**
- 低成交量期(亚洲时段、假期)= 可靠性较低
- 高成交量期(新闻、伦敦/纽约重叠)= 更可靠
#### 背离交易技巧
1. **不是所有背离都有效**
- 等待价格确认
- 在超卖/超买区域更强
- 在支撑/阻力水平更好
2. **多重背离**
- 同一趋势上多个背离 = 更强信号
- 背离快速失败 = 忽略并等待下一个
3. **时间框架重要**
- 更高时间框架背离 = 更可靠
- 更低时间框架背离 = 更频繁,可靠性较低
#### 平滑选择
1. **无平滑(None)**
- 最敏感,更多信号
- 更多噪音,更多假信号
- 适合:剥头皮、非常活跃的交易
2. **EMA(默认)**
- 平衡方法
- 适合大多数策略
- 适合:波段交易、日内交易
3. **SMMA (RMA)**
- 非常平滑,更少信号
- 对突然变化响应较慢
- 适合:仓位交易、更长时间框架
### 指标组合
**与移动平均线配合:**
- 使用EMA确定趋势方向
- OBV确认成交量
- 两者一致时进入
**与RSI配合:**
- RSI用于超买超卖
- OBV用于成交量确认
- 两者都背离 = 更强信号
**与价格行为配合:**
- 支撑/阻力确定水平
- OBV确认强度
- 正OBV的突破 = 更可能成功
**与Bias指标配合:**
- Bias用于价格偏离
- OBV用于成交量确认
- 两者都显示背离 = 高概率反转
### 常见形态
1. **积累**:OBV上升而价格盘整(突破可能)
2. **派发**:OBV下降而价格盘整(跌破可能)
3. **确认**:OBV和价格都创新高/新低(趋势强劲)
4. **背离**:OBV和价格反向移动(反转警告)
5. **假突破**:价格突破但OBV不确认(可能失败)
### 性能提示
- 禁用未使用的显示功能以加快加载
- 先从常规背离开始,稍后添加隐藏背离
- 使用柱状图快速视觉参考
- 启用穿越标签以获得清晰的入场信号
- 为您的市场测试不同的平滑长度
### 警报条件
指标包含以下警报:
- 检测到常规看涨背离
- 检测到常规看跌背离
- 检测到隐藏看涨背离
- 检测到隐藏看跌背离
**如何设置警报:**
1. 点击指标名称
2. 选择"添加警报"
3. 选择条件
4. 配置通知方法
---
## Technical Support
For questions or issues, please refer to the TradingView community or contact the indicator creator.
## 技术支持
如有问题,请参考TradingView社区或联系指标创建者。

DMV Volume Volume Radar SIMPLEThis indicator helps identify early signs of accumulation, breakout, and distribution by analyzing relative volume and price action within defined ranges.
It detects:
🔵 ACCUM: High relative volume with buying pressure near support (early accumulation)
🟢 BRK: High relative volume near range high with bullish price action (potential breakout)
🔴 DIST: High relative volume with selling pressure near range high (distribution / potential reversal)
How it works:
Measures relative volume vs. a moving average
Builds a dynamic price range using recent swing highs/lows
Looks for wick behavior + location in range to validate signals
Color-codes candles and adds labels for quick visualization
Optional alert conditions are baked in for automated notifications
Perfect for:
Pre-breakout positioning
Spotting smart-money accumulation
Identifying distribution zones for exits or reversals
Works best on 15m–4h timeframes for crypto and alts

Twiggs Go Money Flow Enhanced [KingThies]█ OVERVIEW
The Twiggs Money Flow (TMF) is a volume-weighted momentum oscillator that
measures buying and sellistng pressure by analyzing where price closes within
each bar's true range. It's an enhanced version of Chaikin Money Flow that
uses Wilder's smoothing method, providing better trend persistence and
smoother signals.
The indicator oscillates around a zero listne:
Values above zero indicate accumulation (buying pressure)
Values below zero indicate distribution (sellistng pressure)
TMF was developed by Colistn Twiggs as an improvement over traditional money
flow indicators by incorporating true range calculations and Wilder's
exponential moving average.
█ CONCEPTS
True Range Boundaries
TMF calculates a modified true range for each bar by comparing the current
bar's high and low with the previous close:
True Range High = maximum of (previous close, current high)
True Range Low = minimum of (previous close, current low)
This accounts for overnight gaps and ensures price continuity between bars.
Average Daily Value (ADV)
The ADV represents the portion of volume attributable to buying versus sellistng:
ADV = Volume × ((Close - TR Low) - (TR High - Close)) / True Range
When price closes near the high of the true range, ADV is positive and large.
When price closes near the low, ADV is negative and large.
A close in the middle produces values near zero.
Wilder's Moving Average
Unlistke simple moving averages, Wilder's smoothing method gives more weight
to recent values while maintaining memory of historical data:
WMA = (Previous WMA × (Period - 1) + Current Value) / Period
This creates smoother trends that are less prone to whipsaws than standard
moving averages.
Final Calculation
TMF = Wilder's MA(ADV, Period) / Wilder's MA(Volume, Period)
By dividing smoothed ADV by smoothed volume, TMF normalistzes the reading and
makes it comparable across different securities and timeframes.
█ HOW TO USE
Zero listne Crossovers
The most straightforward trading signals:
A cross above zero suggests buyers are gaining control.
Consider this a bullistsh signal, especially when confirmed by price action.
A cross below zero suggests sellers are gaining control.
Consider this a bearish signal.
The longer TMF remains above or below zero, the stronger the trend.
Extreme Values
Strong positive or negative readings indicate intense buying or sellistng pressure:
Sustained high positive values (above +0.4) suggest strong accumulation
but may also indicate overbought conditions.
Sustained low negative values (below -0.4) suggest strong distribution
but may also indicate oversold conditions.
These extremes work best when used in conjunction with price levels and
support/resistance zones.
Divergences
Divergences between price and TMF often signal potential reversals:
Bearish divergence: Price makes a higher high but TMF makes a
lower high — suggests buying pressure is weakening despite rising prices.
Bullistsh divergence: Price makes a lower low but TMF makes a
higher low — suggests sellistng pressure is weakening despite fallistng prices.
Trend Confirmation
Use TMF to confirm the strength of existing trends:
In an uptrend, TMF should remain mostly positive with occasional dips below zero.
In a downtrend, TMF should remain mostly negative with occasional rises above zero.
If TMF contradicts the price trend, consider the trend weak or potentially ending.
█ FEATURES
Period (default: 21)
The lookback length for Wilder's moving average calculation:
Shorter periods (10–15) make TMF more responsive to recent changes but
increase noise and false signals.
Longer periods (30–50) create smoother readings but lag price action more
significantly.
The default 21-period setting balances responsiveness with relistabilistty.
Consider adjusting the period based on your trading timeframe and the
volatilistty of the security you're analyzing.
█ LIMITATIONS
TMF is a lagging indicator due to its smoothing method. Signals may occur
after optimal entry or exit points.
In low-volume or illistquid markets, TMF can produce erratic readings that
may not reflect true buying or sellistng pressure.
Ranging or choppy markets often generate frequent zero-listne crosses that
can lead to whipsaws.
listke all volume-based indicators, TMF's relistabilistty depends on accurate
volume data.
For securities with unrelistable volume reporting, consider using
price-based momentum indicators instead.
█ NOTES
This indicator uses area-style plotting in the original version to visualistze
the magnitude of buying and sellistng pressure. The filled area makes it easy
to see at a glance whether the market is in accumulation or distribution mode.
TMF works on any timeframe but tends to be most relistable on daily charts
where volume data is most accurate and meaningful.
█ CREDITS
Original indicator developed by
LazyBear .
Based on the Twiggs Money Flow concept from Incredible Charts:
Incredible Charts – Twiggs Money Flow .
