"Volume" için komut dosyalarını ara
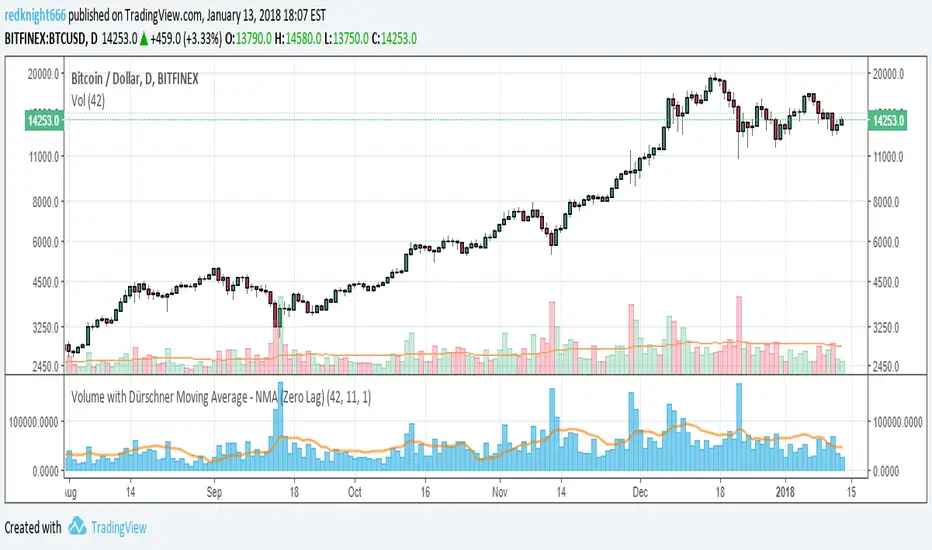
Volume with Dürschner Moving Average - NMA (Zero Lag)Volume with Dürschner Moving Average - NMA (Zero Lag)
This moving average over the Volume follows the Nyquist Sampling Criterion making showing even better behavior on high volatility environments than the Ehlers & Ric's "Zero Lag Moving Average".
Applies the same formulae as the moving average at Zero-lag Dürschner Moving Average
From the paper abstract: "The well-known Moving Averages (MA), namely the Simple Moving Average ( SMA ), the Exponential Moving Average ( EMA ) and the Weighted Moving Average ( WMA ), are modified in this paper with the help of the Nyquist Criterion. These modified Moving Averages 3.0 show good smoothing characteristics, illustrate relevant trends and trend reversals in price series without a time lag as far as calculated. With regard to smoothing, trend patterns and time lag bring about a significant improvement on conventional SMA (Moving Averages 1.0: SMA , EMA and WMA ). In addition to this, the efficiency of the Moving Averages 3.0 is demonstrated by applying several tests and a simple trading system."
The Dürschner Moving Average was published at the IFTA 2012 (International Federation of Technical Analysts) Journal, page 27.
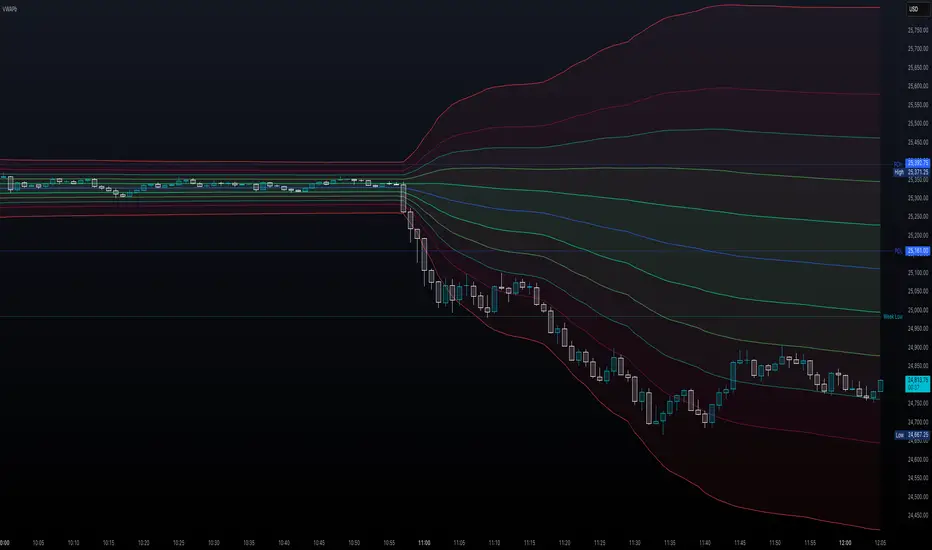
Volume Weighted Average Price Band Extension## Volume Weighted Average Price Band Extension (VWAPb)
**Volume Weighted Average Price Band Extension** is an enhanced VWAP indicator that extends the traditional three-band system to include up to **five configurable standard deviation bands**, making it particularly well-suited for analyzing volatile market conditions where price action frequently extends beyond conventional boundaries.
### Key Features
**Extended Band System**
Unlike standard VWAP indicators that typically offer three bands, this indicator provides five independently configurable bands with customizable multipliers (default: 0.5x, 1.0x, 1.5x, 2.0x, and 3.0x). Each band can be toggled on or off, allowing traders to adapt the display to current market volatility and their specific trading strategy.
**Dual Calculation Modes**
The indicator offers flexibility in how bands are calculated:
- **Standard Deviation Mode**: Traditional statistical approach measuring price dispersion from the VWAP
- **Percentage Mode**: Distance calculated as a percentage of VWAP (1 multiplier = 1%), useful for comparing relative moves across different price levels
**Flexible Anchor Periods**
Calculate VWAP from multiple timeframes and events:
- Time-based: Session, Week, Month, Quarter, Year, Decade, Century
- Event-based: Earnings reports, Dividend announcements, Stock splits
- Customizable source (default: hlc3)
**Visual Clarity**
Color-coded bands with semi-transparent fills between upper and lower boundaries help identify key support and resistance zones at a glance. The indicator automatically hides on daily and higher timeframes when enabled, keeping charts clean.
### Ideal For
- **Volatile Markets**: The extended band system captures extreme price movements that often exceed traditional 2-3 standard deviation bounds
- **Scalping & Day Trading**: Multiple bands provide granular entry and exit zones for short-term trades
- **Mean Reversion Strategies**: Identify overextended price action relative to volume-weighted fair value
- **Institutional Order Flow Analysis**: VWAP remains a key benchmark for institutional execution
### How It Works
The Volume Weighted Average Price represents the average price weighted by volume throughout the selected anchor period. The surrounding bands act as dynamic support and resistance levels, with each successive band representing areas of increasing deviation from the volume-weighted mean. In volatile conditions, price may regularly test the outer bands (2.0x, 3.0x), which would be invisible on standard three-band implementations.
**Trading Applications:**
- Price near outer bands (±2.0x, ±3.0x) may signal exhaustion and potential reversal opportunities
- Price oscillating between inner bands (±0.5x, ±1.0x) indicates consolidation
- VWAP itself acts as a dynamic pivot point—bullish above, bearish below
### Settings Overview
- **VWAP Settings**: Anchor period selection, source input, offset capability, option to hide on D/W/M timeframes
- **Bands Settings**: Toggle each of the five bands independently, adjust multipliers, choose between Standard Deviation or Percentage calculation mode
---
**Note**: This indicator requires volume data to function properly. A runtime error will display if volume data is unavailable for the selected symbol.
**Disclaimer**: This indicator is designed for technical analysis and should be used in conjunction with other forms of analysis and proper risk management. Past performance and indicator signals do not guarantee future results.
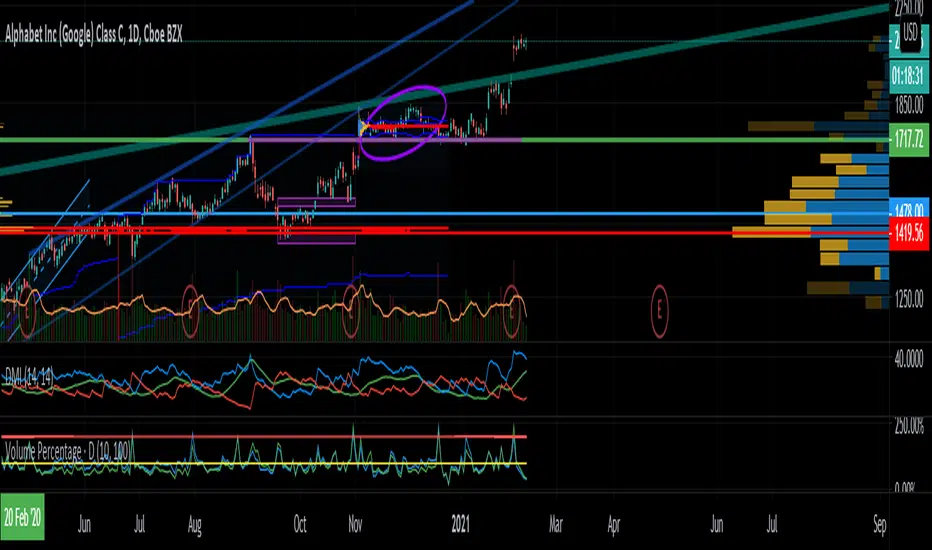
Volume PercentageVolume percentage oscillator that compares the current volume value with the average of each two periods of volume, one fast (10 days) and one slow (100 days).
There are two horizontal lines that are a good visual guide, one in 100% and the other in 200%, which are very useful.
Special thanks to rick_decard.
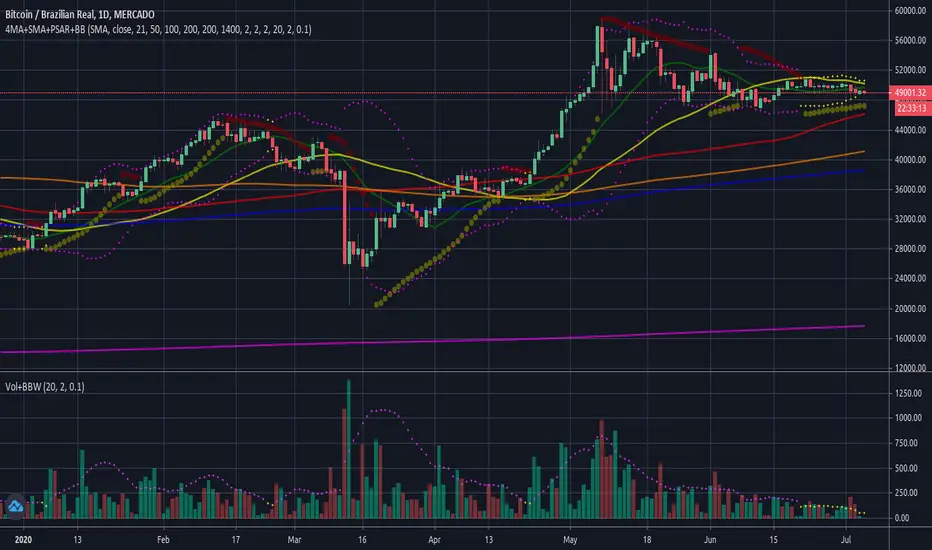
Volume BreakoutVolume breakout against pivot, make sure that price closes above pivot within the next few candles from purple/blue candle.

Volume X-ray [LucF]█ OVERVIEW
This tool analyzes the relative size of volume reported on intraday vs EOD (end of day) data feeds on historical bars. If you use volume data to make trading decisions, it can help you improve your understanding of its nature and quality, which is especially important if you trade on intraday timeframes.
I often mention, when discussing volume analysis, how it's important for traders to understand the volume data they are using: where it originates, what it includes and does not include. By helping you spot sizeable differences between volume reported on intraday and EOD data feeds for any given instrument, "Volume X-ray" can point you to instruments where you might want to research the causes of the difference.
█ CONCEPTS
The information used to build a chart's historical bars originates from data providers (exchanges, brokers, etc.) who often maintain distinct historical feeds for intraday and EOD timeframes. How volume data is assembled for intraday and EOD feeds varies with instruments, brokers and exchanges. Variations between the two feeds — or their absence — can be due to how instruments are traded in a particular sector and/or the volume reporting policy for the feeds you are using. Instruments from crypto and forex markets, for example, will often display similar volume on both feeds. Stocks will often display variations because block trades or other types of trades may not be included in their intraday volume data. Futures will also typically display variations. It is even possible that volume from different feeds may not be of the same nature, as you can get trade volume (market volume) on one feed and tick volume (transaction counts) on another. You will sometimes be able to find the details of what different feeds contain from the technical information provided by exchanges/brokers on their feeds. This is an example for the NASDAQ feeds . Once you determine which feeds you are using, you can look for the reporting specs for that feed. This is all research you will need to do on your own; "Volume X-ray" will not help you with that part.
You may elect to forego the deep dive in feed information and simply rely on the figure the indicator will calculate for the instruments you trade. One simple — and unproven — way to interpret "Volume X-ray" values is to infer that instruments with larger percentages of intraday/EOD volume ratios are more "democratic" because at intraday timeframes, you are seeing a greater proportion of the actual traded volume for the instrument. This could conceivably lead one to conclude that such volume data is more reliable than on an instrument where intraday volume accounts for only 3% of EOD volume, let's say.
Note that as intraday vs EOD variations exist for historical bars on some instruments, there will typically also be differences between the realtime feeds used on intraday vs 1D or greater timeframes for those same assets. Realtime reporting rules will often be different from historical feed reporting rules, so variations between realtime feeds will often be different from the variations between historical feeds for the same instrument. A deep dive in reporting rules will quickly reveal what a jungle they are for some instruments, yet it is the only way to really understand the volume information our charts display.
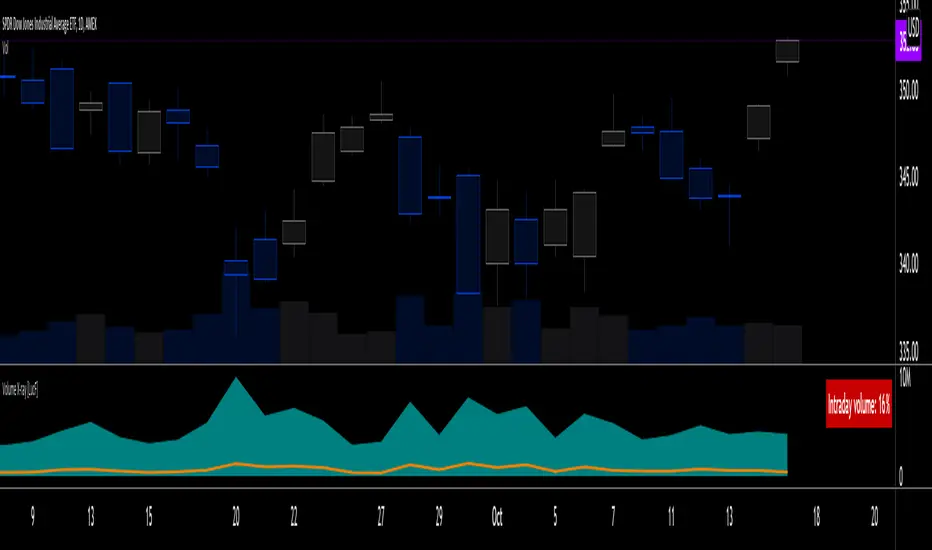
█ HOW TO USE IT
The script is very simple and has no inputs. Just add it to 1D charts and it will calculate the proportion of volume reported on the intraday feed over the EOD volume. The plots show the daily values for both volumes: the teal area is the EOD volume, the orange line is the intraday volume. A value representing the average, cumulative intraday/EOD volume percentage for the chart is displayed in the upper-right corner. Its background color changes with the percentage, with brightness levels proportional to the percentage for both the bull color (% >= 50) or the bear color (% < 50). When abnormal conditions are detected, such as missing volume of one kind or the other, a yellow background is used.
Daily and cumulative values are displayed in indicator values and the Data Window.
The indicator loads in a pane, but you can also use it in overlay mode by moving it on the chart with "Move to" in the script's "More" menu, and disabling the plot display from the "Settings/Style" tab.
█ LIMITATIONS
• The script will not run on timeframes >1D because it cannot produce useful values on them.
• The calculation of the cumulative average will vary on different intraday timeframes because of the varying number of days covered by the dataset.
Variations can also occur because of irregularities in reported volume data. That is the reason I recommend using it on 1D charts.
• The script only calculates on historical bars because in real time there is no distinction between intraday and EOD feeds.
• You will see plenty of special cases if you use the indicator on a variety of instruments:
• Some instruments have no intraday volume, while on others it's the opposite.
• Missing information will sometimes appear here and there on datasets.
• Some instruments have higher intraday than EOD volume.
Please do not ask me the reasons for these anomalies; it's your responsibility to find them. I supply a tool that will spot the anomalies for you — nothing more.
█ FOR PINE CODERS
• This script uses a little-known feature of request.security() , which allows us to specify `"1440"` for the `timeframe` argument.
When you do, data from the 1min intrabars of the historical intraday feed is aggregated over one day, as opposed to the usual EOD feed used with `"D"`.
• I use gaps on my request.security() calls. This is useful because at intraday timeframes I can cumulate non- na values only.
• I use fixnan() on some values. For those who don't know about it yet, it eliminates na values from a series, just like not using gaps will do in a request.security() call.
• I like how the new switch structure makes for more readable code than equivalent if structures.
• I wrote my script using the revised recommendations in the Style Guide from the Pine v5 User Manual.
• I use the new runtime.error() to throw an error when the script user tries to use a timeframe >1D.
Why? Because then, my request.security() calls would be returning values from the last 1D intrabar of the dilation of the, let's say, 1W chart bar.
This of course would be of no use whatsoever — and misleading. I encourage all Pine coders fetching HTF data to protect their script users in the same way.
As tool builders, it is our responsibility to shield unsuspecting users of our scripts from contexts where our calcs produce invalid results.
• While we're on the subject of accessing intrabar timeframes, I will add this to the intention of coders falling victim to what appears to be
a new misconception where the mere fact of using intrabar timeframes with request.security() is believed to provide some sort of edge.
This is a fallacy unless you are sending down functions specifically designed to mine values from request.security() 's intrabar context.
These coders do not seem to realize that:
• They are only retrieving information from the last intrabar of the chart bar.
• The already flawed behavior of their scripts on historical bars will not improve on realtime bars. It will actually worsen because in real time,
intrabars are not yet ordered sequentially as they are on historical bars.
• Alerts or strategy orders using intrabar information acquired through request.security() will be using flawed logic and data most of the time.
The situation reminds me of the mania where using Heikin-Ashi charts to backtest was all the rage because it produced magnificent — and flawed — results.
Trading is difficult enough when doing the right things; I hate to see traders infected by lethal beliefs.
Strive to sharpen your "herd immunity", as Lionel Shriver calls it. She also writes: "Be leery of orthodoxy. Hold back from shared cultural enthusiasms."
Be your own trader.
█ THANKS
This indicator would not exist without the invaluable insights from Tim, a member of the Pine team. Thanks Tim!
Volume Bulls vs Bears (Improved)The "Volume Bulls vs Bears (Improved)" is a raw and powerful volume-based indicator for TradingView that visualizes market participation by separating volume into "bullish" and "bearish" components. It provides a clear and visually appealing stacked histogram alongside a moving average of total volume, helping traders identify trends in market participation.
Key Features
Bullish vs Bearish Volume Separation:
Bullish Volume: Represents the portion of volume contributed by buyers (when prices move up).
Bearish Volume: Represents the portion of volume contributed by sellers (when prices move down).
Volume is calculated based on price action within the range of the candle:
Bulls = ((Close - Low) / (High - Low)) * Total Volume
Bears = ((High - Close) / (High - Low)) * Total Volume
Stacked Histogram:
Bullish and bearish volumes are plotted as a stacked histogram.
Bull Color: Green (default).
Bear Color: Red (default).
This makes it easy to spot shifts in volume dominance between bulls and bears.
Volume SMA:
A Simple Moving Average (SMA) of total volume over a user-defined period helps smooth out fluctuations and shows overall volume trends.
Default period is 20 bars.
SMA Line: Yellow (default), adjustable in width.
User-Customizable Inputs:
Volume SMA Period: Adjust the lookback period for the moving average.
Bull/Bear Colors: Customizable histogram colors.
SMA Line Color and Width: Allows flexibility for better chart aesthetics.
Non-Overlapping Visuals:
The histogram avoids overlap, ensuring clarity by visually stacking bullish and bearish volumes.
How to Use the Indicator
Identify Bullish Volume Dominance:
If the green (bullish) volume bars are larger, it indicates stronger buying pressure within the candle range.
Identify Bearish Volume Dominance:
If the red (bearish) volume bars are larger, it signals stronger selling pressure.
Volume Trend:
Use the Volume SMA line to identify whether overall volume is increasing, decreasing, or staying stable. Rising volume typically strengthens trends, while declining volume can indicate weakness.
Use Cases
Spotting volume trends that confirm price movements (e.g., rising prices with rising bullish volume).
Recognizing potential reversals when bearish volume starts dominating previously bullish candles.
Identifying accumulation or distribution phases by analyzing volume behavior.
Conclusion
This "Volume Bulls vs Bears (Improved)" indicator provides traders with deeper insights into market participation. Its raw, no-frills design offers clear visuals to help assess bullish and bearish volume dynamics with an additional smoothing component through the SMA. It’s an essential tool for volume-focused traders looking to confirm trends or anticipate reversals.

Volume Profile Histogram [SS]I usually (and by usually, I mean the past year xD) release a significant indicator as my Christmas gift to the community on Christmas Eve. Last year, it was the Z-Score buy and sell signal; this year, it's something a little more conventional. So here is this year’s gift—hope you like it! 🎁
Seems like everyone has their take on Volume Profiles (aka SVP or VSP). I decided to create one, and in true Steversteves fashion, you can expect to find all the goodies that come with most of my stuff, including a volume profile presented in a bell-curve/histogram style (chart above) and statistical frequency tables showing the cases by ranges:
And it wouldn't be a true Steversteves indicator without some kind of ATR thing:
So, what does it do?
At the end of the day, it is a form of an SVP indicator. However, it is meant to operate on a larger scale, sorting volume in a traditional bell-curve style. In addition to displaying volume, it breaks down buying vs. selling volume. Selling volume is classified as such when the open is greater than close, while buying is when close is greater than open. This breakdown allows you to see the distribution, by price range, of where selling and buying occur.
This permits the indicator to provide 2 Points of Control (POCs). A POC is defined as an area of high volume activity. Because buying and selling volumes are broken down into two, we can identify areas with high selling and areas with high buying. Sometimes they coincide, sometimes they differ.
If we look at SQQQ, for example:
We can see that the bearish point of control is one point below the bullish POC. This is interesting because it essentially shows where people may be "panic selling" or setting their stop-outs. If SQQQ drops below 18.8, then it's likely to trigger panic selling, as indicated by the histogram.
Conversely, we can observe that traders tend to position long between $18 and $24. The POC is noted in the stats table and also displayed on the chart. Bullish POC is shown in purple, bearish in yellow. These, of course, can be toggled off.
The Frequency Table:
The frequency table shows how many observations were obtained in each price range. The histogram illustrates the cumulative volume traded, while the frequency simply counts how many cases occurred over the lookback period.
ATR Range Analytics by Volume:
The indicator also has the ability to display range analytics by volume. When you toggle on the range analytics by volume option, a range chart will appear:
www.tradingview.com
The range chart goes from the minimum recorded volume to the maximum recorded volume in the period, showing the average range and direction associated with this volume. This is crucial to pay attention to because not all stocks behave the same way.
For example, in the chart above (AMD), we can see that low volume produces a general bearish bias, and high volume produces a general bullish bias. However, if we look at the range analytics for SPY:
Low volume has the inverse effect. Low volume is associated with a more bullish bias, and high volume indicates a more bearish bias. In the ATR chart, the threshold volume to transition from bullish bias to bearish bias is approximately > 78,607,268 traded shares.
The Stats Table:
The stats table can be toggled on or off. It simply displays the POCs and the time range for the VSP. The default time range is 1 trading year (252 days), assuming you are on the daily timeframe. However, you can use this on any timeframe.
The percentages displayed in the histogram is the cumulative percent of buying and selling volume independently. So when you see the percentage on the selling histogram, its the percent of cumulative selling only. Same for the buying.
And that's the indicator! I hope you enjoy it. Let me know your thoughts. I hope you all have safe holidays, a Merry Christmas for you North Americans, and a Happy Christmas for you UKers, and whatever else you celebrate/care about and do! Safe trades, everyone, and enjoy your holidays! 🎁🎄🎄🎄⭐⭐⭐ 🕎 🕎 🕎

Volume Bars ColorThe Volume Bars Color indicator for the TradingView platform is a tool for visualizing trading volumes based on their values. It colors volume histograms on the chart according to their relative magnitude compared to the average volume and standard deviation.
Features:
- Volumes exceeding the average value by more than one standard deviation are considered large and highlighted in red.
- Volumes lower than the average by more than one standard deviation are considered low and displayed in orange.
- Volumes within one standard deviation of the average are considered average and marked in gray.
- Users can adjust the period for calculating the average volume.
How to Use:
- Add the indicator to your chart.
- Adjust the period for calculating the average volume using the corresponding parameter.
- Observe how trading volumes on the chart are colored based on their magnitude relative to the average volume and standard deviation.
Example Usage:
On the chart, red volume histograms indicate periods of high trading activity, orange histograms signify low trading volume, and gray histograms represent average trading volume.
Remember:
The Volume Bars Color indicator helps visualize trading volumes and identify periods with the most active or least active trading volume. However, it should be used in conjunction with other tools and analytical methods to make informed trading decisions.

Volume SMA (StevenCharts)The Volume SMA (StevenCharts) is a streamlined volume analysis tool designed to help traders instantly identify significant market activity.
Standard volume bars can be noisy and difficult to interpret in isolation. This indicator normalizes volume relative to its recent average, highlighting only the bars that carry statistical significance. It separates "smart money" activity from retail noise by color-coding volume based on a user-defined threshold relative to the Moving Average.
How It Works
The indicator calculates a Simple Moving Average (SMA) of the volume (default 20 periods) and compares the current real-time volume against this baseline.
High Relative Volume: If the current volume exceeds the SMA by your set multiplier (e.g., 1.5x or 2.0x), the bar lights up in Green (for bullish closes) or Red (for bearish closes).
Low/Average Volume: If the volume is below the threshold, the bar remains Gray. This helps you ignore low-conviction price action.
Key Features
Threshold Filtering: Easily adjust the "Volume Multiplier" to define what you consider "high volume." Set it to 1.5 to spot bars with 150% of the average volume, or 2.0 for extreme outliers.
Visual Clarity: Automatically greys out insignificant volume, drawing your eye immediately to institutional activity.
Dual-Plot System: Displays standard volume bars alongside the SMA line for context.
Settings
Show Volume SMA: Toggles the blue SMA line on/off.
Volume SMA Length: The lookback period for the average (Default: 20).
Volume Multiplier Threshold: The factor required to trigger the colored highlight.
Example: Setting this to 1.0 means any volume above the average is colored. Setting it to 2.0 means only double-the-average volume is colored.

Volume DashboardReleasing Volume Dashboard indicator.
What it does:
The volume dashboard indicator pulls volume from the current session. The current session is defaulted to NYSE trading hours (9:30 - 1600).
It cumulates buying and selling volume.
Buying volume is defined as volume associated with a green candle.
Selling volume is defined as volume associated with a red candle.
It also pulls Put to Call Ratio data from the Ticker PCC (Total equity put to call ratios).
With this data, the indicator displays the current Buy Volume and the Current Sell Volume.
It then uses this to calculate a "Buyer to Seller Ratio". The Buy to Sell ratio is calculated by Buy Volume divided by Sell Volume.
This gives a ratio value and this value will be discussed below.
The Indicator also displays the current Put to Call Ratio from PCC, as well as displays the SMA.
Buy to Sell Ratio:
The hallmark of this indicator is its calculation of the buy to sell ratio.
A buy to sell ratio of 1 or greater means that buyers are generally surpassing sellers.
However, a buy to sell ratio below 1 generally means that sellers are outpacing buyers (0 buyers to 0.xyx sellers).
The SMA is also displayed for buy to sell ratio. Generally speaking, a buy to sell SMA of greater than or equal to 1 means that there are consistent buyers showing up. Below this, means there is inconsistent buying.
Change Analysis:
The indicator also displays the current change of Volume and Put to Call.
Put to Call Change:
A negative change in Put to Call is considered positive, as puts are declining (i.e. sentiment is bullish).
A positive change in Put to Call is considered negative, as puts are increasing (i.e. sentiment is bearish).
The Put to Call change is also displayed in an SMA to see if the negative or positive change is consistent.
Volume Change :
A negative volume change is negative, as buyers are leaving (i.e. sentiment is bearish).
A positive volume change is positive, as buyers are coming in (i.e. sentiment is bullish).
The volume change is also displayed as an SMA to see if the negative or positive change is consistent.
Indicator breakdown:
The indicator displays the total cumulative Buy vs Sell volume at the top.
From there, it displays the Ratio and various other variables it tracks.
The colour scheme will change to signal bearish vs bullish variables. If a box is red, the indicator is assessing it as a bearish indicator.
If it is green, it is considered a bullish indicator.
The indicator will also plot a green up arrow when buying volume surpasses selling volume and a red down arrow when selling volume surpasses buying volume:
Customization:
The indicator is defaulted to regular market hours of the NYSE. If you are using this for trading Futures, or trading pre-market, you will need to manually adjust the session time to include these time periods.
The indicator is defaulted to read volume data on the 1 minute timeframe. My suggestion is to leave it as such, even if you are viewing this on the 5 minute timeframe.
The volume data is best accumulated over the 1 minute timeframe. This permits more reliable reading of volume data.
However, you do have the ability to manually modify this if you wish.
As well, the user can toggle on or off the SMA assessments. If you do not wish to view the SMAs, simply toggle off "Show SMAs" in the settings menu.
The user can also choose what time period the SMA is using. It is defaulted to a 14 candle lookback, but you can modify this to your liking, simply input the desired lookback time in the SMA lookback input box on the settings menu. Please note, the SMA Length setting will apply to ALL of the SMAs.
That is the bulk of the indicator!
As always, let me know your questions or feedback on the indicator below.
Thank you for taking the time to check it out and safe trades!

Volume Delta with Bollinger Bands [EMA]TL;DR
This indicator displays a “Volume Delta” candle chart based on a lower timeframe approximation of up vs. down volume. Bollinger Bands (using an EMA and a configurable standard deviation multiplier) highlight when Volume Delta exceeds typical volatility thresholds. Green bars will darken when Volume Delta is above the upper Bollinger band, and red bars will darken when Volume Delta is below the lower Bollinger band. You can optionally include wicks in the Bollinger calculations. Note : TradingView uses tick-based volume data, so these values may not precisely match true market orders.
What Is Volume Delta ?
• Volume Delta is a metric that identifies buying vs. selling activity in a market by distinguishing between orders transacting at the ask (buy volume) and orders transacting at the bid (sell volume).
• A positive Volume Delta indicates more buy volume during a bar, while a negative Volume Delta indicates more sell volume.
How TradingView Calculates Volume Delta
• TradingView relies on tick data to approximate up/down volume. This may not perfectly capture true order-flow distribution, particularly on higher timeframes or illiquid symbols.
• While it can provide useful insights into volume flow, keep in mind the underlying data’s limitations.
Key Features of This Indicator
1. Automatic or Custom Lower Timeframe Data
• The script can automatically select a lower timeframe for Volume Delta, or you can manually specify one in the settings.
2. Bollinger Bands on Volume Delta
• Uses an EMA of the Volume Delta (or a wick-based average) and calculates a standard deviation.
• The upper and lower bands highlight when activity deviates from typical volatility.
3. Configurable Wick Inclusion
• Decide whether to use only the “close” (lastVolume) of the Volume Delta bar or the average of its wicks ((maxVolume + minVolume) / 2) for Bollinger calculations.
4. Dynamic Bar Colors
• Positive Volume Delta bars turn dark green if they exceed the upper Bollinger band, otherwise lighter green .
• Negative Volume Delta bars turn dark red if they fall below the lower Bollinger band, otherwise lighter red .
How To Use
1. Add the Indicator to Your Chart
• Apply it to any symbol and timeframe in TradingView.
• Configure the lower timeframe for Volume Delta if desired.
2. Adjust Bollinger Settings
• Bollinger Length defines the EMA and standard deviation period.
• Bollinger Multiplier sets how far the bands lie from the EMA.
3. Choose Whether To Use Wicks
• Toggle to use the average of high/low for a potentially more volatile reading.
• Turn it off to rely solely on the Volume Delta “close.”
4. Interpret the Signals
• Dark Green Above the Upper Band : Suggests strong buying pressure above normal.
• Lighter Green : Positive but within typical volatility bounds.
• Dark Red Below the Lower Band : Suggests strong selling pressure below normal.
• Lighter Red : Negative but within typical volatility.
Important Caveats
• TradingView Volume Data : Tick-based and aggregated data may not reflect actual order-flow precisely.
• Context Matters : Combine Volume Delta with other forms of analysis (price action, support/resistance, etc.) to form a more comprehensive strategy.
Volume: Brightness + Multi-Color (Unified)This indicator combines two volume visualization techniques in one:
Auto Brightness: Volume bars automatically adjust their brightness based on relative activity, blending moving average ratio and historical min–max levels for smoother scaling.
Multi-Color Bars: Each volume bar can display both buy (green) and sell (red) pressure simultaneously, giving a clearer picture of market balance.
Additional features:
Toggle brightness and multi-color independently.
Optional volume MA (SMA/EMA) with customizable length and style.
Session normalization option for stocks (open/close reference volumes).
Ideal for traders who want a more intuitive and informative view of market volume dynamics.
Volume with High/Low ColoringThe "Volume with High/Low Coloring" indicator is designed to help traders visually differentiate between high, low, and normal volume bars relative to recent historical averages. By applying dynamic color coding and customizable thresholds, this indicator enhances volume analysis and improves your ability to spot key moments of accumulation, distribution, or market inactivity.
High Volume: A bar is marked as high volume when it exceeds the average by a customizable multiplier (default is 1.5×) .
Low Volume: A bar is considered low volume when it falls below the average by another multiplier (default is 0.5×) .
Normal Volume: All bars that fall between the high and low thresholds.
Each category is displayed in a different user-selectable color, providing instant visual feedback for volume dynamics.
Customizable Colors:
High Volume: Light Green (default: semi-transparent green)
Low Volume: Light Blue (default: semi-transparent blue)
Normal Volume: Yellow (default: semi-transparent yellow)
Average Volume Line: Gray (optional reference line)
Volume with Sessions, SMA, and ATR Pine Script creates a custom volume indicator with several features, including:
SMA of Volume: It calculates the simple moving average (SMA) of the volume, which helps identify trends and determine if the current volume is above or below the average.
ATR (Average True Range): It calculates the ATR, which measures market volatility over a defined period.
Bullish/Bearish Volume Coloring: The script colors the volume bars depending on whether the price is moving up (bullish) or down (bearish), and whether the volume is above or below the SMA of volume.
Session Highlighting: It defines two major trading sessions:
NYSE (New York Stock Exchange) session from 9:30 AM to 4:00 PM Eastern Time.
LSE (London Stock Exchange) session from 8:00 AM to 4:30 PM GMT. These sessions are highlighted with background colors for easy identification.
Plotting: The volume is plotted as a histogram with varying colors depending on price movement and volume relative to its SMA. The ATR is also plotted as a purple line, and the SMA of volume is displayed as an orange line.
Background Colors: Background colors are applied during the NYSE and LSE sessions to visually differentiate between these trading periods.
Here's a breakdown of each section:
Key Inputs:
smaLength and atrLength: User-defined values for the lengths of the SMA and ATR calculations.
Main Calculations:
smaVolume: The SMA of the volume over the user-defined length (smaLength).
atrValue: The Average True Range over the user-defined length (atrLength).
Color Logic for Volume Bars:
If the current close is higher than the previous close, the volume is considered bullish, and the bar is colored green. If the volume is above the SMA, it’s a darker green; otherwise, it’s a lighter shade.
If the current close is lower than the previous close, the volume is considered bearish, and the bar is colored red. If the volume is above the SMA, it’s a darker red; otherwise, it’s a lighter red.
Plotting:
The script plots the volume as a histogram with dynamic coloring.
The SMA of the volume is plotted as a line.
ATR is plotted as a purple line for reference.
Background Color Highlighting:
The background is colored green during the NYSE session and blue during the LSE session.
Volume-based S/R Levels
█ OVERVIEW
After my last indicator "Order Block Finder" was unexpectedly popular with the TradingView community, I decided to publish another experimental indicator which again tries to identify "areas of interest"
Idea:
Often candles with long wicks represent strong buying & selling pressure, especially when they are combined with extraordinary volume. Especially interesting to me are the lower wicks on red candles and the upper wicks of green candles. These wicks can potentially indicate "areas of interest" by the bigger players in the market and price may interact with these levels again in the future.
This indicator tries to identify these "high volume / long wick" candles and paints a line of either Support or Resistance from the wick into the future.
█ CALCULATION LOGIC
Extraordinary Volume is identified by first calculating thresholds based on a volume Moving Average and Standard Deviations. Two Standard Deviation Values are entered to identify HIGH and EXTREME threshold levels. The current volume is classified by comparing the volume against these thresholds.
The following inputs can be made:
- Volume MA Length
- Standard Deviation Length
- Threshold for HIGH Volume (Number of StdDev)
- Threshold for EXTREME Volume (Number of StdDev)
Another entry parameter can be used to specify the Minimum Wick Length (in % of the candle body value) which identifies a "relevant" candle. If this value is set to 0, then there is no limit and all high volume candles are considered.
The identified Support/Resistance levels are shown as lines on the chart. The parameter "Length of lines (hours)" can be used to set the length of the lines (always in hours). Depending on the timeframe, this needs to be adjusted.
(I know that this can be solved more elegantly in pine, but it was just not important to me. As always everyone is free to copy the code and make improvements. Just give me a mention when you do.)
█ DISPLAY OPTIONS
Different display options are available in the settings:
- Display Support/Resistance: Select if you want to see only Support or Resistance lines - or both
- Display High/Extreme Volume: Select if you only want to see the Extreme Value Candles or the High Value Candles or both
- Display WICK / WICK Range: Select if you only want one line at the extreme value (High/Low) of the wick - or if you want to see a range (three lines - one at the top, one at the bottom and one in the middle of the wick)
- Show Signal Triangles?: This gives the option to show little triangles on all the identified candles
█ DISCLAIMER
This is an experimental indicator and I do not know if my theory works in real life. So treat this not as financial advise, but purely for entertainment and educational purposes.
As mentioned above, I publish this code open so that everyone can re-use it or hopefully even improve it.
Let me know if you have any ideas for improvement and if it is within my coding capabilities (which to be honest are quite limited), I will try to accomodate it.
Have fun.

SIB Fuel moves Car, Volume moves PriceVolume is important as fuel for a vehicle, without fuel a vehicle wouldn't move. We strongly believe a stock required volumes momentum in order to take-off the rallies.
This indicator helps to spot when the "Big Player" comes into the market, neither the collection stage nor the rally take-off stage.
No single indicator will work effectively by itself. Hence, we developed this unique "Heat Volume" indicator to compliment the candlestick analysis.
[EXPLANATION}
GREEN VOLUME BAR: Volume greater than the previous day volume.
GRAY VOLUME BAR: Volume lesser than the previous day volume.
RED VOLUME BAR: Presence of "Big Player" in the market.
YELLOW-BACKGROUND: Strong & active market trade sentiment in Daily timeframe.
GREEN-BACKGROUND: Strong & active market trade sentiment in Weekly timeframe.
WHITE-BACKGROUND: Strong & active market trade sentiment in Monthly timeframe.
ORANGE-BACKGROUND: Strong & active market trade sentiment in Hourly & Minutes timeframe.
Watch on the "Red" volume bar on the critical point. E.g. trend reversal, gap-up, resistance/price/box breakout.
This signaled the "Big Players" in the trade to take-off the rally.
Watch on the "Color-background" signaled of the strong & active market trade sentiment in the respective timeframe.
When "No-color Background" (Black) Stand aside when market trade sentiment is low and quiet.
Disclaimer:-
-This indicator is provided as best as it's an effort for the purpose of studying in the Technical Analysis perspective.
-This is not and never a trading suggestion of buy/sell call or decision under any circumstances.
-This indicator is for the member's and subscriber's circulation only. *If you are interested in the indicator, kindly contact us for the Free-Trial.
-Good luck & Happy Charting!

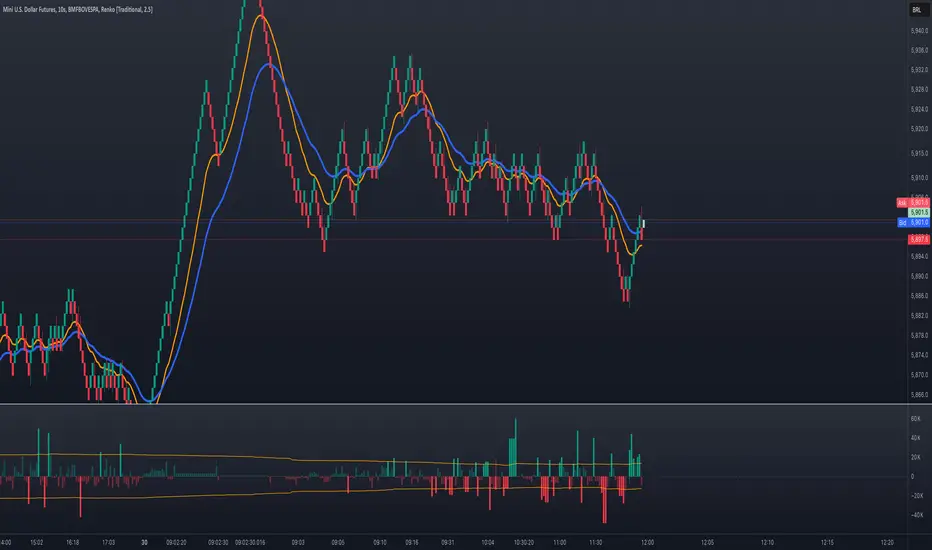
Volume Agregado Perp + Spot BTC only🔍 Aggregated Volume — Spot, Perpetual, or Both (with Bands & Alerts)
Overview:
This indicator aggregates volume data from multiple exchanges (Spot and Perpetual) into a single unified chart. It calculates the simple moving average (SMA) and standard deviation (STDEV) over the aggregated volume, and plots dynamic volume bands at customizable deviation levels.
Includes an option to display only Spot, only Perpetual, or both combined, and provides automatic alerts when volume breaks above or below each band level.
📊 How It Works
Fetches volume from top exchanges using request.security() (e.g., Binance, Bybit, Coinbase, OKX, Kraken, Bitget).
To avoid distortion caused by disproportionally large Perpetual contract volumes, perp data is normalized by dividing by 100. This brings it closer to Spot volume scale.
Computes SMA and STDEV of the aggregated volume, and plots upper/lower bands based on 1x, 2x, and 3x standard deviations.
Issues alerts when the current volume exceeds or drops below the defined thresholds.
🧠 Interpretation
Above Upper Bands (Lv1/Lv2/Lv3): Signals volume spikes, which can indicate breakouts, momentum ignition, or exhaustion moves depending on context. Higher levels (Lv3) suggest more extreme events.
Below Lower Bands: Indicates low activity, potential consolidation, or market pause.
Best used in combination with price structure, VWAP, order blocks, or volume delta/OI for deeper context.
⚙️ Parameters
SMA/STDEV Period – Default: 20 candles.
Band Levels (1/2/3 STDEV) – Fully configurable multipliers.
Volume Mode:
Spot – Only traditional spot exchange volume.
Perpetual – Only perpetual contracts (normalized).
Both – Combines both (default).
volume profile ranking indicator📌 Introduction
This script implements a volume profile ranking indicato for TradingView. It is designed to visualize the distribution of traded volume over price levels within a defined historical window. Unlike TradingView’s built-in Volume Profile, this script gives full customization of the profile drawing logic, binning, color gradient, and the ability to anchor the profile to a specific date.
⚙️ How It Works (Logic)
1. Inputs
➤POC Lookback Days (lookback): Defines how many bars (days) to look back from a selected point to calculate the volume distribution.
➤Bin Count (bin_count): Determines how many price bins (horizontal levels) the price range will be divided into.
➤Use Custom Lookback Date (useCustomDate): Enables/disables manually selecting a backtest start date.
➤Custom Lookback Date (customDate): When enabled, the profile will calculate volume based on this date instead of the most recent bar.
2. Target Bar Determination
➤If a custom date is selected, the script searches for the bar closest to that date within 1000 bars.
➤If not, it defaults to the latest bar (bar_index).
➤The profile is drawn only when the current bar is close to the target bar (within ±2 bars), to avoid unnecessary recalculations and performance issues.
3. Volume Binning
➤The price range over the lookback window is divided into bin_count segments.
➤For each bar within the lookback window, its volume is added to the appropriate bin based on price.
➤If the price falls outside the expected range, it is clamped to the first or last bin.
4. Ranking and Sorting
➤A bubble sort ranks each bin by total volume.
➤The most active bin (POC, or Point of Control) is highlighted with a thicker bar.
5. Rendering
➤Horizontal bars (line.new) represent volume intensity in each price bin.
➤Each bar is color-coded by volume heat: more volume = more intense color.
➤Labels (label.new) show:
➤Total volume
➤Rank
➤Percentage of total volume
➤Price range of the bin
🧑💻 How to Use
1. Add the Script to Your Chart
➤Copy the code into TradingView’s Pine Script editor and add it to your chart.
2. Set Lookback Period
➤Default is 252 bars (about one year for daily charts), but can be changed via the input.
3. (Optional) Use Custom Date
●Toggle "Use Custom Lookback Date" to true.
➤Pick a date in the "Custom Lookback Date" input to anchor the profile.
4. Analyze the Volume Distribution
➤The longest (thickest) red/orange bar represents the Point of Control (POC) — the price with the most volume traded.
➤Other bars show volume distribution across price.
➤Labels display useful metrics to evaluate areas of high/low interest.
✅ Features
🔶 Customizable anchor point (custom date).
🔶Adjustable bin count and lookback length.
🔶 Clear visualization with heatmap coloring.
🔶 Lightweight and performance-optimized (especially with the shouldDrawProfile filter)

Pso Volume Profile # Volume Profile with Dynamic Support and Resistance
## Overview
This Pine Script indicator for TradingView creates a comprehensive volume profile display with automatic support and resistance levels based on significant volume nodes. The indicator analyzes price action and volume data to identify key levels where trading activity has been concentrated, helping traders identify potential reversal or continuation zones.
## Key Features
### Volume Profile Analysis
- Displays a horizontal volume profile on the right side of the chart
- Divides volume into bid (buying) and ask (selling) components
- Color-codes bid and ask volumes differently for easy identification
- Customizable profile width, opacity, and placement
### Dynamic Support and Resistance Detection
- Automatically identifies significant price levels based on volume concentration
- Uses an adjustable percentile threshold to filter for the most important levels
- Color-codes support/resistance lines based on bid/ask dominance:
- Red lines: Bid-dominant levels (more buying pressure)
- Green lines: Ask-dominant levels (more selling pressure)
- Extends lines across the chart for clear visualization
### Customization Options
- Adjustable lookback period for volume analysis
- Configurable number of price divisions (bars)
- User-selectable volume percentile threshold (50-100%)
- Customizable colors for all elements
- Adjustable line length and position
## How It Works
1. The indicator divides the price range into a specified number of horizontal zones
2. It analyzes historical price and volume data within the lookback period
3. For each price zone, it calculates the total volume and separates bid/ask components
4. It identifies zones with volume exceeding the user-defined percentile threshold
5. It draws color-coded horizontal lines at these significant levels, extending across the chart
6. Lines are colored based on whether buying or selling was dominant at each level
## Usage Guidelines
- Higher percentile values (80-95%) will show fewer, but more significant levels
- Lower values (50-70%) will show more potential support/resistance zones
- Red lines often represent potential support levels (buyer-dominated)
- Green lines often represent potential resistance levels (seller-dominated)
- Areas where multiple lines cluster indicate highly significant zones
## Applications
- Identifying key price levels for entry and exit points
- Recognizing potential reversal zones
- Setting strategic stop-loss and take-profit levels
- Confirming support/resistance levels from other technical analysis methods
- Understanding the volume distribution and market structure
This indicator combines volume profile analysis with automatic support/resistance detection, providing traders with a powerful tool to identify significant price levels based on actual trading activity rather than just price patterns.

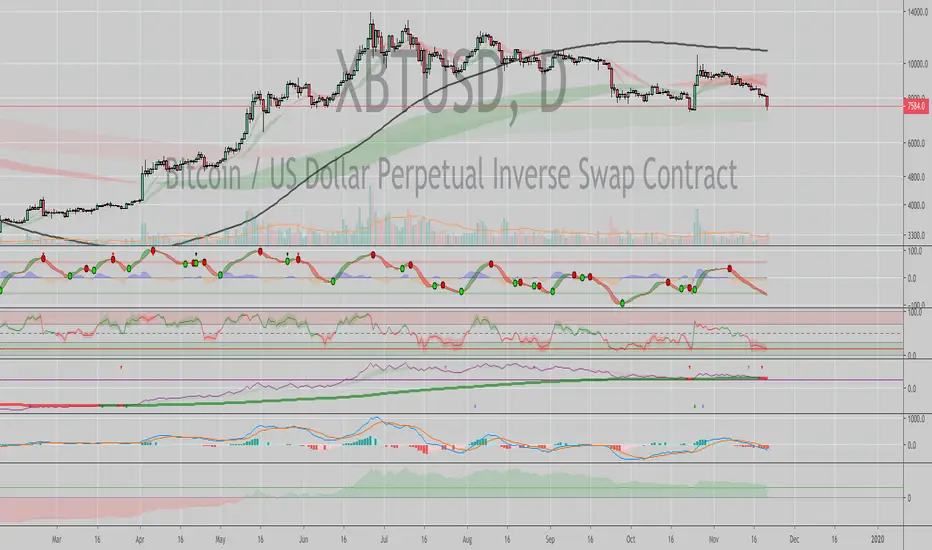
Volume Trailing IntegralAbout
This indicator is an attempt to quantify the volume of buying vs. selling in the last N bars. The hypothesis is that on upticks, there was more bull volume than bull volume, and vice versa. "Trailing Integral" refers to the fact that this indicator shows the sum of bear and bull volume in the last N bars, which is akin to an integral of money flow.
Method
To compute the bear vs. bull volume on a given day, the Z score of a price change is mapped to the volume. For example, for upticks, a highly negative Z score results in a ~50/50 bull/bear volume, while a highly positive Z score results in a ~(Max weighting)/(1-Max weighting) bull/bear volume (if max weighting is 0.8, then a large uptick results in 0.8V bull and 0.2V bear volume). Volume is then summed over the last N bars, where N is the length. EMAs are applied at various points to smooth things. Stdevs are calculated for upticks and downticks independently.
Usage
I like to use this like an enhanced OBV, with a smarter bias towards bull/bear ticks. Look first at the total volume and then look for follow through by bear/bull volume. For example, a rally on low volume, with bias towards bear volume is sellable; a bottom with more bull volume on consolidation is buyable, etc.

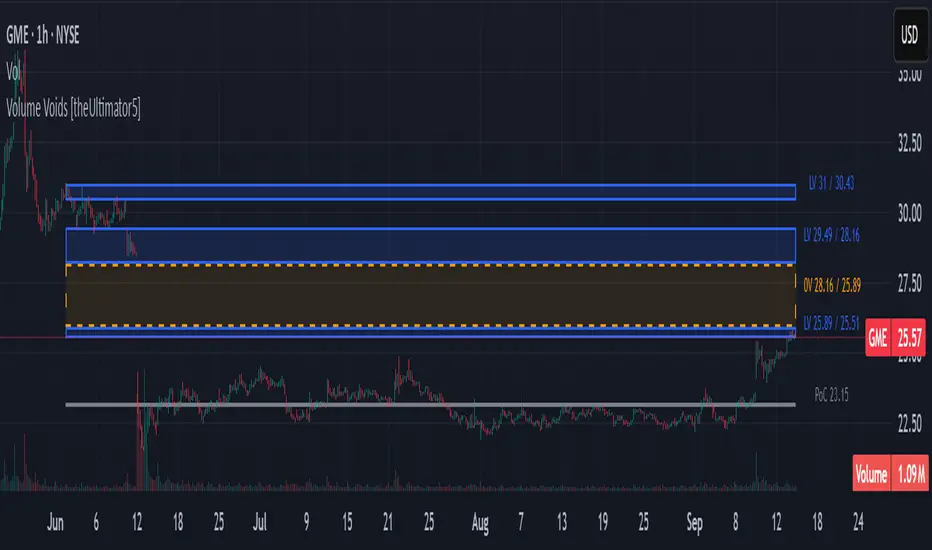
Volume Voids [theUltimator5]Volume Voids highlights price regions with no or unusually thin participation over a chosen lookback. It bins the lookback’s full price range into equal steps, assigns each bar’s close to a bin, and accumulates volume per bin. Contiguous runs of zero-volume bins are shown as “voids,” while low-volume runs (below a dynamic threshold) mark thin-liquidity “corridors” where price often traverses quickly when revisited.
An optional PoC (Point of Control) line marks the mid-price of the highest-volume bin—commonly treated as a recent “value” area that price may revisit.
What it draws on your chart
Histogram (optional): Right-anchored horizontal volume-by-price bars built from your lookback and bin count. Bars tint green→red via a simple delta proxy (up-bar volume minus down-bar volume) to hint at directional participation inside each price band.
Point of Control (optional): A horizontal line at the highest-volume bin’s mid-price (the PoC).
Zero-Volume Voids: Translucent boxes where no bin volume printed within the window (detected between the first and last non-empty bins ).
Low-Volume Zones: Translucent boxes where bin volume is below a dynamic threshold (see formula below), often acting like low-friction corridors.
How it works
Slice the lookback’s high→low into N equal price bins.
Assign each bar’s closing price to a bin and add that bar’s volume to the bin total. A simple up/down-bar delta proxy drives the histogram’s tinting.
PoC = bin with the maximum accumulated volume.
Zero-Volume Voids = contiguous runs of bins with exactly zero volume (bounded by the first/last occupied bins).
Low-Volume Zones = contiguous runs of bins with volume below:
threshold = total_window_volume ÷ (divisor × number_of_bins)
Lower divisor → more LV boxes; higher divisor → stricter/fewer boxes.
Note: This is a lightweight, chart-native approximation of a volume profile. Volume is binned by bar close (not by tick-level prints or intrabar distribution), so “voids”/“thin” areas reflect this approximation.
Key inputs
Lookback Period: Window for calculations.
Number of Volume Boxes (bins): Histogram resolution.
PoC / Show Histogram / Anchor to Right Side: Visibility and layout controls.
Low-Volume Threshold Divisor: Sensitivity for LV detection.
Colors & Labels: Customize zero-volume / low-volume box colors and optional labels with offsets.
How to use (educational, not signals)
Context: High-volume = acceptance; thin/zero-volume = inefficiency. Price often rotates near acceptance and moves faster through thin areas.
Revisits: On returns to prior voids/LV zones, watch for accelerated moves or fills; PoC can serve as a balance reference.
Confluence: Pair with trend tools (e.g., ADX), VWAP/session markers, or structure levels for timing and risk.
Limitations & performance
Bins use closing price only; intrabar distribution is not modeled.
Detections refresh on the live bar; visuals can be heavy on large lookbacks/high bin counts—reduce bins/lookback or hide labels if needed.