Volume EffectivenessI have been trying to work with volume as an indicator for quite some time, as it holds qualities as a 'leading indicator'.
However, please note that any indicator which to some extent predict a future trend has its issues as it can be misleading.
But, in some datasets in a selected timeframe the leading properties of volume as an indicator are useful.
So this script is not too complicated. It shows a numeric which resembles the 'effectiveness of volume' in moving price.
For example, if a small volume creates a large price change - the Volume Effectiveness indicator will be high and show a spike
Whereas, if a large volume creates a small price change - the Volume Effectiveness indicator will be low
I used 3 metrics to represent Volume Effectiveness (these are different colors on the bar chart)
One price difference is the absolute(high - low) for each bar
Another is the absolute(open - close)
The 'open-close' is smaller than the 'high-low', so note this when viewing the bar charts
The final metric depends on if the open is greater than the close or vice-versa
But it considers the 'absolute(high-low)' and the difference between the open and the high (or low) and the close and the low (or high)
So the final metric is the largest of the 3 metrics and is generally the most useful of the 3 however, the other 2 are displayed to provide a better understanding of what 'Volume Effectiveness' displays
Note, I use absolute values so they are only positive, i.e. there are no negative values to represent a price drop within a bar
So, why is this indicator useful - its because volume is a leading indicator
A decreasing volume tends to suggest a price change is coming
Also, when the volume within a bar is very small, its Volume Effectiveness tends to go very high
That means a small trade volume creates a relatively large change in price
This is ideal conditions for a big pump (or big dump - although this indicator seems to work better before pumps)
A large spike in the Volume Effectiveness is commonly/sometimes preceding a big pump
So watch this indicator - and if there is a big spike - evaluate other market conditions to consider getting into position
Large spikes in the Volume Effectiveness can precede big price changes and therefore can provide a leading indication before a pump or dump
Timeframe is important - I found on the daily timeframe this indicator did not provide sufficient lead to be useful. Similarly on the <15min timeframe the spikes were not highly correlated with pumps/dumps
However, in medium timeframes (15mins, 1hour, 4hours) this indicator can be useful for predicting sizeable price changes.
"Volume" için komut dosyalarını ara

Volume Brakeout v1Volume Brakout indicator is used to help determine trend direction strictly based on Negative and Positive volume data.
How to Read:
- Moving Average crossovers are used to help determine a possible trend change or retracement.
- The area cloud on the bottom is calculated by the difference of the moving averages. This could be used to help determine the trending volume strength.
- Bright colored volume bars are large volume spikes calculated by the x factor in the options.
Other changes:
- Volume Depth is going open source with numerous of its indicators. This is only one of many!
- Volume is now displayed without being altered for calculations.

Volume Price ROC Tracker and Shadow CandlesWhen price goes up on negative volume, then market is telling there is doubts in investors mind.
The SPX upside recent month was a on. Lower volume so, the rally in my view will not last. Read my articles on current market.
This very simple scripts shows if price drop or gain was on a upside volume or down side. It is a visual track on the candle reflecting the volume ROC overlapped as a price movement on the actual candle. So don't mistake it with a moving average. Red means volume was down even if price has gone up. Basically if a price goes up on a increase ROC volume then you can trust it. Otherwise it is likely that it won't last.
If you can improve on this idea, it would be great. I think there is not enough volume related scripts that diggs a bit deeper to describe the market behaviour in the future. After all all technical analysis are supposed to tell us about future price not just how it was in the past.

Volume Momentum [LucF]Volume momentum gives much more information than a simple volume MA. It does require interpretation however, since increasing volume momentum can indicate strengthening of both an up or down movement. Volume momentum peaks and bottoms are also interesting as they often lead to shifts in price movement.
In order to help interpretation, I color rising volume momentum using price momentum. Green indicates volume-supported upward price movement and red indicates volume-supported downward price movement.
As to falling volume momentum, in my world view it indicates exhaustion or disinterest which requires prior price activity to be interpreted. In strong and steady price movements it can indicate a mere pause. After high price volatility often signalling a top or bottom, falling volume momentum often leads reversals.
Features
Two optional MAs on the main volume momentum line, with crosses on the short MA.
A higher time frame line (shown by default), with the higher time frame being a user-defined multiple of the current chart’s interval. The default is 8, so that a 15m chart will also show a 2h volume momentum.
Two Markers
Tops/Bottoms (marker 1): these occur on high/low price momentum pivots situated in favorable regions, combined with volume momentum peaks.
Pauses/Reversals (marker 2): these simply identify volume momentum high pivots that often lead to shifts in price movement. They are not directional. You can choose to color bars where these markers occur (shown on chart).
You can show only long or short markers.
Alerts
You can define alerts on any combination of markers you configure. After defining the markers you want the alert to trigger on, make sure you are on the interval you want the alert to be monitoring at, then create the alert, select Volume Momentum, use the default “Configured Markers” alert condition and choose your triggering window (usually “Once Per Bar Close”). Once the alert is created, you can change the indicator's inputs with no effect on the alert.
Use Cases
The higher time frame line is very useful in situating current volume activity in a larger context.
I consider all peaks in volume momentum as potentially significant events.
When looking for an entry, I will often wait for the descending volume momentum to change direction at a shorter interval, using price momentum to confirm that increasing volume is working in my favor.
Volume momentum variations can often inform otherwise insignificant price momentum activity.
Here I use price momentum to color volume momentum; inversely, I also use volume momentum to color my momentum indicator.
Notes
Where the markers on my Volume Columns indicator focus on confirming strength of price movements, this indicators’ markers try to focus on shifts in price movement.
My volume momentum is calculated using a smoother variant of CCI which came to be known as WaveTrend.

Volume ImpactVolume Impact (The area)
Average Volume (The thick line, xTrigger)
Volume Impact = Volume Chance - Average Volume
It provides very reliable buy sell signals. Buy(green) when increasing, sell(red) when decreasing. Volume Impact might drop before the actual price so it has an early warning potential.
Before trend changes volume average diverges from the prices. It moves reverse to the prices.
Also before trend changes, volume impact peaks diverges from price peaks. So you know a big drop is coming.
Klinger Volume Oscillator inspired this indicator... This data is there but it is more difficult to interpret.
In summary, you can foresee trend changes.
Volume+ by BDthis is a simple volume indicator,
shows volume sizes with color differences on histogram (total volume, neutral volume and effective volume)
bar length = total volume, gray bar= neutral volume, green bar= pozitive volume, red bar= negative volume
variable value; The bar's average will be calculated until the given value. by default is average not calculated
Volume Strength Candles / Colored BarsIs Price Action Higher or Lower on STRONG or WEAK VOLUME from lookback
(Strong or Weak Bulls // Strong or Weak Bears)
Candles / Bars Indicate the Following (default 13 period lookback / Length)
MAROON Bear Candle with STRONG VOLUME more than 150% of the lookback / length (13 default), STRONG Bear Candle Confirmed With Volume
RED Bear Candle while VOLUME is BETWEEN 50% & 150% of the Lookback / Length (13 default), Neutral Bear Volume Neither strong or weak
ORANGE Bear Candle with WEAK VOLUME (Less than 50% of the Length / Lookback)
DARK GREEN Bull Candle with STRONG VOLUME MORE than 150% of lookback
GREEN Bull Candle with Neutral VOLUME BETWEEN 50% & 150% of the lookback / Length
AQUA Bull Candle with WEAK VOLUME less than 50% of the Lookback
Is price confirmed by volume?
Can Change the Lookback / Length from 13
Can Change the Colors and Transparency to easily see based off your chart background colors I recommend ZERO Transparency to easily identify volume strength (i use white background but many use black or other)

Volume HighlighterHighlight Candles or Volume Bars when volume breaks through the Moving Average, without volume obscuring your chart or candles! Also set an alert when volume breaks through its moving average! 1) Create an alert, 2) Select "Volume Highlighter" from the Alert Condition dropdown box, 3) select "Volume Bars" from the second dropdown, and 4) select "Volume MA Breakthrough" from the third dropdown.
Normal:
Choice of Highlighting Volume Bars and/or Candles on the chart:
Enjoy.
~jdhadwin

VOLUME WEIGHTED MACD V2 VWMACDV2 BY KIVANÇ fr3762Second version of Buff Dormeier's Volume Weighted MACD indicator....
Here in this version; Exponential Moving Averages used and Weighted by Volume instead of using only vwma ( Volume Weighted Moving Averages).
I personally asked Mr Dormeier, the developer of this indicator, and he confirmed this second version could be used.
I personally think that this one is more effective when comparing with the vwma version...
Volume Weighted MACD
Volume Weighted MACD (VW-MACD) was created by Buff Dormeier and described in his book Investing With Volume Analysis. It represents the convergence and divergence of volume-weighted price trends.
The inclusion of volume allows the VW-MACD to be generally more responsive and reliable than the traditional MACD .
What is MACD (Moving Average Convergence Divergence)?
Moving Average Convergence Divergence was created by Gerald Appel in 1979. Standard MACD plots the difference between a short term exponential average and a long term exponential average. When the difference (the MACD line) is positive and rising, it suggests prices trend is up. When the MACD line is negative, it suggests prices trend is down.
A smooth exponential average of this difference is calculated to form the MACD signal line. When the MACD line is above the MACD signal line, it illustrates that the momentum of MACD is rising. Likewise, when the MACD is below the MACD signal line, the momentum of the MACD falls. This difference between the MACD line and the MACD signal line is frequently plotted as a histogram to highlight the spread between the two lines.
What is the difference between MACD and VW-MACD?
Volume Weighted MACD is substituting the two exponential moving averages to compute the MACD difference with the two corresponding Volume-Weighted Moving Average . Thus, VW-MACD contrasts a volume-weighted short term trend from the volume-weighted longer term trend.
The signal line is left as an exponential moving average because VW-MACD line is already volume weighted.
Developer: Buff Dormeier @BuffDormeierWFA on twitter

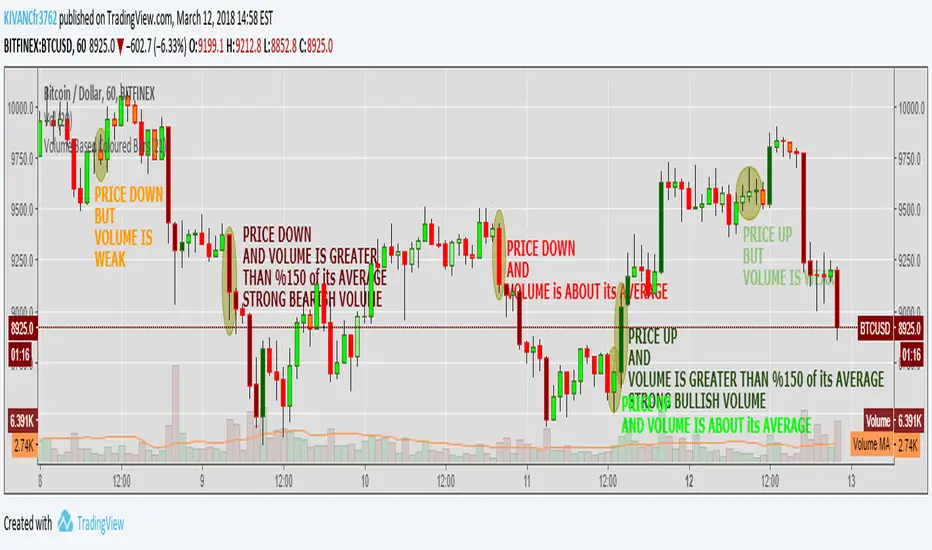
Volume Based Coloured BarsVolume Based Coloured Bars:
Most of the time traders are confused about if the price movements were supported by VOLUME .
This indicator colors the bars into volume weighted signals...
When prices go down bars are red and contraversely when up, bars are green. Additionally we have two more colors for each
situation:
PRICE BARS ARE:
DARK RED when prices go down and VOLUME is bigger than 150% of its (default 21 day) average, that indicates us price action is supported by a strong BEARISH VOLUME
RED when prices go down and VOLUME is BETWEEN 50% AND 150% of its (default 21 day) average, at this situation we can think that volume is neither strong nor weak
ORANGE when prices go down and VOLUME is just less than 50% of its (default 21 day) average, so the volume is weak and doesn't support the price action much
DARK GREEN when prices go UP and VOLUME bigger than 150% of its (default 21 day) average, that indicates us price action is supported by a strong BULLISH VOLUME
GREEN when prices go UP and VOLUME is BETWEEN 50% AND 150% of its (default 21 day) average, at this situation we can think that volume is neither strong nor weak
LIGHT GREEN when prices go UP and VOLUME is just less than 50% of its (default 21 day) average, so the volume is weak and doesn't support the price action much
21 day Simple Moving Average used as default value which can be changed in the settings menu,
21 day is considered as a month for STOCK Markets, it would be more accurate to set the value to 30 for CRYPTO CURRENCIES
Volume BreakoutsThe aim of this indicator is to indicate effective volume breakouts.
Blue = Volume is at least 25% above the 20d moving average
Purple = Volume is at least twice as much as the 20d moving average
Red = Volume is at least three times the average
My recommendation : Always watch for breakouts on large volume. That's a sign that big institutions are buying.

Volume SpikeThis script plots exponential moving average (EMA) of volume (line chart) together with spike threshold (area chart) offset by 1 bar. The idea is to detect sudden increase (spike) in volume when volume EMA crosses above the threshold which is calculated by multiplying a multiple in EMA of the previous bar.
This is used for setting alerts on changes of volume to get notified on sudden increase in volume. Custom alert included in the script and also available on Coinograph bot.

Volume (D)EMAA simple yet configurable indicator that shows recent traffic volumes.
The time period is specified as weeks/days/hours/minutes, not as bars.
Set the volume period to non-zero if you want to use a generalized double EMA instead of plain.
The ratio option will show the size of the current volume compared to the volume in the specified time period (expect to see something very non-Gaussian, say goodby to trusting your ATR and stddev, and say hello to fat tails.) With the "together" option, it compares the current volume to the both sides together (buy+sell), otherwise it compares it to just its own.

Volume Dual-CoorVolume indicator
Similar to normal volume indicator but you can see which portion of the volume was buy and sell
Features
gap adjustment
dual color, green at bottom

Volume with VSAThis script is designed to identify meaningful volume activity using the principles of Volume Spread Analysis (VSA). By focusing on the relationship between price movement and volume, it highlights areas where professional traders may be active. The tool becomes especially powerful when applied to higher timeframes such as 15-minute or 30-minute charts. On these larger intervals, market noise is reduced, allowing true supply and demand imbalances to stand out more clearly. As a result, the zones and signals generated by the script tend to be more reliable and consistent. The combination of structural analysis and volume behaviour helps traders pinpoint potential trend reversals, continuation patterns, and breakout strength with greater accuracy. Overall, this script enhances decision-making by offering a clearer view of genuine market participation, making it well-suited for swing traders, intraday strategists, and anyone looking to understand volume dynamics more effectively.

Volume CandleThis Volume Candle Strategy indicator highlights the areas where the volume is acting against the prevailing trend.
It is a reliable indicator for identifying locations where big market players are likely to be liquidated or forced to change their positioning due to an ongoing trend.

Volume Imbalances & Gann's Square IndicatorVolume Imbalances & Gann's Square Indicator:
This script is a comprehensive trading toolkit designed to help intraday and swing traders identify high-probability trade setups by combining the strengths of Gann's Theory, price-volume analysis, and multi-indicator signal confirmation in one indicator.
Key Features and Their Roles:
Gann’s S/R Levels:
Calculates main and auxiliary support/resistance lines using Gann’s “odd square” approach based on the current price. Levels are projected historically and into the future to clearly visualize critical zones for potential reversals and breakouts.
Volume*Price (VP) Spike Table:
Detects and displays real-time buy and sell volume spikes above a configurable threshold, highlighting large market transactions. The on-chart table summarizes recent major spikes with time and price for context, resetting every session.
Multi-EMA & VWAP Logic:
Integrates three customizable EMAs, VWAP, and Supertrend. Users can toggle signals from EMA crossovers, price-VWAP positioning, or Supertrend direction to match their preferred trading style and filter signals for trend or mean-reversion strategies.
Buy/Sell Labels and Signal Source Control:
Clearly plots buy/sell marker labels with customizable text, color, and size, based on the chosen signal source (EMA cross, VWAP, Supertrend). Labels offset from candles for easy visibility.
First Candle Range & Session Tools:
Plots the initial range (high, low, and midpoint) of a user-defined session, helping visualize and trade session breakouts or range retests. Session logic ensures all statistical tables and levels reset at session start.
Automated Risk/Reward Table:
Instantly calculates capital allocation, stop-loss, potential quantity, and two profit targets for both long and short trades. Helps traders plan size and risk per trade in compliance with risk management principles.
Highest/Lowest VP Markers:
Highlights the day’s peak and trough volume*price values for context on institutional buying or selling pressure.
Previous Day Range Plotter:
Draws previous session’s high/low levels for reliable reference zones and potential trade targets.
Integration Rationale:
All components are thoughtfully integrated to provide a holistic decision-making workflow:
Volume/price spikes act as momentum or liquidity signals.
Gann levels define the “where” for reaction or breakout trades.
Signal logics (EMA/VWAP/Supertrend) answer the “when,” enabling higher-confidence entries only when multiple conditions align.
How to Use:
Select your preferred inputs for EMAs, VWAP, and risk settings in the panel.
Analyze the chart for signals where buy/sell labels align with fresh VP spikes near Gann or previous day support/resistance.
Use the risk/reward table for strict money management.
Reference spike tables and session range for contextual confirmation.
Visuals and Chart Guidance:
The script displays only essential tables, lines, and labels described above.
All chart elements are explained in this description—no external scripts needed for interpretation.
Each table and marker is linked to actionable trading logic, eliminating clutter.
Closed-source Explanation:
The indicator uses session-based calculations, real-time data arrays, and proprietary math to unify Gann theory logic, large transaction detection, and multi-indicator confirmation. All major trade conditions have alert signals for ready integration with TradingView’s alert system.

Volume + RSI & MA Differential"Volume + RSI & MA Differential," integrates volume, RSI, and moving average differentials to generate trading signals. The script calculates a 14-period RSI to identify overbought or oversold conditions, with customizable thresholds for buy and sell signals. It also computes a 20-period SMA of the volume to smooth out trading activity data, helping to identify trends in market participation.
The script incorporates a fast (50-period) and a slow (200-period) SMA to analyze short-term and long-term trends, respectively. The differential between these moving averages, adjusted by the volume SMA, is used to identify potential trend changes or confirmations. Bars are colored yellow when the RSI is below the buy threshold and volume is high, indicating a potential buy signal. Conversely, bars turn red when the RSI is above the sell threshold and the fast MA is below the current close price, suggesting a potential sell signal. Neutral conditions result in grey bars.
Additionally, the script uses color-coding to plot the volume SMA and a line that changes color based on the moving average differential. A black line indicates a broadening MA cloud and a bullish trend, while a grey line suggests a narrowing MA cloud and a potential selloff. A yellow line signals the beginning of a buyback. This visual representation helps traders quickly identify potential trading opportunities and trend changes, making the script a valuable tool for technical analysis.

Volume Share
It represents the ratio of the trading volume of several major exchanges.
If abnormal transactions occur on a particular exchange, it can be intuitively detected.
The list of exchanges can be changed freely,
It is also possible to set whether to reflect it in the total amount as a reference.
It would be better to use it to reduce uncertain variables for healthy trading rather than unscientific signals.

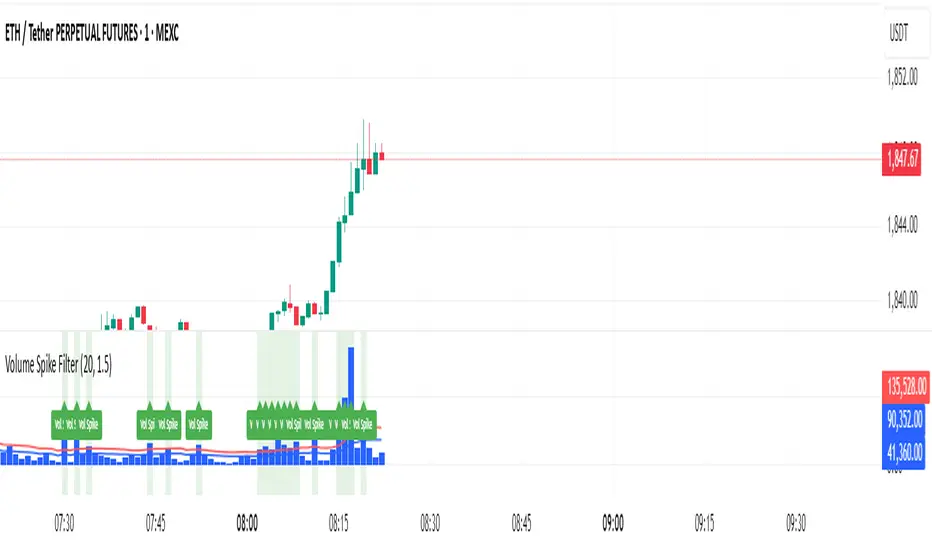
Volume Spike Filter### Volume Spike Detector with Alerts
**Overview:**
This indicator helps traders quickly identify unusual spikes in trading volume by comparing the current volume against a simple moving average (SMA) threshold. It's particularly useful for beginners seeking clear signals of increased market activity.
**Settings:**
* **SMA Length:** Defines the period for calculating the average volume (default = 20).
* **Multiplier:** Determines how much the volume must exceed the SMA to be considered a spike (default = 1.5).
* **Highlight Spikes:** Toggle to visually highlight spikes on the chart (default = enabled).
**Signals:**
* 🟩 **Highlighted Background:** Indicates a volume spike that surpasses the defined threshold.
* 🏷️ **"Vol Spike" Label:** Clearly marks the exact bar of the spike for quick reference.
**Usage:**
Use these clear volume spike alerts to identify potential trading opportunities, confirmations, or shifts in market momentum. Combine this with other technical indicators for enhanced analysis.
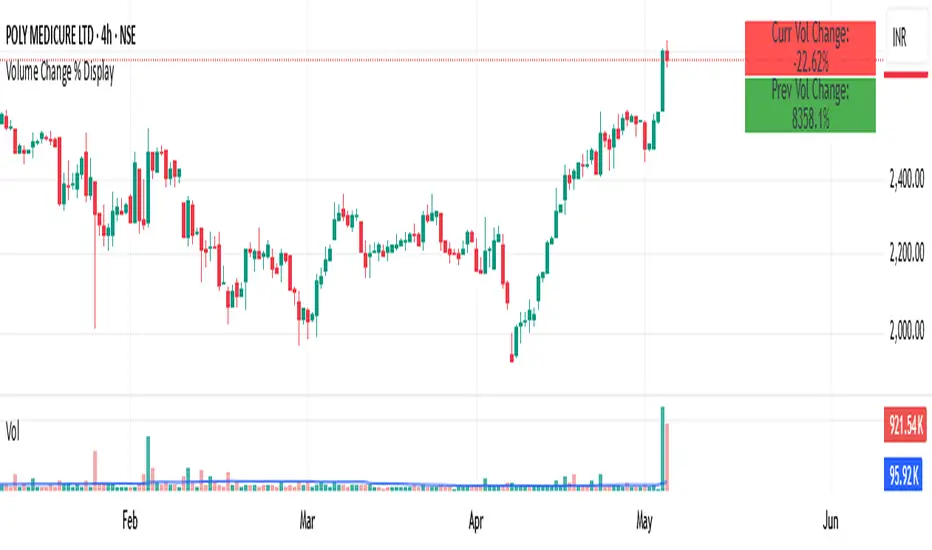
Volume Change % Display1- Current bar's volume change %
2- Previous bar's volume change %
* Each line uses its own color based on volume rising or falling.
* Keeps the layout compact and readable.
Volume Disharmony IndicatorThis indicator is designed to detect imbalanced volume compared to the open/close of the corresponding candle body. The idea is that institutions often trade in higher volume within a smaller price range. Identifying these can give an indication if there is a rally or selloff happening. The code looks at the median of all the prior candles from the point of the last trigger and compares them to the range in body of the candles in order to dynamically find a baseline, by which imbalances can be more accurately detected throughout changing market conditions.

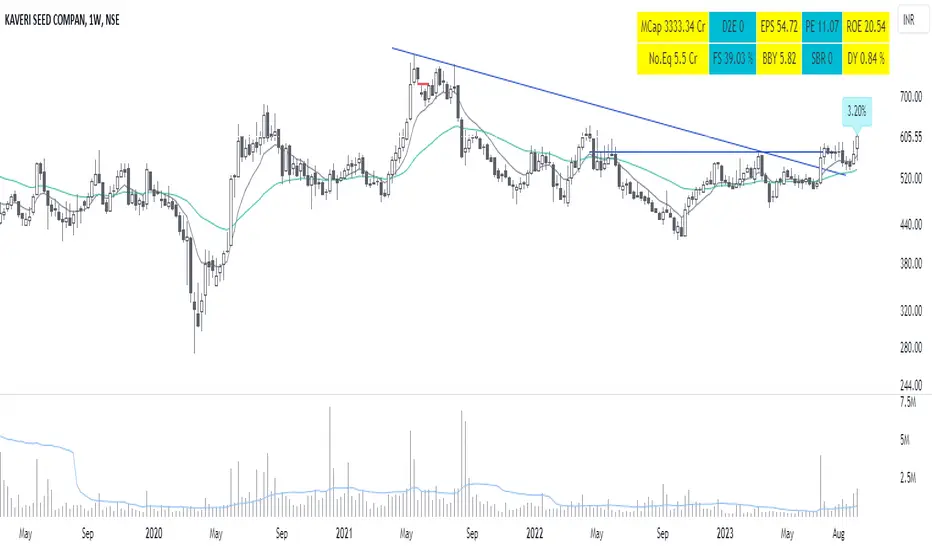
Volume Traded in Total Outstanding Shares with basic fundamentalThis indicator helps to find Volume Traded in Total Outstanding Shares with basic fundamental parameters like MCAP, EPS, PE, D2E and No. Equity shares.