72s: Adaptive Hull Moving Average+One challenging issue for beginner traders is to differentiate market conditions, whether or not the current market is giving best possibility to stack profits, as earliest, in shortest time possible, or not.
On intraday, we've seen some big actions by big banks are somewhat can be defined --or circling around-- by HMA 200 . I've been thinking on to make the visuals more conform to price dynamics (separating major movement and minor noise) to get clearer signs of when it starts to happen. So it will be easier to see in a glance when the strength starts really taken place, with less cluttered chart.
This Adaptive HMA is using the new Pine Script's feature which now support Dynamic Length arguments for several Pine functions. ( read: www.tradingview.com). It hasn't support the built-in HMA() directly, but thankfully we can use its wma() formula to construct. (Note: I tweaked a bit HMA formula already popular here by using plain int() instead of round() on its wma's length, since I find it precisely match tradingview's built-in HMA).
You can choose which aspect the Adaptive HMA period will adapt to.
In this study I present it with two options: Volume and Volatility . It will "moves" faster or slower depends on which situation the aspect is currently into. ie: When volume is generally low or volatile readings is not there, price won't move very much, so the adapting MA will slow down by dynamically lengthen the lookback period, and vice versa, and so on.
Colour-markings in the Adaptive resembles which situation explained above. In addition, I also combine it with slope calculation of the MA to help measuring trend-strength or sideway/choppy conditions.
This way when we use it as dynamic support/resistance it will be more visually-reliable.
Secondly, and more important, it might help us traders with better probability info of whether or not a trade should even worth to be made . ie: If in the mean time market won't give much movement, any profit would also only as much. In most cases, we might better save our dime for later or place it somewhere else.
HOW TO USE:
Aside from better dynamic support/resistance and clearer breakout confirmation, MA is coloured as follow:
YELLOW:
Market is in consolidation or flat. Be it sideways, choppy, or in relatively small movements. If it shows up in a trending market, it may be an earlier sign that current trend might about to change its direction, or confirming a price broke-out to another side.
LIGHT GREEN or LIGHT RED:
Tells if a trend is forming but still relatively weak (or getting weaker), as it doesn't have volume or volatility to support.
DARKER GREEN ot DARKER RED:
This is where we can expect some good and strong price movement to ride. If it's strong enough, many times it marks a start of new long-lasting major trend.
SETTINGS:
Charger:
Choose which aspect your HMA should plug itself into, thus it will adapt to it.
Minimum Period, Maximum Period:
172 - 233 is just my own setting to outmatch the static HMA 200 for intraday. I find it --in my style of trading-- best in 15m tf in almost any pair, and 15m to 1H for some stocks. It also works nicely with conventional EMA 200, sometimes as if they somewhat work hand-in-hand in defining where the price should go. But you can, ofcourse, experiment with other ranges, broader or narrower. Especially if you already have an established strategy to follow to. As you might do with:
Consolidation area threshold:
This has to do with slope calculation. The bigger the number means your MA needs bigger degree to define the market is out of flat (yellow) area. This can be useful if needed to lighten up the filter or vice-versa.
Background colouring:
Just another colouring to help highlighting the difference in market conditions.
ALERTS:
There are two alerts:
Volume Break: when volume is breaking up above average, and
Volatility Meter: when the market more likely is about to have its moment of the big wiggling brush.
USAGE:
Very very nice BUY entry to catch big up-movement if:
1. Price is above MA. (It is best when price is also not to far distance from the MA, or you can also use distance oscillator to help out too)
2. HMA's color is in darker green. Means it's on the charging plug with your chosen aspect.
3. RSI is above 50. This is to help as additional confirmation.
Clear SELL entry signal is same as above, just the opposite.
-------------------------------------------------------
Note:
Lower timeframe of course means more noise to be filtered. Depends on the instrument, you might need to tweak the settings a bit till it conform nicely and shows lots of good trades in history. Here's another example on GBPUSD 5m timeframe:
For exit/take-profit point, you can use a second faster period static HMA. Or you can also use RSI. Here's an example:
Don't get me wrong, on few occasions I found it's still best using static MA to spot fakeouts, breakouts, etc, especially ones that's been already use widely. If that's the case or price actions seems suspicious, simply put the same value for minimum and maximum period settings, and there you have the original HMA with extra features.
For developer, check in the code if you need to customise your own charger.
-------------------------------------------------------
That's it. Hopefully this Adaptive HMA+ could at least be a good sidekick to your own strategy, as it does mine. ;)
"Volatility" için komut dosyalarını ara

Twin Range Filter Algo@Colinmck used two different ranges to generate signals. Read his release notes to find out what the original script does.
I added one condition which seems to increase performance on 15m BTCUSD as well as 1h BTCUSD and that is ATR with 32 periods being smaller than ATR with 64 periods. I used my script Volatility Optimiser to discover this tendency.
Both buying and selling conditions are same as in @Colinmck's script plus one condition of my own. You can disable my condition.
Target and stop-loss are manually set values in ticks.
Time stop-loss is manually set value in a number of candles. After this number of candles, a position always exits (or should 😇). You can disable it by inserting a very long period. I do not recommend it, because a value of indicator should not be measured in luck and if market starts moving in the direction after 40 periods, the predictive capability of an indicator is questionable.
I used 300/150/17 for 15m BTCUSD chart and 900/30/17 for 1h BTCUSD. I didn't try to optimize any other parameters for these periods.
Since this script relies mostly on volatility for its prediction, I wouldn't recommend using it on its own. Individual approach to the market is recommended. Also, it didn't work on EURUSD when using the same default values and different order management (tp, sl, time sl), so it is probably not as versatile.
Let me know what do you think of this strategy. If you have some ideas about how to make it more reliable, share it in the comments, I might put it to the test. Good luck 🍀

V/V weighted ma - JDAs a third new weighted moving average I present the Volume-Volatility Weighted Moving Average.
The Volume-Volatility Weighted Moving Average (VVwma) calculates the average price over a certain period,
weighted by both volume and volatilty, Big volume doesn't necessarily move price a lot but is very important,
big price moves don't always need big volume but also have a lot of importance!
In this indicator both big volume moves as well as big price moves are factored in to calculate the ma behaviour.
The ma has a tendancy to quickly give an indication of a ranging vs trending market by angle of the ma.
In ranging market it quickly flattens out and could be used to filter out insignificant low volume/volatility moves
compared to regular ma's or the standard volume weighted ma
Another use of it could be as entry/exit signals or
as a means of a trailing stop or a hard exit for a strategy or
as a "baseline" to combine with other signals
feel free to experiment!!!
If you use the VVwma in your scripts or your work, a shoutout would be nice!!
Gr, JD.
#NotTradingAdvice #DYOR

Volatility weighted maThe next in my series of weighted moving averages is the Volatility Weighted Moving Average.
The Volatility Weighted Moving Average (Volwma) calculates the average price over a certain period,
contrary to the well known Volume weighted ma, it is weighted by volatilty,
meaning big price moves don't always need big volume but also have a lot of importance!
In this indicator these big price moves are factored in to calculate the ma behaviour.
As the ma is quite biased on price moves it can quickly give an indication of a ranging vs trending market by angle of the ma.
In ranging market it quickly flattens out and could be used to filter out insignificant low volatility moves
compared to regular ma's or the standard volume weighted ma
Another use of it could be as entry/exit signals or
as a means of a trailing stop or a hard exit for a strategy or
as a "baseline" to combine with other signals
feel free to experiment!!!
If you use the Volwma in your scripts or your work, a shoutout would be nice!!
Gr, JD.
#NotTradingAdvice #DYOR

ATR Percentage of PriceThis indicator takes the standard ATR and expresses it as a percentage of the OHLC4 price. This has the advantage of normalising the ATR value across the history of an asset. For example, an ATR of value 20 when the price is 2000 actually has a very different meaning when the price rises to 4000. The ATR may be the same value but actually the volatility it represents has halved.
I also add an SMA to the value and a histogram which shows the difference between the two. Positive values mean that volatility is expanding while negative values mean volatility is contracting.
SUPERTREND ATR WITH TRAILING STOP LOSS## THIS SCRIPT IS ON GITHUB
## MORE BACKTEST
SuperTrend is a moving stop and reversal line based on the volatility (ATR).
The strategy will ride up your stop loss when price moviment 1%.
The strategy will close your operation when the market price crossed the stop loss.
The strategy will close operation when the line based on the volatility will crossed
The strategy has the following parameters:
+ **ATR PERIOD** - To select number of bars back to execute calculation
+ **ATR MULTPLIER** - To add a multplier factor on volatility
+ **INITIAL STOP LOSS** - Where can isert the value to first stop.
+ **POSITION TYPE** - Where can to select trade position.
+ **BACKTEST PERIOD** - To select range.
## DISCLAIMER
1. I am not licensed financial advisors or broker dealers. I do not tell you when or what to buy or sell. I developed this software which enables you execute manual or automated trades multiple trades using TradingView. The software allows you to set the criteria you want for entering and exiting trades.
2. Do not trade with money you cannot afford to lose.
3. I do not guarantee consistent profits or that anyone can make money with no effort. And I am not selling the holy grail.
4. Every system can have winning and losing streaks.
5. Money management plays a large role in the results of your trading. For example: lot size, account size, broker leverage, and broker margin call rules all have an effect on results. Also, your Take Profit and Stop Loss settings for individual pair trades and for overall account equity have a major impact on results. If you are new to trading and do not understand these items, then I recommend you seek education materials to further your knowledge.
**YOU NEED TO FIND AND USE THE TRADING SYSTEM THAT WORKS BEST FOR YOU AND YOUR TRADING TOLERANCE.**
**I HAVE PROVIDED NOTHING MORE THAN A TOOL WITH OPTIONS FOR YOU TO TRADE WITH THIS PROGRAM ON TRADINGVIEW.**
## NOTE
I accept suggestions to improve the script.
If you encounter any problems i will be happy to share with me.
+ Authors: @exit490
+ Revision: v1.0.0
+ Date: 5-Aug-2019
+ Pinescript version: 4
## LICENSE
Copyright 2019 Mauricio Pimenta / exit490
SuperTrend with Trailing Stop Loss script may be freely distributed under the (../LICENSE).

Dorsey InertiaThis indicator was originally developed by Donald Dorsey (Stocks & Commodities, V.13:9 (September, 1995): "Refining the Relative Volatility Index").
Inertia is based on Relative Volatility Index (RVI) smoothed using linear regression.
In physics, inertia is the tendency of an object to resist to acceleration. Dorsey chose this name because he believes that trend and inertia are related and that it takes more effort and energy to reverse the direction of a stock or market than to keep it in the same direction. He argues that the volatility is the simplest and most accurate measure of inertia.
When the indicator is below 50, it signals bearish market sentiment and when the indicator is above 50 it signals a bullish trend.
Good luck!

Moving CovarianceCo-variance is a representation of the average percent data points deviate from there mean. A standard calculation of Co-variance uses One standard Deviation. Using the empirical rule, we can assume that about 68.26% of Data points lie in this range.
The advantage to plotting co variance as a time series is that it will show you how volatility of a trailing period changes. Therefore trend lines and other methods of analysis such as Fibonacci retracements could be applied in order to generate volatility targets.
For the purpose of this indicator I have the mean using a vwma derived from vwap. This makes this measurement of co-variance more sensitive to changes in volume, likewise are more representative a change in volatility, thus giving this indicator a "leading aspect".

Session Lines + ATR AnalyticsDescription:
Overview:
A comprehensive trading tool that combines session visualization with real-time ATR analytics. Perfect for intraday traders who need precise timing and volatility measurements.
Features:
Session Markers
Visual indicators for Asia (00:00-08:00), London (07:00-15:00), and New York (13:00-21:00) trading sessions
Color-coded session bands at the bottom of the chart for quick identification
Fully customizable session times and colors
Hourly Vertical Lines
Automatic vertical lines drawn at the start of each hour (works on 1-minute charts)
Multiple line styles available: solid, dotted, dashed, arrows
Adjustable color and width settings
Helps identify exact timing of price movements
ATR Tool
Real-time candle range measurement
Modified ATR calculation (excludes current candle for accuracy)
Customizable ATR length and multiplier
Live countdown timer showing time remaining in current timeframe
Floating label with adjustable offset and styling
Date & Timeframe Display
Bottom-right watermark showing current date in LA timezone
Displays current timeframe with proper units (1m, 5m, 1H, etc.)
Useful for backtesting to confirm you're viewing the correct date
Best Used For:
Day trading and scalping (especially on 1-minute charts)
Session-based trading strategies
Volatility analysis using ATR
Time-based entry and exit planning
Settings:
All elements are fully customizable through the indicator settings panel, including colors, sizes, visibility toggles, and calculation parameters.

GK ZeroLag BOSGK Zero-lag BOS is clean, non repainting institutional trend and structure indicator built specifically for precision entries. It combines Zero-lag EMA ZELMA with ATR volatility bands to define true trend direction, then confirms entries using break of structure BOS logic. signals only print once per trend eliminating noise, chop. KEY FEATURES Zero lag EMA trend detection length=70 ATR band volatility filter, BOS confirmation using recent structure highs/lows. one GK BUY / GK SELL per trend fully non repainting and bar close confirmed optimised for XAUUSD

Atilla Bollinger Squeeze EMA Intelligence PanelIndicator Description (English)
Atilla – Bollinger Squeeze + EMA Intelligence Panel is a trend-following and breakout-detection indicator designed to help traders avoid fake signals and emotional overtrading.
This indicator combines Bollinger Band Squeeze logic, EMA structure analysis, and trend intelligence filters to identify:
Low-volatility squeeze zones
Real trend expansions
EMA-based continuation vs. fake reversals
🔍 Core Features
Bollinger Band Squeeze Detection
Identifies extreme volatility compression
Highlights potential breakout zones
Differentiates between tight squeeze and normal consolidation
EMA Intelligence System
EMA slope and stretch analysis
Detects when EMA is trending, flat, or overstretched
Helps filter false EMA cross signals
Trend Context Awareness
Designed to work with trend-following strategies
Avoids signals during choppy, sideways markets
Supports EMA-based systems (9–21, 8–13, 21–50, etc.)
Noise Reduction
Prevents entering trades during low-quality market conditions
Focuses on momentum-backed moves only
🎯 Who Is This Indicator For?
Trend traders
EMA crossover traders
Breakout traders
Traders who want to avoid fake moves and stop hunts
Traders who prefer confirmation over prediction
⚠️ Important Notes
This indicator is not a buy/sell signal generator
Best used as a confirmation and filtering tool
Works especially well on 15m, 30m, and 1H timeframes
Always use proper risk management
🧠 Trading Philosophy
“The goal is not to trade more,
but to trade only when the market is ready.”
If you want, I can also:
write a shorter minimalist description
add a professional disclaimer
optimize wording for TradingView Popular Scripts

Quant-Action Pro: Triple Confluence EngineQuant-Action Pro: Triple Confluence Engine
Systematic Framework for Structural Price Action Analysis
Quant-Action Pro is a high-performance analytical engine designed to synchronize institutional liquidity flow with market geometry. Instead of traditional "signals," this framework identifies Structural States where three independent algorithmic layers align, providing a objective roadmap for the current price action context.
1. Core Algorithmic Matrix
The engine operates by monitoring the interaction between price and three proprietary logic layers:
A. Institutional Flow Node (SP2L) —
Logic: Monitors "Passive Liquidity Absorption" at the 20-period EMA.
Function: Identifies zones where institutional buyers/sellers are defending the trend's equilibrium. This is not a simple touch; it requires a validated "Touch-and-Hold" sequence.
B. Structural Flip Scanner (BTB) —
Logic: Detects the transition from old supply to new demand (S/R Flip).
Function: Uses a 3-phase Break-Test-Break verification to confirm that a structural breakout is backed by volume, reducing the risk of "Fake-outs."
C. Liquidity Compression Monitor (Micro Map) —
Logic: Statistical range-contraction analysis (Volatility Squeeze).
Function: Signals a High-Density State where price is coiling for an expansion move.
2. The Golden State: Triple Confluence Logic
The GOLD label represents the "Apex" of this engine. It is triggered only when the SP2L, BTB, and Micro Map layers synchronize on a single candle. In structural terms, this means:
Trend Defense (SP2L) is active.
Structural Breakout (BTB) is confirmed.
Volatility Expansion (MM) is imminent.
This Triple-Layer filtering ensures that Golden Signals only appear during periods of maximum market conviction.
3. Professional Implementation (Structural View)
MTF Trend Matrix: A built-in dashboard provides a 1H, 4H, and 1D diagnosis to ensure local setups align with the Macro Trend.
Smart Invalidation (Adaptive Trendlines): The engine draws dynamic geometry to define the current "Structural Floor/Ceiling." A decisive close beyond these lines acts as a clear Invalidation Point for the current thesis.
Mean Reversion: The system uses the 200-EMA as the primary directional filter, defining whether the market is in a "Bullish Expansion" or "Bearish Correction" state.
⚠️ Risk Disclaimer
Trading financial instruments involves significant risk. Quant-Action Pro is an educational tool designed for research and structural analysis. It does not provide financial advice. Past performance is not indicative of future results. Always use strict risk management.

Weighted ATRWeighted ATR is a volatility indicator that computes True Range and smooths it using a selectable kernel (native Wilder ATR, SMA, EMA, WMA, VWMA, or HMA). It outputs a single volatility line in price units for risk sizing, stop distances, and regime filtering.

ADR% / ATR / Dynamic LoD–HoD TableThis indicator displays a clean data table showing ADR%, ATR, and a dynamic LoD/HoD distance value based on daily trend conditions.
When price is above the 21-day or 50-day moving average, the indicator shows the distance from the Low of Day.
When price is below BOTH daily moving averages, it automatically switches to showing distance from the High of Day.
The table updates in real-time and gives a fast, volatility-based view of where price sits inside the day’s range.
Features
• ADR% (Average Daily Range Percentage)
• ATR (Average True Range)
• Automatic LoD → HoD switching based on daily trend
• Customizable colors and layout
• Clean, space-efficient table format
• Designed for intraday and volatility-focused traders

Bollinger Bands + VWAP + 4-State MACD BackgroundBollinger Bands + VWAP + 4-State MACD Background
An all-in-one technical analysis indicator combining three proven tools with an intelligent momentum-based background visualization system.
📊 FEATURES
Bollinger Bands
Standard Bollinger Bands implementation with full customization options:
Adjustable period length (default: 20)
Multiple moving average types: SMA, EMA, SMMA (RMA), WMA, VWMA
Configurable standard deviation multiplier (default: 2.0)
Visual fill between bands to highlight volatility zones
Offset capability for forward/backward display
Session VWAP (Volume Weighted Average Price)
Automatically resets at the start of each trading session:
Calculates true volume-weighted average price
Resets daily to provide fresh reference levels
Customizable source input (default: HLC3)
Adjustable line appearance (color and width)
Can be toggled on/off as needed
4-State MACD Background System
This is the unique feature of this indicator. The chart background dynamically changes based on MACD momentum analysis, providing instant visual feedback on trend strength and direction:
🟢 Strong Bullish (Bright Green)
MACD line is above signal line
Histogram is growing (momentum accelerating upward)
Indicates strong upward momentum
🟢 Weak Bullish (Pale Green)
MACD line is above signal line
Histogram is shrinking (momentum decelerating)
Early warning signal that uptrend may be weakening
🔴 Strong Bearish (Bright Red)
MACD line is below signal line
Histogram is falling (momentum accelerating downward)
Indicates strong downward momentum
🔴 Weak Bearish (Pale Red)
MACD line is below signal line
Histogram is rising (momentum decelerating)
Early warning signal that downtrend may be weakening
🎯 HOW TO USE
For Trend Trading:
Strong colored backgrounds indicate confirmed momentum in that direction - consider staying with the trend
Weak colored backgrounds signal potential momentum exhaustion - watch for possible reversals
Use VWAP as a dynamic support/resistance level
Bollinger Band breakouts combined with strong MACD backgrounds can confirm trend strength
Price above VWAP + strong bullish background = bullish bias
Price below VWAP + strong bearish background = bearish bias
For Mean Reversion:
Price touching upper/lower Bollinger Bands with weak MACD background may suggest potential reversal
VWAP acts as a mean reversion anchor during range-bound sessions
Background color shifts from strong to weak often precede price direction changes
Look for price return to VWAP when extended beyond bands with weakening momentum
Signal Confirmation:
Strongest signals occur when multiple indicators align:
BB breakout + MACD strong color + price above/below VWAP
Price rejection at BB bands + MACD color weakening
VWAP support/resistance hold + MACD color change
⚙️ SETTINGS
All components are fully customizable through organized input groups:
Bollinger Bands Group:
Period length
Moving average type (SMA/EMA/SMMA/WMA/VWMA)
Source (close/open/high/low/etc.)
Standard deviation multiplier
Offset
VWAP Group:
Toggle show/hide
Source calculation method
Line color
Line width
MACD Group:
Toggle background on/off
Fast length (default: 12)
Slow length (default: 26)
Signal length (default: 9)
Source
Four separate color settings for each momentum state
All colors include transparency controls
💡 EDUCATIONAL VALUE
This indicator teaches important concepts:
How volatility (Bollinger Bands) relates to price movement
The importance of volume-weighted pricing (VWAP)
Momentum analysis through MACD
How combining multiple timeframes and indicators can provide confluence
The difference between trend strength and trend direction
⚠️ IMPORTANT NOTES
This indicator is for educational and informational purposes only
No indicator is perfect - always use proper risk management
Past performance does not guarantee future results
Combine with your own analysis and risk tolerance
Test thoroughly on historical data before live trading
This is not financial advice - use at your own risk
🔧 TECHNICAL DETAILS
Pine Script Version 6
Overlay indicator (displays on price chart)
All calculations use standard, well-documented formulas
Minimal lag due to efficient coding
Compatible with all timeframes and instruments
No repainting - all signals are confirmed on bar close
📝 CHANGELOG
Version 1.0
Initial release
Bollinger Bands with multiple MA types
Session VWAP with daily reset
4-state MACD background system
Full customization options
Developed for traders who want multiple confirmation signals in a clean, organized format without cluttering their charts with separate indicator panels.

@Complete Squeeze Cycle Detector v2.0 FINALDescription:
The Complete Squeeze Cycle Detector identifies and tracks the full lifecycle of squeeze formations, from pre-squeeze consolidation through active squeeze periods to squeeze completion. The indicator systematically detects the characteristic conditions that precede and accompany squeeze events.
The indicator monitors multiple factors associated with squeeze development including:
• Volatility compression relative to recent volume activity
• Elevated market stress conditions as measured by VIX levels
• Momentum compression through rate of change measurements across multiple time periods
• Alignment of multiple exponential moving averages indicating consolidation
The squeeze cycle is classified into three distinct phases: Pre-Squeeze Setup, Active Squeeze, and Squeeze Complete. Each phase is identified based on threshold levels of multiple compression metrics, with adjustable sensitivity settings to control the strictness of detection.
The indicator provides visual identification of each phase through labels, background coloring, and an optional dashboard, allowing users to distinguish between the preparation phase where volatility contracts, the active squeeze phase where compression reaches critical levels, and the completion phase where the squeeze releases and directional movement resumes.
This systematic approach enables users to identify squeeze formations throughout their complete development cycle rather than focusing only on the breakout phase.

XAUUSD Pro Setup Suite manuel_lnt.fx is an advanced Pine Script v6 indicator designed exclusively for XAUUSD, built to automatically detect the 5 highest-probability setups in gold day trading.
It combines institutional price action, volatility patterns, mean reversion logic, and momentum confirmation to generate clean, filtered, and actionable signals.
The indicator automatically detects:
⸻
1️⃣ Break & Retest Premium (BR)
Identifies valid breaks of key levels and signals the retest with rejection wick, EMA20 trend confirmation, and neutral RSI.
→ Excellent for trend continuation.
⸻
2️⃣ Fakeout Liquidity Trap (FO)
Detects liquidity grabs above highs or below lows with an opposite close + engulfing candle confirmation.
→ The strongest setup for fast and explosive reversals on gold.
⸻
3️⃣ MACD Zero-Line Shift (MACD)
Signals when the MACD crosses the zero line while price breaks micro-structure.
→ Perfect for spotting the start of a new trend.
⸻
4️⃣ Bollinger Squeeze → Breakout (BB)
Recognizes volatility compression and signals when a breakout is likely to explode.
→ Ideal for clean breakout trades.
⸻
5️⃣ Mean Reversion on EMA50 (MR)
Highlights price extensions far away from the EMA50 with ATR confirmation and a reversal candle.
→ Great for pullbacks back toward the mean value.

Momentum Squeeze Candle [Darwinian]# Momentum Squeeze Candle
Professional squeeze detection indicator with Wyckoff accumulation/distribution analysis and multi-method momentum signals.
## Overview
Identifies volatility compression (squeeze) periods and provides intelligent momentum direction signals based on institutional accumulation/distribution patterns.
## Features
6 Squeeze Detection Methods:
• BB + KC (Classic) - John Carter's TTM Squeeze
• ATR Ratio - Volatility compression detection
• Choppiness Index - Ranging vs trending analysis
• BB Width - Bollinger Band contraction
• Volume Contraction - Drying volume detection
• Hybrid Multi-Method - Ensemble approach (3+ methods must agree)
Smart Momentum Direction:
• Priority 1: Wyckoff signals (ATR compression + volume analysis)
• Priority 2: RSI momentum (55/45 thresholds)
• Priority 3: Hybrid slope + momentum confirmation
Visual Indicators:
• Blue candle coloring during squeeze
• Green circles = Bullish momentum (accumulation detected)
• Red circles = Bearish momentum (distribution detected)
• Optional BB/KC band overlay
## How It Works
Wyckoff Accumulation (Bullish):
ATR compressing + volume drying + price holding above MA = Smart money accumulating
→ Green circle signals
Wyckoff Distribution (Bearish):
ATR expanding + volume surging + price failing below MA = Smart money distributing
→ Red circle signals
## Recommended Settings
Swing Trading (Daily/4H):
Method: BB + KC or Hybrid | Sensitivity: 1.2-1.5
Day Trading (15m-1H):
Method: ATR Ratio or BB Width | Sensitivity: 0.8-1.0
Scalping (1m-5m):
Method: Volume Contraction | Sensitivity: 0.7-0.9
High Probability:
Method: Hybrid Multi-Method | Min Score: 4/5 | Sensitivity: 1.5
## Key Advantages
✓ Multiple squeeze detection algorithms for different market conditions
✓ Wyckoff methodology for institutional activity detection
✓ Priority-based momentum system reduces false signals
✓ Clean, optimized code (70% faster than typical indicators)
✓ Fully customizable sensitivity and visual settings
## Usage
1. Choose squeeze detection method based on your trading style
2. Watch for blue candles (squeeze active)
3. Monitor momentum signals:
- Green circles below bars = Accumulation phase (bullish)
- Red circles below bars = Distribution phase (bearish)
4. Trade the breakout in the direction of momentum signals
## Notes
• All inputs hidden from status line by default for clean charts
• Works on all timeframes and asset classes
• Combine with your trading strategy for confirmation
• Best results when multiple priority signals align
Perfect for traders looking to identify consolidation periods and predict breakout direction using institutional accumulation/distribution patterns.

NY VIX Channel Trend US Futures Day Trade StrategyNY VIX Channel Trend Strategy
Summary in one paragraph
Session anchored intraday strategy for index futures such as ES and NQ on one to fifteen minute charts. It acts only after the first configurable window of New York Regular Trading Hours and uses a VIX derived daily implied move to form a realistic channel from the session open. Originality comes from using a pure implied volatility yardstick as portable support and resistance, then committing in the direction of the first window close relative to the open. Add it to a clean chart and trade the simple visuals. For conservative alerts use on bar close.
Scope and intent
• Markets. Index futures ES and NQ
• Timeframes. One to thirty minutes
• Default demo. ES1 on five minutes
• Purpose. Provide a portable intraday yardstick for entries and exits without curve fitting
• Limits. This is a strategy. Orders are simulated on standard candles
Originality and usefulness
• Unique concept. A VIX only channel anchored at 09:30 New York plus a single window trend test
• Addresses. False urgency at session open and unrealistic bands from arbitrary multipliers
• Testability. Every input is visible and the channel is plotted so users can audit behavior
• Portable yardstick. Daily implied move equals VIX percent divided by square root of two hundred fifty two
• Protected status. None. Method and use are fully disclosed
Method overview in plain language
Take the daily VIX or VIX9D value, convert it to a daily fraction by dividing by square root of two hundred fifty two, then anchor a symmetric channel at the New York session open. Observe the first N minutes. If that window closes above the open the bias is long. If it closes below the open the bias is short. One trade per session. Exits occur at the channel boundary or at a bracket based on a user selected VIX factor. Positions are closed a set number of minutes before the session ends.
Base measures
Return basis. The daily implied move unit equals VIX percent divided by square root of two hundred fifty two and serves as the distance unit for targets and stops.
Components
• VIX Channel. Top, mid, bottom lines anchored at 09:30 New York. No extra multipliers
• Window Trend. Close of the first N minutes relative to the session open sets direction
• Risk Bracket. Take profit and stop loss equal to VIX unit times user factor
• Session Window. Uses the exchange time of the chart
Fusion rule
Minimum gates count equals one. The trade only arms after the window has elapsed and a direction exists. One entry per session.
Signal rule
• Long when the window close is above the session open and the window has completed
• Short when the window close is below the session open and the window has completed
• Exit on channel touch. Long exits at the top. Short exits at the bottom
• Flat thirty minutes before the session close or at the user setting
Inputs with guidance
Setup
• Use VIX9D. Width source. Typical true for fast tone or false for baseline
• Use daily OPEN. Toggle for sensitivity to overnight changes
Logic
• Window minutes. Five to one hundred twenty. Larger values delay entries and reduce whipsaw
• VIX factor for TP. Zero point five to two. Raising it widens the profit target
• VIX factor for SL. Zero point five to two. Raising it widens the stop
• Exit minutes before close. Fifteen to ninety. Raising it exits earlier
Properties visible in this publication
• Initial capital one hundred thousand USD
• Base currency USD
• request.security uses lookahead off
• Commission cash per contract two point five $ per each contract. Slippage one tick
• Default order size method FIXED with value one contract. Pyramiding zero. Process orders on close ON. Bar magnifier OFF. Recalculate after order is filled OFF. Calc on every tick ON
Realism and responsible publication
No performance claims. Past results never guarantee future outcomes. Fills and slippage vary by venue. Shapes can move while a bar forms and settle on close. Strategy uses standard candles.
Honest limitations and failure modes
Economic releases and thin liquidity can break the channel. Very quiet regimes can reduce signal contrast. Session windows follow the exchange time of the chart. If both stop and target can be hit within one bar, assume stop first for conservative reading without bar magnifier.
Works best in liquid hours of New York RTH. Very large gaps and surprise news may exceed the implied channel. Always validate on the symbols you trade.
Entries and exits
• Entry logic. After the first window, go long if the window close is above the session open, go short if below
• Exit logic. Long exits at the channel top or at the take profit or stop. Short exits at the channel bottom or at the take profit or stop. Flat before session close by the configured minutes
• Risk model. Initial stop and target based on the VIX unit times user factors. No trail and no break even. No cooldown
• Tie handling. Treat as stop first for conservative interpretation
Position sizing
Fixed size one contract per trade. Target risk per trade should generally remain near one percent of account equity. Risk is based on the daily volatility value, the max loss from the tests for one year duration with 5min chart was 4%, while the avg loss was below <1% of the total capital.
If you have any questions please let me know. Thank you for coming by !

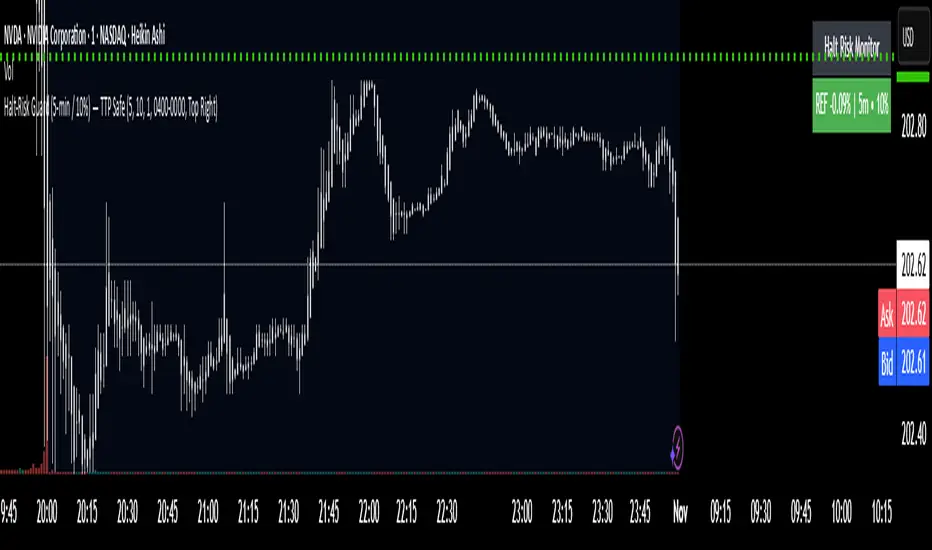
Halt-Risk Guard (5-min / 10%) — TTP Safe🛑 Halt-Risk Guard (5-min / 10%) — TTP Safe
Stay clear of halts, invalidations, and over-extended moves.
🔍 Overview
The Halt-Risk Guard helps traders avoid sudden invalidations by monitoring price velocity over the past X minutes (default: 5 min) and flagging when moves exceed a configurable threshold (default: 10%).
Originally built to meet Trade The Pool (TTP) risk-management rules — where even non-halted 10% moves can void trades — this tool provides a clear, visual warning system and optional entry blocker.
⚙️ Key Features
✅ Halt-Risk Detection – Calculates both reference-based and swing-based (high↔low) percentage change over the chosen lookback period.
✅ TTP Safe Mode – “Swing mode” captures extreme volatility spikes that may invalidate trades even when the market stays open.
✅ Entry Blocker (optional) – Automatically greys candles and dims the background during risky conditions to prevent impulsive entries.
✅ Customisable Positioning – Move the on-chart info box to any corner of your chart (Top Left / Top Right / Bottom Left / Bottom Right).
✅ Clean Alerts –
⚠️ At/Above Threshold
✅ Back to Safe
⛔ Entry Blocker Active
✅ Visual Table Display – Compact dashboard shows current % move, lookback window, and threshold with intuitive green/red status.
✅ Strategy-Ready Output – A hidden 0/1 plot lets you block or filter trades in automated systems.
⚡ How It Works
Monitors the selected symbol using your chosen computation timeframe (recommended 1-minute).
Evaluates either:
REF mode: Close-to-close change over the lookback window.
SWING mode: High-to-low range within the same window.
If the move ≥ Threshold %, the script highlights a halt-risk condition and optionally activates the entry blocker.
🎨 Recommended Settings
Lookback: 5 minutes
Threshold: 10 %
Swing mode: ON (TTP-safe)
Computation timeframe: 1 minute
Entry blocker: ON
Dim background: ON
🧠 Use Cases
TTP and other prop-firm evaluations enforcing price-movement limits.
Volatility-based scalping systems to avoid chasing extended candles.
Strategy filters for algorithmic entries (e.g. pause trading during halt-risk windows).
⚠️ Disclaimer
This tool provides visual and alert-based guidance only. It does not guarantee compliance with any specific firm’s rules or eliminate trading risk. Always verify thresholds and rules with your broker or evaluation provider.
ATR DAILY PROGRESSION)Indicator: ATR Daily Progression — Final Compact Edition
1. Indicator Objective
The ATR Daily Progression indicator measures the progression of intraday volatility as a percentage of the daily Average True Range (ATR).
It provides a quick visual overview of whether the market has reached or exceeded its average daily range of movement.
This helps traders avoid entering low-probability continuation trades once the day’s ATR is already completed.
2. Visual Presentation
Horizontal bar ranging from 0% to 150% of the ATR.
Green color up to 100%, then red beyond that point.
Main ticks: 0, 25, 50, 75, 90, 100, and 150%.
Full-height white vertical lines at 0%, 100%, and 150%.
A floating badge displaying the current ATR completion percentage, always visible.
Compact Height mode enabled by default for optimal visual integration.
3. Key Features
Function Description
Precise alignment The transition from green to red occurs exactly after the 100% tick.
Audio & visual alerts Triggered at 75%, 90%, 100%, and 150%.
Session flash effects The filled bar blinks when the ATR is reached (100%) or exceeded (150%).
Dynamic badge Displays the current ATR %, green before 100%, red after.
Compact layout Three-line table format for better chart integration.
4. Recommended Settings
ATR Length (Daily): 14
Bar width (steps): 32–40 (depending on chart size)
Always green below 100%: enabled
Show floating % badge: enabled
Compact Height: enabled by default
Flash at 75% and 90%: enabled
Flash at 100% and 150%: enabled
5. Strategic Use
The ATR Done Today is a visual discipline tool designed to help traders:
Identify when the market has likely completed its daily move.
Avoid late-session counter-trend trades.
Visualize volatility compression or expansion.
Determine optimal times to take profits or pause trading.

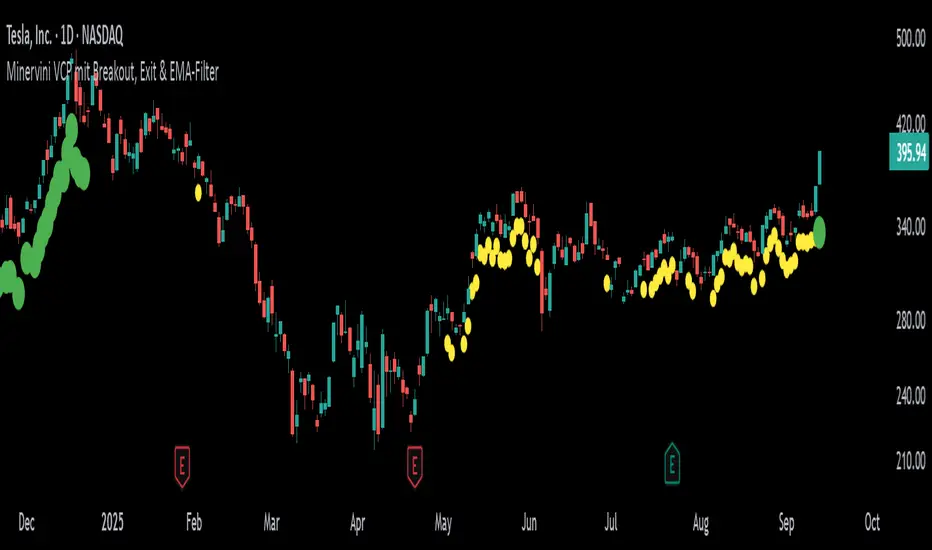
VCP-Minervini v2This indicator is based on the famous Volatility Contraction Pattern (VCP) developed by Mark Minervini. It is designed to detect breakout setups in stocks and indices and provides a complete framework for identifying and managing them.
VCP Detection: Uses ATR to measure contracting volatility and highlights potential setups with yellow markers.
Pivot Level: Once a VCP is detected, the script automatically fixes a pivot resistance level and plots it as a red line.
Breakout Signal: When price closes above the pivot and remains above the EMA, a green marker confirms that a breakout is active.
Exit Logic: If momentum fades (volume drops below average and True Range contracts), the green marker disappears, signaling it may be time to secure profits or adjust stops.
EMA Filter: Ensures that setups are only valid in the direction of the prevailing trend by requiring price to trade above the selected EMA.
How to use it
This tool is best suited for swing traders and position traders looking for clean breakout opportunities. It is not a simple mashup of indicators but an original combination specifically built for VCP setups.
Use primarily on daily or weekly charts of liquid stocks.
Build a watchlist from yellow markers (potential setups).
Watch for price closing above the pivot line to confirm the breakout.
Manage trades while the green marker is active, and take caution when it disappears.
Adjust the parameters to fine-tune detection sensitivity for your market or trading style.
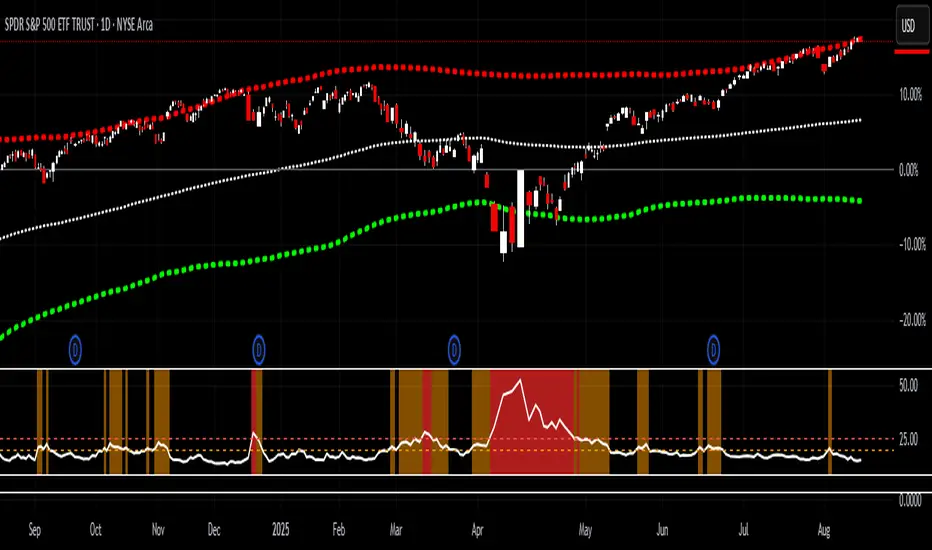
VIX > 20/25 HighlightThis indicator tracks the CBOE Volatility Index (VIX) and highlights when volatility exceeds critical thresholds.
Plots the VIX with dashed reference lines at 20 and 25.
Background turns orange when the VIX is above 20.
Background turns bright red when the VIX is above 25.
Includes alert conditions to notify you when the VIX crosses above 20 or 25.
Use this tool to quickly visualize periods of elevated market stress and manage risk accordingly.