Rolling VWAPThe Rolling VWAP indicator is a powerful technical analysis tool designed to help traders identify significant price levels and potential reversal points. This indicator combines a rolling volume-weighted average price (VWAP) with multiple standard deviation bands to provide a dynamic view of price volatility and market trends.
Key Features:
Rolling VWAP Calculation: The indicator calculates the VWAP using the high, low, and close prices (HLC3) over a user-defined rolling period. This VWAP is then plotted on the chart, providing a reliable benchmark for average price levels over a specified timeframe.
Adjustable Timeframes: Users can select from multiple timeframes (1 hour, 4 hours, 1 day, 3 days, 1 week) to calculate the RVWAP, allowing flexibility to analyze market trends over different periods.
Multiple Standard Deviation Bands: The indicator includes up to five adjustable standard deviation bands, each with customizable multipliers. These bands are plotted around the RVWAP to indicate potential support and resistance levels, helping traders identify areas of high and low volatility.
Customizable Display Settings: Users can toggle the visibility of each band and adjust their colors and transparency, making it easy to tailor the indicator to their specific analysis needs.
How to Use:
Selecting the VWAP Timeframe: Choose the desired timeframe for VWAP calculation from the options provided (1 hour, 4 hours, 1 day, 3 days, 1 week). This allows you to analyze price action over different periods and identify significant trends.
Adjusting Band Multipliers: Customize the multipliers for each standard deviation band to suit your trading strategy. By default, the indicator includes bands with multipliers of 2.0, 2.5, 3.0, 3.5, and 4.0. Adjust these values based on your preferred levels of price deviation.
Interpreting the Bands: The standard deviation bands provide key insights into market volatility. Inner Bands (e.g., 2.0 StdDev) indicate areas of normal price fluctuation. Price movement within these bands is generally considered stable. Outer Bands (e.g., 3.5 or 4.0 StdDev) highlight extreme price deviations. Price reaching these bands may signal overbought or oversold conditions, potentially leading to reversals.
Combining with Other Indicators: Enhance your analysis by using this indicator in conjunction with other technical tools such as moving averages, RSI, or MACD. This helps confirm signals and improve trading decisions.
Best Practices:
Trend Identification: Use the Rolling VWAP to identify the prevailing market trend. A rising VWAP indicates an uptrend, while a falling VWAP suggests a downtrend.
Support and Resistance Levels: The standard deviation bands act as dynamic support and resistance levels. Monitor price action around these bands for potential entry and exit points.
Volatility Analysis: Wider bands indicate higher market volatility, while narrower bands suggest lower volatility. Adjust your trading strategy accordingly based on the observed volatility levels.
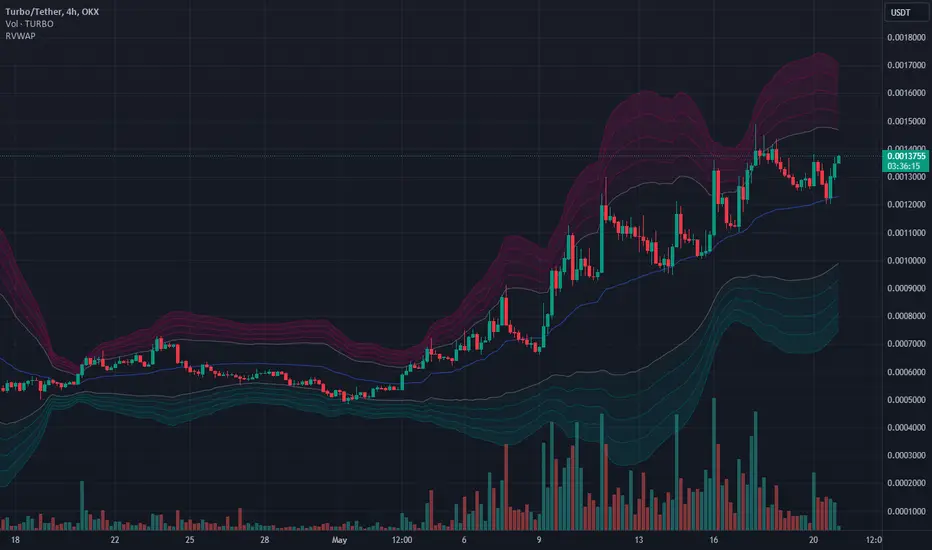
24/7 Trading Instruments: This indicator is particularly useful for instruments that trade 24/7 and do not have defined sessions, such as cryptocurrencies. Unlike a session-anchored VWAP, the rolling VWAP provides a continuous measure of average price levels, making it ideal for analyzing markets that operate around the clock.
By integrating the Rolling VWAP indicator into your trading routine, you can gain a deeper understanding of price dynamics and make more informed trading decisions. Whether you are a day trader, swing trader, or long-term investor, this indicator provides valuable insights to help you navigate the markets with confidence.
"VWAP" için komut dosyalarını ara
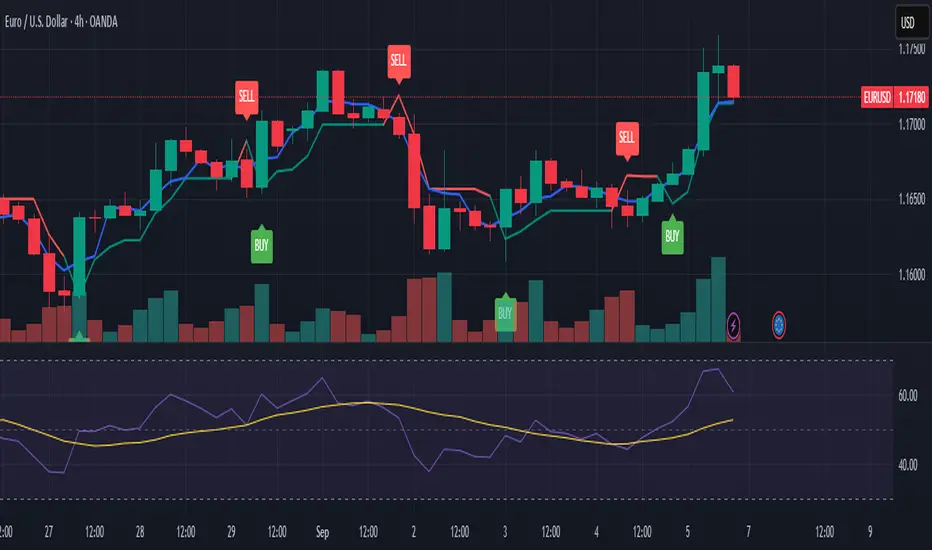
ASFX SignalsDescription:
The ASFX Signals Indicator, created by OmegaTools, is an open-source Pine Script™ code designed to provide traders with valuable signals for potential entry and exit points in the market. This script incorporates a combination of Exponential Moving Average (EMA) signals and Volume Weighted Average Price (VWAP) confluence, enhancing the precision of trading decisions.
Key Features:
Threshold Configuration: Users can customize the threshold parameter (thres) to fine-tune signal sensitivity, adapting the indicator to different market conditions.
EMA Length Customization: The script allows traders to adjust the length of the Exponential Moving Average (EMA) with the "EMA Length" input, providing flexibility in capturing various trends.
Show/Hide Options: Users have the flexibility to choose whether to display the EMA line, VWAP confluence, and VWAP upper and lower bands, tailoring the visual representation based on individual preferences.
VWAP Confluence: The indicator integrates VWAP confluence, offering additional confirmation for trading signals. Traders can choose the VWAP resolution and set the deviation parameter for enhanced accuracy.
Signal Filtering: The script intelligently filters signals based on the percentage of the candle that crosses the EMA. Long signals are filtered out if the closing price is above the VWAP or the specified threshold, and short signals are filtered out if the closing price is below the VWAP or the threshold.
Visual Signals: The indicator provides clear visual signals for long and short entries, making it easy for traders to identify potential opportunities. The signals are accompanied by arrows and labels for quick interpretation.
How to Use:
Adjust the threshold, EMA length, and VWAP parameters based on your trading preferences.
Choose whether to display the EMA line, VWAP confluence, and upper/lower bands.
Interpret long and short signals for potential entry and exit points, considering the percentage of the candle that crosses the EMA.
Consider additional confirmation provided by VWAP confluence.
Concepts and Methodology:
The ASFX Signals Indicator combines EMA signals and VWAP confluence to generate actionable trading signals. The script intelligently considers the percentage of the candle that crosses the EMA, providing a nuanced approach to signal confirmation. The EMA offers trend insights, while VWAP confluence enhances signal reliability.

Ichimoku + VWAP + OBV + ATR Full System (NQ Daytrade)Extended Indicator Description
Ichimoku + VWAP + OBV + ATR Full System is a rule-based intraday trading indicator designed specifically for NQ day trading, focusing on trend alignment, participation confirmation, and volatility-aware execution.
This indicator does not rely on a single signal or crossover. Instead, it integrates multiple market dimensions into one structured framework to help traders identify high-probability trend continuation scenarios while avoiding low-quality, range-bound conditions.
System Philosophy
The core idea of this system is simple:
trade only when trend, price location, volume, and volatility are aligned.
Each component plays a specific role and is not meant to be used in isolation. The indicator works best when all conditions reinforce the same directional bias.
Component Breakdown
Ichimoku Cloud
Used to define the primary market structure and directional bias. The system favors trades only when price action aligns clearly above or below the cloud, helping filter out indecisive or transitional phases.
VWAP
Acts as a session-based equilibrium reference. Price position and distance relative to VWAP are used to confirm whether the market is trending with intent rather than reverting to the mean.
OBV (On-Balance Volume)
Provides participation and flow confirmation. OBV helps validate whether price movement is supported by volume, reducing the likelihood of false breakouts or weak trend signals.
ATR (Average True Range)
Used as a volatility filter and risk-awareness tool. ATR conditions help the system avoid low-volatility environments and support more realistic expectations for intraday movement.
Trade Logic Overview
The system is designed around trend-following pullbacks, not prediction or counter-trend trading.
When trend structure is established and confirmed by VWAP positioning and OBV behavior, pullback zones within the trend become areas of interest. ATR conditions ensure that trades are taken only when sufficient movement potential exists.
Rather than generating frequent signals, the system prioritizes selectivity and clarity, making it suitable for disciplined day traders who value context over quantity.
Intended Use
This indicator is built for:
NQ intraday and day trading
Trend continuation and pullback strategies
Traders who prefer structured, confirmation-based systems
Lower to mid intraday timeframes such as 3-minute, 5-minute, and 15-minute charts
Important Notes
This is not an automated trading system and does not provide guaranteed results. The indicator is designed as a decision-support tool to assist with market context, directional bias, and trade timing. Risk management, execution, and position sizing remain the responsibility of the user.
롱/숏 삼각형 시그널
동그라미 청산 시그널
VWAP 밴드 기반 방향성
OBV 보조지표
이름 (Name)
BTC Scalping Signal – VWAP + OBV
짧은 설명 (Short Description)
VWAP 밴드와 OBV를 기반으로 방향성, 진입·청산 시그널을 제공하는 스캘핑 지표입니다.
긴 설명 (Long Description)
이 지표는 BTC 단기 스캘핑을 위해 설계된 것으로, 특히 15분봉 환경에 최적화되어 있습니다.
VWAP 밴드의 위치와 추세 판별 로직을 기반으로 롱·숏 진입 신호를 제공합니다.
OBV 모멘텀을 보조 필터로 사용하여 돌파 및 되돌림 가능성을 판단합니다.
시장 변동성이 축소되거나 평균회귀 신호가 감지될 때 청산 시그널을 표시합니다.
삼각형(진입), 원형(청산) 등 직관적 시각 요소를 통해 빠른 의사결정을 지원합니다.

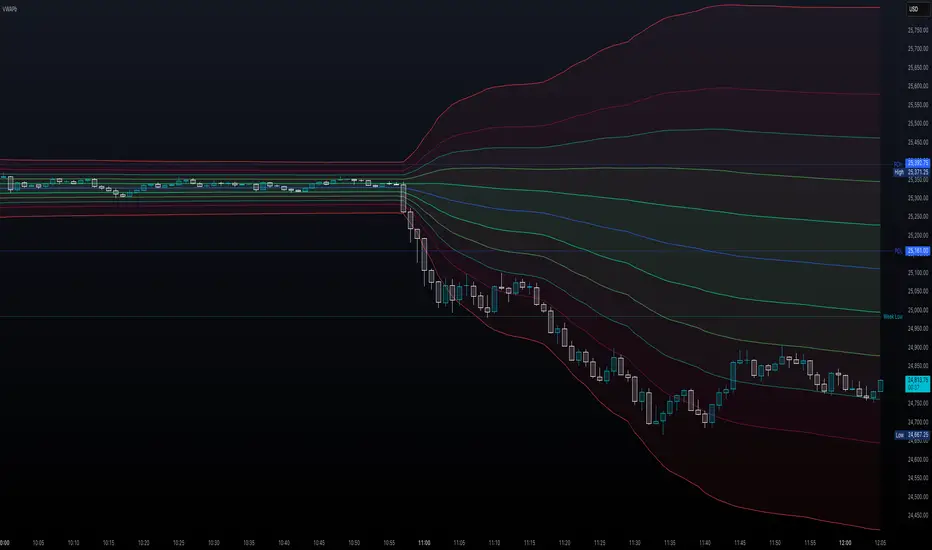
Crypto Anchored VWAP (Swing High/Low)Crypto Anchored VWAP (Swing High/Low)
This indicator provides an automatic Anchored VWAP system designed specifically for highly volatile assets such as cryptocurrencies (ETH, BTC, SOL, etc.).
Unlike traditional AVWAP tools that require manual date input, this script automatically anchors VWAP to the most recent swing high and swing low, making it ideal for real-time trend tracking and intraday/4H structure analysis.
How It Works
The script detects local swing lows and swing highs based on user-defined swing length.
When a new swing point appears, an Anchored VWAP is initialized from that specific candle.
As price evolves, the AVWAP dynamically becomes:
A trend boundary
A fair-value line
A mean-reversion attractor
Traders can use these levels to identify:
Trend continuation
Breakout confirmation
Mean reversion pullbacks
Overextended expansions
Included Features
✔ Auto-Anchored VWAP from swing low
✔ Auto-Anchored VWAP from swing high
✔ Standard deviation bands (1σ) for volatility context
✔ Designed for Crypto 4H / 1H / 15m
✔ Works on any asset & any timeframe
How To Use
1. Trend Direction
Price above Swing-Low VWAP → Bullish bias
Price below Swing-High VWAP → Bearish bias
2. Trade Setups
Break → Retest → Hold above AVWAP = Trend continuation long
Reject from AVWAP / σ band = Mean-reversion short setup
AVWAP zone → High probability liquidity reaction
3. Volatility Bands
Price touching +1σ = extension
Price returning to 0σ = mean reversion
Price breaking −1σ = trend weakening
Inputs
Swing Length: determines sensitivity of swing high/low detection
(Default: 5)
Best Use Cases
ETH 4H trend following
BTC structure shifts
Altcoin volatility filtering
Identifying institutional "cost basis" zones
Confirming breakouts / fakeouts
Notes
This is not a trading system by itself but a structural tool meant to help traders understand trend and value location. Always combine AVWAP with market structure, volume, and risk management.
Disclaimer
This script is for educational and informational purposes only. It does not constitute financial advice or a recommendation to buy or sell any asset. Use at your own discretion.

Anchored VWAP + Bands + Signals//@version=5
indicator("Anchored VWAP + Bands + Signals", overlay=true)
// ===== INPUTS =====
anchorTime = input.time(timestamp("2025-12-02 00:00"), "Anchor Date/Time")
std1 = input.float(1.0, "±1σ Band")
std2 = input.float(2.0, "±2σ Band")
// ===== VWAP CALCULATION =====
var float cumPV = 0.0
var float cumVol = 0.0
if time >= anchorTime
cumPV += close * volume
cumVol += volume
vwap = cumVol != 0 ? cumPV / cumVol : na
// ===== STANDARD DEVIATION =====
barsSinceAnchor = bar_index - ta.valuewhen(time >= anchorTime, bar_index, 0)
sd = barsSinceAnchor > 1 ? ta.stdev(close, barsSinceAnchor) : 0
// ===== BANDS =====
upper1 = vwap + std1 * sd
lower1 = vwap - std1 * sd
upper2 = vwap + std2 * sd
lower2 = vwap - std2 * sd
plot(vwap, color=color.orange, title="VWAP")
plot(upper1, color=color.green, title="+1σ Band")
plot(lower1, color=color.green, title="-1σ Band")
plot(upper2, color=color.red, title="+2σ Band")
plot(lower2, color=color.red, title="-2σ Band")
// ===== SIGNALS =====
buySignal = ta.crossover(close, lower1)
sellSignal = ta.crossunder(close, upper1)
plotshape(buySignal, style=shape.triangleup, location=location.belowbar, color=color.green, size=size.small, title="Buy Signal")
plotshape(sellSignal, style=shape.triangledown, location=location.abovebar, color=color.red, size=size.small, title="Sell Signal")
alertcondition(buySignal, title="Buy Alert", message="Price touched lower 1σ band – Buy Opportunity")
alertcondition(sellSignal, title="Sell Alert", message="Price touched upper 1σ band – Sell Opportunity")

SPY EMA + VWAP Day Trading Strategy (Market Hours Only)//@version=5
indicator("SPY EMA + VWAP Day Trading Strategy (Market Hours Only)", overlay=true)
// === Market Hours Filter (EST / New York Time) ===
nySession = input.session("0930-1600", "Market Session (NY Time)")
inSession = time(timeframe.period, "America/New_York") >= time(nySession, "America/New_York")
// EMAs
ema9 = ta.ema(close, 9)
ema21 = ta.ema(close, 21)
// VWAP
vwap = ta.vwap(close)
// Plot EMAs & VWAP
plot(ema9, "EMA 9", color=color.green, linewidth=2)
plot(ema21, "EMA 21", color=color.orange, linewidth=2)
plot(vwap, "VWAP", color=color.blue, linewidth=2)
// ----------- Signals -----------
long_raw = close > ema9 and ema9 > ema21 and close > vwap and ta.crossover(ema9, ema21)
short_raw = close < ema9 and ema9 < ema21 and close < vwap and ta.crossunder(ema9, ema21)
// Apply Market Hours Filter
long_signal = long_raw and inSession
short_signal = short_raw and inSession
// Plot Signals
plotshape(long_signal,
title="BUY",
style=shape.labelup,
location=location.belowbar,
color=color.green,
size=size.small,
text="BUY")
plotshape(short_signal,
title="SELL",
style=shape.labeldown,
location=location.abovebar,
color=color.red,
size=size.small,
text="SELL")
// Alerts
alertcondition(long_signal, title="BUY Alert", message="BUY Signal (Market Hours Only)")
alertcondition(short_signal, title="SELL Alert", message="SELL Signal (Market Hours Only)")

Current Day OHLMV Pro+Current Day OHLM + Anchored VWAP – Professional Edition
OVERVIEW
Real-time display of the current trading day’s developing Open, High, Low, Close (live), and anchored VWAP with a full-size current-day candle rendered in the right margin for instant intraday context.
CONCEPT BACKGROUND
Tracking the live day’s OHLM and anchored VWAP is a public-domain institutional practice used for intraday fair-value assessment and volume-weighted bias.
IMPLEMENTATION & VALUE ADDED
• Live anchored VWAP plotted and updated bar-by-bar as a dynamic key level
• Full current-day candle displayed in the right margin (perfectly aligned with price axis)
• All levels (Open, High, Low, Close, VWAP, Midpoint) as exportable plots for CSV download and custom analysis
• Comprehensive alerts on every level and VWAP touch/break
• Clean, lightweight, no-repaint performance on any intraday timeframe
HOW TO USE
Apply to 1–60 min charts. Use the live VWAP as the primary volume-weighted fair-value line and the right-margin candle for immediate visual context of today’s developing range and bias.
CREDIT & TRANSPARENCY
Core methodology: public domain (Current Day OHLM + Anchored VWAP).
This is an independent implementation. The right-margin live candle display, exportable plots, alerting system, and overall presentation are original.
DISCLAIMER
For educational and informational purposes only. Not financial advice. Test thoroughly.

ST – EQ Bands, VWAP [Soothing Trades]Short Description
ST – EQ Bands, VWAP plots a smooth equilibrium line, inner and outer volatility bands (R1/S1, R2/S2), and VWAP on your chart. It's a fixed-settings overlay designed to show you fair value, stretch, and reaction zones at a glance, without any configuration.
Full Description
This tool combines three ideas into one clean overlay:
• A SuperSmoother equilibrium line (EQ) built from hlc3
• Two sets of ATR-scaled volatility bands (inner and outer)
• A standard VWAP line
All of them are updated in real time and extended to the left using horizontal line objects.
Core logic
• Source: hlc3 (average of high, low, close).
• The equilibrium line uses a fixed-length SuperSmoother filter (len = 200) to stay smooth but responsive.
• Volatility is measured using a smoothed version of true range (ATR) run through the same SuperSmoother engine.
• Inner and outer ranges are created by multiplying this smoothed ATR by constants, then by π (pi), and offsetting EQ up/down.
From those, the script derives:
• EQ – main equilibrium line.
• R1 / S1 – inner bands around EQ (moderate stretch).
• R2 / S2 – wider outer bands (stronger stretch).
• VWAP – TradingView's built-in volume-weighted average price.
How to read it
When price is near EQ, the market is hovering around its smoothed mean.
When price oscillates between S1 and R1, you're often in a controlled, rotational environment – good for mean-reversion or balanced trend trades.
When price pushes into R2/S2, the move is more extended:
• In slower regimes this can flag exhaustion / fade zones.
• In strong trends it can highlight powerful continuation swings where pullbacks toward inner bands are opportunities.
VWAP adds another layer:
• Price relative to VWAP vs EQ tells you if the market is leaning with or against where most volume has transacted.
• EQ + VWAP confluence can mark important "fair value" hubs or flip zones intraday.
Visual design
• EQ line (thicker) to stand out as the core reference.
• Inner bands (R1/S1) as subtle, nearby bands.
• Outer bands (R2/S2) as a dashed, more distant envelope.
• VWAP as its own line with distinct color and width.
• All lines extend left from the most recent bar so structure remains visible when you scroll back.
Inputs
This version is intentionally hard coded for simplicity and consistency:
• No user inputs in the panel; all key parameters (length, multipliers, colors, extension) are pre-tuned.
• Just add it to your chart and start reading the structure.
• (Advanced users can adjust internals directly in the code if they want to experiment, but that isn't required.)
Use cases
• Quickly see when price is compressed vs stretched.
• Frame trades around: EQ crosses and retests, Reactions at inner bands, Extreme moves into outer bands, VWAP alignment or divergence.
• Use as a higher-timeframe context tool in combination with your own entries and execution signals.
Notes & disclaimer
• Works across most symbols and timeframes supported by TradingView Pine Script v6.
• For educational and analytical use only. Not financial advice or a trading signal service.
• Always test and manage your own risk before using any indicator live.

Nifty SMC S&R MA and All Indicator[SumitQuants]🇮🇳🔥 **Nifty SMC S&R + MA + VWAP + Order Flow Suite
**
Built for Indian Markets • Tuned for NIFTY, BANKNIFTY & NSE Stocks
A complete institutional-grade trading system crafted for Indian traders who want a serious edge using Smart Money Concepts, Market Structure, Support–Resistance Strength, VWAP, Breakout Logic & Trend Tools — all combined into ONE ultra-optimized indicator.
🧠 Why This Indicator Stands Out
Most indicators only show price.
This one shows intent — clear, confident, and easy to read.
It reveals:
➡ where institutions are active
➡ where liquidity is sitting
➡ where real strength is building
➡ and who is actually in control — buyers or sellers
This is how professional desks read the markets — and now you can too.
🔥 What’s Inside (Complete Feature Stack)
🟧 1. Support–Resistance Strength Engine (Buyer/Seller Strength %)
Your built-in market power meter:
🟦 Auto S/R zones
🟩 Buyer vs Seller Strength %
🟨 Strength boxes with clean visuals
🔁 Live reactions when price taps strong or weak zones
Perfect for timing entries, reversals, retests and trap-detections in NIFTY & BANKNIFTY.
🟩 2. Smart Money Concepts (Full SMC Suite)
A complete institutional SMC system:
✔ BOS / CHoCH (Internal + Swing)
✔ Market Structure in real time
✔ Internal & Swing Order Blocks
✔ Strong / Weak Highs & Lows
✔ Equal High / Equal Low (EQH/EQL)
✔ Fair Value Gaps (FVG)
✔ Trend Bias Coloring
✔ Premium / Discount Zones
Every element is built for clarity — high-quality visuals without chart clutter.
📈 3. Moving Average Suite (5 Fully Custom MAs)
Elegant MA system for trend confirmation:
✨ EMA
✨ SMA
✨ SMMA
✨ WMA
✨ VWMA
Beautiful colors, clean visibility, and completely optional — enable only what you need.
⚡ 4. Enhanced Supertrend System
A modern Supertrend built for actual usability:
🎨 3 display styles (Line / Histogram / Ghost Mode)
🔄 Clear trend-change signals
🌗 Background trend zones
⚡ No repaint
⏰ Alerts for every reversal
Ideal for intraday momentum and bias confirmation.
📉 5. Breakouts with Volume Confirmation
Stops you from getting trapped in fakeouts:
🔥 Support Break
🔥 Resistance Break
🟦 Bullish Rejection
🟥 Bearish Rejection
📈 Volume-validated breakouts
📊 Smooth visual labels for clean execution
Ultra useful for NIFTY/BANKNIFTY’s typical stophunt → reversal patterns.
🎯 6. VWAP System with Multi-Band Zones
Professional VWAP for Indian markets:
✔ Session VWAP
✔ Weekly VWAP
✔ Monthly VWAP
✔ Premium–Discount Zones
✔ Expansion vs Mean-Reversion levels
✔ Clean visual bands
Perfect for intraday scalping & morning session planning.
🔔 7. Full Alerts Framework Included
Get notified for all key institutional events:
🚨 BOS / CHoCH
🚨 Order Block Breakouts
🚨 Equal High/Low
🚨 Fair Value Gaps
🚨 Trend Changes
🚨 Breakouts
🚨 Swing / Internal Structure Events
Never miss a major shift again — even when away from charts.
🧽 8. Clean UI + Auto Watermark
🖤 Dark/Light mode optimized
🧊 Smooth spacing
✨ Minimalistic visuals
🔍 Zero chart clutter
⚡ High-performance
A premium interface built for Indian index trading.
🧪 Who Is This Built For?
✔ Intraday F&O Traders
✔ NIFTY & BANKNIFTY Scalpers
✔ Swing Traders
✔ Price Action + SMC Traders
✔ VWAP-Based Scalpers
✔ Anyone wanting a complete premium system in a single indicator
⚡ Why Indian Traders Love It
⚡ Captures Nifty morning trap zones
⚡ Predicts London session expansions
⚡ Warns about NY reversal pressure
⚡ Identifies true institutional footprints
⚡ Shows real strength behind S/R zones
⚡ Eliminates false breakouts
⚡ Gives bias, structure & context instantly
This is not just an indicator —
It’s a full institutional trading framework.
🛒 Get Full Access
This indicator is available exclusively inside the Courses section on the official website.
👉 Purchase & Access:
www.ironmindtrader.com
Inside the course:
🔧 Installation Steps
⚙️ Recommended Settings
📘 Trading Logic
🔄 Lifetime Updates Included

Victoria Overlay - HTF 200 + VWAP + ATR Stop + MA TrioConsolidated road to minions
Buy Setup:
EMA1 crosses above SMA3.
RSI confirms above 50.
Volume increasing (confirming momentum).
Candle closes above SMA1 base.
Sell Setup:
EMA1 crosses below SMA3.
RSI drops below 50 or exits overbought.
Volume confirms (declining or reversing).
Candle closes below SMA1 base.
Tips:
Think of EMA1 as the scalper’s trigger.
SMA3 is your momentum check.
SMA1 (base) = short-term bias.
Avoid entries during low-volume chop.
Use for day trades or tight scalps; exits happen fast.
Overlay (Smoothed Heikin Ashi + Swing + VWAP + ATR Stop + 200-SMA)
Purpose: Multi-layer trend confirmation + clean structure.
Type: Swing alignment tool.
🟩 BUY / CALL Conditions
Green “Buy (Gated)” arrow appears.
Price is above VWAP, above 200-SMA, and above ATR stop.
ATR stop (green line) sits under price → support confirmed.
Heikin-Ashi candles are green/lime.
Bias label says “Above VWAP | Above 200 | Swing Up”.
🟥 SELL / PUT Conditions
Red “Sell (Gated)” arrow appears.
Price is below VWAP, below 200-SMA, and below ATR stop.
ATR stop (red line) sits above price → resistance confirmed.
Heikin-Ashi candles are red.
Bias label says “Below VWAP | Below 200 | Swing Down”.
Exit / Risk Control:
Close position when price crosses ATR stop.
If Heikin candles flip color, momentum is reversing.
Best Use Cases:
For next-day or multi-hour swing entries.
Use ATR Stop for dynamic stop loss.
Stay out when the bias label is mixed (e.g. “Above VWAP | Below 200 | Swing Down”).
Pro Tip:
On big news days, let VWAP reset post-open before acting on arrows — filters fake signals.
RSI Panel Pro (v6)
Purpose: Strength + exhaustion confirmation.
Type: Momentum filter.
Key Levels:
Overbought: 80+ → take profits soon.
Oversold: 20– → watch for bounce setups.
Bull regime: RSI above 60 = momentum strong.
Bear regime: RSI below 40 = weakness.
Buy / Entry Signals:
RSI crosses up from below 40 or 20.
RSI line is above RSI-EMA (gray line).
Higher timeframe RSI (if used) is also rising.
Trim / Exit:
RSI drops under 60 after being strong.
RSI crosses below its EMA.
Sell / Put Setup:
RSI fails at 60 or drops below 40.
RSI crosses under EMA after a bounce.
Tips:
Pair RSI panel with Victoria Overlay — only take gated buys when RSI confirms.
RSI < 40 but above 20 = “loading zone” for reversals.
RSI > 70 = overextended → wait for confirmation before entering.
Combined Execution Rules
Goal What to Watch Action
Entry (CALL) EMA1 > SMA3, Buy (Gated) arrow, RSI rising > 50 Buy call / open long
Entry (PUT) EMA1 < SMA3, Sell (Gated) arrow, RSI < 50 Buy put / open short
Exit Early Price crosses ATR stop or RSI flips under EMA Exit trade / protect gains
Trend Filter VWAP + 200-SMA alignment Only trade in that direction
Avoid Trades Conflicting bias label or low volume Stay flat
Pro Tips
VWAP → Intraday mean: above = bullish control, below = bearish control.
ATR Stop → Dynamic trailing stop: never widen it manually.
Smoothed Heikin-Ashi → filters noise: trend stays until color flips twice.
RSI Panel → confirms whether to hold through pullbacks.
If RSI and Overlay disagree — wait, not trade.

Condition Indicator – Session VWAP - Simulated BUY and SELL 🧩 Short Description (Summary):
A dual-purpose trading indicator that combines moving-average-based simulated trade zones with session VWAP structure analysis to visualize short-term market bias and potential turning points.
📘 **Full Description (for the "About" section):
Condition Indicator – Session VWAP and Simulated MA Structure
This indicator blends simulated trade logic with session-based VWAP analysis to help traders visualize when short-term and long-term market conditions align or diverge.
🧠 Key Features
Simulated Trades:
The script uses two simple moving averages (short and long) to simulate theoretical long and short trade averages over time.
It accumulates “positions” periodically (based on a user-defined minute interval) to illustrate how simulated positions would behave during trend shifts.
Session VWAP & Structure Analysis:
Calculates a dynamic VWAP and standard deviation bands for each session (daily, weekly, monthly, or hourly).
Compares price action against VWAP zones to detect whether trading volume is concentrated inside or outside equilibrium.
Support & Resistance Visualization:
Automatically identifies potential support/resistance zones based on previous session highs/lows and relative bullish or bearish volume distribution.
Market Bias Highlight:
Background color changes dynamically to represent bullish or bearish simulated conditions.
⚙️ Inputs
Long MA length / Short MA length: control the sensitivity of trend detection.
Simulated Trade Frequency: how often simulated positions are updated (in minutes).
Session Type: define the timeframe for VWAP and structure analysis (D, W, M, 60, etc.).
📈 Visualization
Red and green lines indicate simulated short/long trade averages.
VWAP line and deviation zones show session equilibrium shifts.
Background shading represents the active simulated market condition.
⚠️ Disclaimer
This script is for educational and analytical purposes only.
It is not financial advice, a trading signal, or a guaranteed strategy.
Always do your own research and consult a qualified financial professional before making trading decisions.

Institutional Orderflow Pro — VWAP, Delta, and Liquidity
Institutional Orderflow Pro is a next-generation order flow analysis indicator designed to help traders identify institutional participation, directional bias, and exhaustion zones in real time.
Unlike traditional volume-based indicators, it merges VWAP dynamics, cumulative delta, relative volume, and liquidity proximity into a single unified dashboard that updates tick-by-tick — without repainting.
The indicator is open-source, transparent, and educational. It aims to provide traders with a clearer read on who controls the market — buyers or sellers — and where liquidity lies.
The indicator combines multiple institutional-grade analytics into one framework:
RVOL (Relative Volume) = Compares current volume against the average of recent bars to identify strong institutional participation.
zΔ (Delta Z-Score) = Normalizes the buying/selling delta to reveal unusually aggressive market behavior.
CVDΔ (Cumulative Volume Delta Change) = Shows which side (buyers/sellers) is dominating this bar’s order flow.
VWAP Direction & Slope = Determines whether price is trading above/below VWAP and whether VWAP is trending or flat.
PD Distance (Prev Day Confluence) = Measures the current price’s distance from previous day’s high, low, close, and VWAP in ATR units — highlighting liquidity zones.
ABS/EXH Detection = Identifies institutional absorption and exhaustion patterns where momentum may reverse.
Bias Computation = Combines VWAP direction + slope to give a simplified regime signal: UP, DOWN, or FLAT.
All metrics are displayed through a color-coded, non-repainting HUD:
🟢 = bullish / favorable conditions
🔴 = bearish / weak conditions
⚫ = neutral / flat
🟡 = absorption (potential trap zone)
🟠 = exhaustion (momentum fading)
| Metric | Signal | Meaning |
| ---------------------- | ------- | ---------------------------------------------- |
| **RVOL ≥ 1.3** | 🟢 | High institutional activity — valid setup zone |
| **zΔ ≥ 1.2 / ≤ -1.2** | 🟢 / 🔴 | Unusual buy/sell aggression |
| **CVDΔ > 0** | 🟢 | Buyers dominate this bar |
| **VWAP dir ↑ / ↓** | 🟢 / 🔴 | Institutional bias long/short |
| **Slope ok = YES** | 🟢 | Trending market |
| **PD dist ≤ 0.35 ATR** | 🟢 | Near key liquidity zones |
| **Bias = UP/DOWN** | 🟢 / 🔴 | Trend-aligned environment |
| **ABS/EXH active** | 🟡 / 🟠 | Caution — possible reversal zone |
How to Use
Confirm Volume Context → RVOL > 1.2
Align with Bias → Take longs only when Bias = UP, shorts only when Bias = DOWN.
Check Slope and VWAP Dir → Ensure trending context (Slope = YES).
Confirm CVD and zΔ → Flow should agree with price direction.
Avoid ABS/EXH Triggers → These signal exhaustion or absorption by large players.
Enter Near PD Zones → Ideal trade zones are within 0.35 ATR of prior-day levels.
This multi-factor confirmation reduces noise and focuses only on high-probability institutional setups.
Originality
This script was written from scratch in Pine v6.
It does not reuse existing public indicators except for standard built-ins (ta.vwap, ta.atr, etc.).
The unique combination of delta z-scoring, VWAP slope filtering, and real-time confluence zones distinguishes it from typical orderflow tools or cumulative delta overlays.
The core innovation is its merged real-time HUD that integrates institutional metrics and natural-language feedback directly on the chart, allowing traders to read market context intuitively rather than decode multiple subplots.
Notes & Disclaimers
This indicator does not repaint.
It’s intended for educational and analytical purposes only — not as financial advice or a guaranteed signal system.
Works best on liquid instruments (Futures, Indices, FX majors).
Avoid non-standard chart types (Heikin Ashi, Renko, etc.) for accurate readings.
Open-source, modifiable, and compatible with Pine v6.
Recommended Use
Apply it with clean charts and standard candles for the best clarity.
Use alongside a basic structure or volume profile to contextualize institutional bias zones.
Author: Dhawal Ranka
Category - Orderflow / VWAP / Institutional Analysis
Version: Pine Script™ v6
License: Open Source (Educational Use)

Volume Weighted Average Price Band Extension## Volume Weighted Average Price Band Extension (VWAPb)
**Volume Weighted Average Price Band Extension** is an enhanced VWAP indicator that extends the traditional three-band system to include up to **five configurable standard deviation bands**, making it particularly well-suited for analyzing volatile market conditions where price action frequently extends beyond conventional boundaries.
### Key Features
**Extended Band System**
Unlike standard VWAP indicators that typically offer three bands, this indicator provides five independently configurable bands with customizable multipliers (default: 0.5x, 1.0x, 1.5x, 2.0x, and 3.0x). Each band can be toggled on or off, allowing traders to adapt the display to current market volatility and their specific trading strategy.
**Dual Calculation Modes**
The indicator offers flexibility in how bands are calculated:
- **Standard Deviation Mode**: Traditional statistical approach measuring price dispersion from the VWAP
- **Percentage Mode**: Distance calculated as a percentage of VWAP (1 multiplier = 1%), useful for comparing relative moves across different price levels
**Flexible Anchor Periods**
Calculate VWAP from multiple timeframes and events:
- Time-based: Session, Week, Month, Quarter, Year, Decade, Century
- Event-based: Earnings reports, Dividend announcements, Stock splits
- Customizable source (default: hlc3)
**Visual Clarity**
Color-coded bands with semi-transparent fills between upper and lower boundaries help identify key support and resistance zones at a glance. The indicator automatically hides on daily and higher timeframes when enabled, keeping charts clean.
### Ideal For
- **Volatile Markets**: The extended band system captures extreme price movements that often exceed traditional 2-3 standard deviation bounds
- **Scalping & Day Trading**: Multiple bands provide granular entry and exit zones for short-term trades
- **Mean Reversion Strategies**: Identify overextended price action relative to volume-weighted fair value
- **Institutional Order Flow Analysis**: VWAP remains a key benchmark for institutional execution
### How It Works
The Volume Weighted Average Price represents the average price weighted by volume throughout the selected anchor period. The surrounding bands act as dynamic support and resistance levels, with each successive band representing areas of increasing deviation from the volume-weighted mean. In volatile conditions, price may regularly test the outer bands (2.0x, 3.0x), which would be invisible on standard three-band implementations.
**Trading Applications:**
- Price near outer bands (±2.0x, ±3.0x) may signal exhaustion and potential reversal opportunities
- Price oscillating between inner bands (±0.5x, ±1.0x) indicates consolidation
- VWAP itself acts as a dynamic pivot point—bullish above, bearish below
### Settings Overview
- **VWAP Settings**: Anchor period selection, source input, offset capability, option to hide on D/W/M timeframes
- **Bands Settings**: Toggle each of the five bands independently, adjust multipliers, choose between Standard Deviation or Percentage calculation mode
---
**Note**: This indicator requires volume data to function properly. A runtime error will display if volume data is unavailable for the selected symbol.
**Disclaimer**: This indicator is designed for technical analysis and should be used in conjunction with other forms of analysis and proper risk management. Past performance and indicator signals do not guarantee future results.
SAP121212 — Close vs VWAP + Optional RSI (Signals)This indicator combines Supertrend, VWAP with bands, and an optional RSI filter to generate Buy/Sell signals.
How it works
Supertrend Flip (ATR-based): Detects when trend direction changes (from bearish to bullish, or bullish to bearish).
VWAP Band Filter: Signals only trigger if the candle close is beyond the VWAP bands:
Buy = Supertrend flips up AND close > VWAP Upper Band
Sell = Supertrend flips down AND close < VWAP Lower Band
Optional RSI Filter:
Buy requires RSI < 20
Sell requires RSI > 80
Can be enabled/disabled in settings.
Features
Choice of VWAP band calculation mode: Standard Deviation or ATR.
Adjustable ATR/StDev length and multiplier for VWAP bands.
Toggle Supertrend, VWAP lines, and Buy/Sell labels.
Alerts included: add alerts on BUY or SELL conditions (use Once Per Bar Close to avoid intrabar signals).
Use
Works best on intraday or higher timeframes where VWAP is relevant.
Use the RSI filter for more selective signals.
Can be combined with your own stop-loss and risk management rules.
⚠️ Disclaimer: This script is for educational and research purposes only. It is not financial advice. Always test thoroughly and trade at your own risk.
Buy/Sell Volume VWAP with Liquidity and Price SensitivityBuy/Sell Volume VWAP with Liquidity & Price Sensitivity
A dual-VWAP overlay that separates buy-side vs sell-side pressure using lower-timeframe volume and recent price behavior. It shows two adaptive VWAP lines and a bias cloud to make trend and imbalance easy to see—no params fussing required.
What you’ll see
Buy VWAP (green) and Sell VWAP (red) plotted on the chart
Slope-aware coloring : brighter when that side is improving, darker when easing
Bias cloud: green when Buy > Sell, red when Sell > Buy
Optional last-value bubbles on the price scale for quick readouts
How it works
Looks inside each bar (lower timeframe, e.g., 1-second) to estimate buy vs sell pressure
Blends that pressure with recent price movement to keep the lines responsive but stable
Maintains separate VWAP tracks for buy-side and sell-side and resets daily or at a time you choose
How to use it
Trend & bias: When Buy VWAP stays above Sell VWAP (green cloud), buyers have the upper hand; the opposite (red cloud) favors sellers.
Conviction: A wider gap between the two lines often means a stronger imbalance.
Context: Use alongside structure (higher highs/lows, key levels) for confirmation—this is not a stand-alone signal.
Inputs
Timeframe: Lower-TF sampling (default 1S).
Reset Time: Defaults to 09:30 (session open); set to your market.
Appearance: Two-shade palettes for buy/sell, line width, last-value bubbles, and cloud opacity.
Tips
Works on most symbols and intraday timeframes; lower-TF sampling can be heavier on resources.
If the cloud flips frequently, consider viewing on a slightly higher chart timeframe for cleaner structure.
Disclaimer
For educational use only. Not investment advice. Test on replay/paper before live decisions.
Advanced Market Dashboard - Compact Atr,bb,Dcng%,RSI,ADX,vwapDescription of the Advanced Market Dashboard Indicator:
This Pine Script indicator is a comprehensive technical dashboard designed for use with TradingView. The indicator displays key market metrics, price changes, and popular technical indicators directly on the chart in real-time.
Features of the Indicator
1. Price and Price Change
Current Price: Displays the current closing price of the symbol (e.g., $100.50).
Change in Price:
Value Change: Displays how much the price has changed compared to the previous period (e.g., "+$2.50").
Percentage Change: Shows the percentage difference between the previous period's close and the current price (e.g., "+2.5%").
Period Selection: Allows you to choose the time period for this change (e.g., 1 minute, daily, weekly, or monthly).
Example:
Current Price = $150.50
Change = +$1.25 (+0.83%)
2. VWAP (Volume Weighted Average Price)
VWAP represents the average price of a security weighted by volume. It’s widely used by intraday traders to gauge where the market price is relative to typical buying/selling levels.
Plot of VWAP is included on the chart for easy visualization.
3. ATR (Average True Range)
Displays ATR (21 period), an indicator commonly used for understanding price volatility.
Higher ATR values indicate higher volatility, while lower ATR values suggest lower volatility.
4. RSI (Relative Strength Index)
Displays RSI (21 period):
RSI is a popular oscillator that measures price momentum strength.
Ranges from 0 to 100:
Values above 70 indicate overbought conditions.
Values below 30 indicate oversold conditions.
Includes visual overbought/oversold lines (70 and 30) plotted directly on the chart.
5. ADX (Average Directional Index)
Displays ADX (14 period), which measures the strength of a trend:
ADX above 25: Indicates a strong trend.
ADX below 25: Indicates weak or no trend.
Includes a reference line (25) plotted on the chart to help interpret trend direction.
6. Bollinger Bands
Displays:
Upper Band: Basis + (StdDev × multiplier)
Lower Band: Basis - (StdDev × multiplier)
Middle Line: Simple Moving Average (SMA)
Bollinger Bands help identify volatility and potential buy/sell opportunities:
Price near the upper band: Indicates overbought conditions.
Price near the lower band: Indicates oversold conditions.
Plots all three bands directly on the chart for visual guidance.
Compact Table
The indicator organizes all data into a clean, compact table in the top-right corner of the chart. Each metric is displayed alongside its value:
Symbol Name and Price
Example:
Price Change
Example:
VWAP
Example:
ATR
Example:
RSI
Example:
ADX
Example:
Bollinger Upper Band
Example:
Bollinger Lower Band
Example:
Visual Plots on Chart
In addition to the table display, the following indicators are visually plotted on the chart for easy reference:
VWAP
Bollinger Bands (Upper, Lower, and Middle)
RSI Overbought/oversold levels
ADX Trend strength reference line (value = 25)
Customizable Settings
ATR Length: Default = 21.
RSI Length: Default = 21.
ADX Length: Default = 14.
Bollinger Band Parameters:
Length: Default = 20.
Standard Deviation: Default = 2.0.
Price Change Periods: Choose between:
1-minute
Daily
Weekly
Monthly.
How to Use
Add the script to your TradingView chart.
In the indicator settings, configure lengths and periods according to your preference.
Use the compact table for real-time metrics and refer to the chart plots for visual insights.
Who Should Use This Indicator?
This indicator is ideal for:
Day Traders: Use VWAP, ATR, RSI, and Bollinger Bands for intraday price action.
Trend Followers: Use ADX to confirm trending markets.
Technical Analysts: Quickly access multiple technical metrics without adding multiple indicators.
Swing Traders: Use Bollinger Bands and RSI for spotting overbought/oversold conditions.
Why This Indicator Stands Out?
Multiple Indicators in One: Eliminates the need to add separate indicators for VWAP, ATR, RSI, ADX, Bollinger Bands, and price changes.
Compact Design: Data displayed neatly in a table to reduce chart clutter.
Customizability: Users can fine-tune settings for their specific trading style.
Real-time Updates: Values are recalculated dynamically on each new bar, ensuring accuracy.
Limitations
This indicator is solely designed for informational purposes and does not provide buy/sell signals automatically.
The accuracy of Bollinger Bands, RSI, VWAP, etc., depends on the selected input parameters.
The price change feature may not work for extended periods in tick charts or non-standard timeframes.
Conclusion
This Advanced Market Dashboard is a powerful all-in-one tool for traders and analysts who require real-time market metrics. It combines essential indicators while maintaining a user-friendly interface for both novice and professional traders.

Smart MTF S/R Levels[BullByte]
Smart MTF S/R Levels
Introduction & Motivation
Support and Resistance (S/R) levels are the backbone of technical analysis. However, most traders face two major challenges:
Manual S/R Marking: Drawing S/R levels by hand is time-consuming, subjective, and often inconsistent.
Multi-Timeframe Blind Spots: Key S/R levels from higher or lower timeframes are often missed, leading to surprise reversals or missed opportunities.
Smart MTF S/R Levels was created to solve these problems. It is a fully automated, multi-timeframe, multi-method S/R detection and visualization tool, designed to give traders a complete, objective, and actionable view of the market’s most important price zones.
What Makes This Indicator Unique?
Multi-Timeframe Analysis: Simultaneously analyzes up to three user-selected timeframes, ensuring you never miss a critical S/R level from any timeframe.
Multi-Method Confluence: Integrates several respected S/R detection methods—Swings, Pivots, Fibonacci, Order Blocks, and Volume Profile—into a single, unified system.
Zone Clustering: Automatically merges nearby levels into “zones” to reduce clutter and highlight areas of true market consensus.
Confluence Scoring: Each zone is scored by the number of methods and timeframes in agreement, helping you instantly spot the most significant S/R areas.
Reaction Counting: Tracks how many times price has recently interacted with each zone, providing a real-world measure of its importance.
Customizable Dashboard: A real-time, on-chart table summarizes all key S/R zones, their origins, confluence, and proximity to price.
Smart Alerts: Get notified when price approaches high-confluence zones, so you never miss a critical trading opportunity.
Why Should a Trader Use This?
Objectivity: Removes subjectivity from S/R analysis by using algorithmic detection and clustering.
Efficiency: Saves hours of manual charting and reduces analysis fatigue.
Comprehensiveness: Ensures you are always aware of the most relevant S/R zones, regardless of your trading timeframe.
Actionability: The dashboard and alerts make it easy to act on the most important levels, improving trade timing and risk management.
Adaptability: Works for all asset classes (stocks, forex, crypto, futures) and all trading styles (scalping, swing, position).
The Gap This Indicator Fills
Most S/R indicators focus on a single method or timeframe, leading to incomplete analysis. Manual S/R marking is error-prone and inconsistent. This indicator fills the gap by:
Automating S/R detection across multiple timeframes and methods
Objectively scoring and ranking zones by confluence and reaction
Presenting all this information in a clear, actionable dashboard
How Does It Work? (Technical Logic)
1. Level Detection
For each selected timeframe, the script detects S/R levels using:
SW (Swing High/Low): Recent price pivots where reversals occurred.
Pivot: Classic floor trader pivots (P, S1, R1).
Fib (Fibonacci): Key retracement levels (0.236, 0.382, 0.5, 0.618, 0.786) over the last 50 bars.
Bull OB / Bear OB: Institutional price zones based on bullish/bearish engulfing patterns.
VWAP / POC: Volume Weighted Average Price and Point of Control over the last 50 bars.
2. Level Clustering
Levels within a user-defined % distance are merged into a single “zone.”
Each zone records which methods and timeframes contributed to it.
3. Confluence & Reaction Scoring
Confluence: The number of unique methods/timeframes in agreement for a zone.
Reactions: The number of times price has touched or reversed at the zone in the recent past (user-defined lookback).
4. Filtering & Sorting
Only zones within a user-defined % of the current price are shown (to focus on actionable areas).
Zones can be sorted by confluence, reaction count, or proximity to price.
5. Visualization
Zones: Shaded boxes on the chart (green for support, red for resistance, blue for mixed).
Lines: Mark the exact level of each zone.
Labels: Show level, methods by timeframe (e.g., 15m (3 SW), 30m (1 VWAP)), and (if applicable) Fibonacci ratios.
Dashboard Table: Lists all nearby zones with full details.
6. Alerts
Optional alerts trigger when price approaches a zone with confluence above a user-set threshold.
Inputs & Customization (Explained for All Users)
Show Timeframe 1/2/3: Enable/disable analysis for each timeframe (e.g., 15m, 30m, 1h).
Show Swings/Pivots/Fibonacci/Order Blocks/Volume Profile: Select which S/R methods to include.
Show levels within X% of price: Only display zones near the current price (default: 3%).
How many swing highs/lows to show: Number of recent swings to include (default: 3).
Cluster levels within X%: Merge levels close together into a single zone (default: 0.25%).
Show Top N Zones: Limit the number of zones displayed (default: 8).
Bars to check for reactions: How far back to count price reactions (default: 100).
Sort Zones By: Choose how to rank zones in the dashboard (Confluence, Reactions, Distance).
Alert if Confluence >=: Set the minimum confluence score for alerts (default: 3).
Zone Box Width/Line Length/Label Offset: Control the appearance of zones and labels.
Dashboard Size/Location: Customize the dashboard table.
How to Read the Output
Shaded Boxes: Represent S/R zones. The color indicates type (green = support, red = resistance, blue = mixed).
Lines: Mark the precise level of each zone.
Labels: Show the level, methods by timeframe (e.g., 15m (3 SW), 30m (1 VWAP)), and (if applicable) Fibonacci ratios.
Dashboard Table: Columns include:
Level: Price of the zone
Methods (by TF): Which S/R methods and how many, per timeframe (see abbreviation key below)
Type: Support, Resistance, or Mixed
Confl.: Confluence score (higher = more significant)
React.: Number of recent price reactions
Dist %: Distance from current price (in %)
Abbreviations Used
SW = Swing High/Low (recent price pivots where reversals occurred)
Fib = Fibonacci Level (key retracement levels such as 0.236, 0.382, 0.5, 0.618, 0.786)
VWAP = Volume Weighted Average Price (price level weighted by volume)
POC = Point of Control (price level with the highest traded volume)
Bull OB = Bullish Order Block (institutional support zone from bullish price action)
Bear OB = Bearish Order Block (institutional resistance zone from bearish price action)
Pivot = Pivot Point (classic floor trader pivots: P, S1, R1)
These abbreviations appear in the dashboard and chart labels for clarity.
Example: How to Read the Dashboard and Labels (from the chart above)
Suppose you are trading BTCUSDT on a 15-minute chart. The dashboard at the top right shows several S/R zones, each with a breakdown of which timeframes and methods contributed to their detection:
Resistance zone at 119257.11:
The dashboard shows:
5m (1 SW), 15m (2 SW), 1h (3 SW)
This means the level 119257.11 was identified as a resistance zone by one swing high (SW) on the 5-minute timeframe, two swing highs on the 15-minute timeframe, and three swing highs on the 1-hour timeframe. The confluence score is 6 (total number of method/timeframe hits), and there has been 1 recent price reaction at this level. This suggests 119257.11 is a strong resistance zone, confirmed by multiple swing highs across all selected timeframes.
Mixed zone at 118767.97:
The dashboard shows:
5m (2 SW), 15m (2 SW)
This means the level 118767.97 was identified by two swing points on both the 5-minute and 15-minute timeframes. The confluence score is 4, and there have been 19 recent price reactions at this level, indicating it is a highly reactive zone.
Support zone at 117411.35:
The dashboard shows:
5m (2 SW), 1h (2 SW)
This means the level 117411.35 was identified as a support zone by two swing lows on the 5-minute timeframe and two swing lows on the 1-hour timeframe. The confluence score is 4, and there have been 2 recent price reactions at this level.
Mixed zone at 118291.45:
The dashboard shows:
15m (1 SW, 1 VWAP), 5m (1 VWAP), 1h (1 VWAP)
This means the level 118291.45 was identified by a swing and VWAP on the 15-minute timeframe, and by VWAP on both the 5-minute and 1-hour timeframes. The confluence score is 4, and there have been 12 recent price reactions at this level.
Support zone at 117103.10:
The dashboard shows:
15m (1 SW), 1h (1 SW)
This means the level 117103.10 was identified by a single swing low on both the 15-minute and 1-hour timeframes. The confluence score is 2, and there have been no recent price reactions at this level.
Resistance zone at 117899.33:
The dashboard shows:
5m (1 SW)
This means the level 117899.33 was identified by a single swing high on the 5-minute timeframe. The confluence score is 1, and there have been no recent price reactions at this level.
How to use this:
Zones with higher confluence (more methods and timeframes in agreement) and more recent reactions are generally more significant. For example, the resistance at 119257.11 is much stronger than the resistance at 117899.33, and the mixed zone at 118767.97 has shown the most recent price reactions, making it a key area to watch for potential reversals or breakouts.
Tip:
“SW” stands for Swing High/Low, and “VWAP” stands for Volume Weighted Average Price.
The format 15m (2 SW) means two swing points were detected on the 15-minute timeframe.
Best Practices & Recommendations
Use with Other Tools: This indicator is most powerful when combined with your own price action analysis and risk management.
Adjust Settings: Experiment with timeframes, clustering, and methods to suit your trading style and the asset’s volatility.
Watch for High Confluence: Zones with higher confluence and more reactions are generally more significant.
Limitations
No Future Prediction: The indicator does not predict future price movement; it highlights areas where price is statistically more likely to react.
Not a Standalone System: Should be used as part of a broader trading plan.
Historical Data: Reaction counts are based on historical price action and may not always repeat.
Disclaimer
This indicator is a technical analysis tool and does not constitute financial advice or a recommendation to buy or sell any asset. Trading involves risk, and past performance is not indicative of future results. Always use proper risk management and consult a financial advisor if needed.

[Smith] VWAP Deviation + VWAP Deviation +
Short Description:
Advanced VWAP indicator with deviation bands, smart signal filtering, and session-based performance tracking. Features log-space scaling, RSI confirmation, volume filters, and market regime detection.
Full Description:
The VWAP Deviation + is a comprehensive trading indicator that combines Volume Weighted Average Price (VWAP) analysis with advanced signal filtering to identify high-probability trade opportunities. This indicator goes beyond basic VWAP by incorporating multiple confirmation layers and intelligent market analysis.
🎯 Key Features
Core VWAP Analysis:
- Custom volume-weighted mean calculation with deviation bands (2σ and 3σ)
- Optional log-space scaling for proportional price movements
- Real-time VWAP line with customizable visibility
Smart Signal Detection:
- RSI confirmation for all trade signals
- Volume filter requiring above-average trading activity
- Market regime detection (trending vs ranging markets)
- Optional RSI divergence analysis
Advanced Filtering:
- Multi-condition signal validation
- Session-based performance tracking (Asian, London, NY)
- Real-time win rate calculation
- Strong vs regular signal classification
Visual Features:
- Clean, professional interface with customizable colors
- Optional signal shapes and annotations
- Performance statistics table
- Filled deviation bands for easy visualization
📊 How It Works
The indicator identifies trade opportunities when:
1. Price touches VWAP deviation bands (2σ or 3σ)
2. RSI confirms oversold/overbought conditions
3. Volume exceeds the specified threshold
4. Market regime conditions are favorable
Signal Types:
- LONG : Price at lower bands + RSI oversold + volume confirmation
- SHORT : Price at upper bands + RSI overbought + volume confirmation
- STRONG : Same conditions but at 3σ bands for higher conviction trades
⚙️ Customization Options
Core Settings:
- VWAP length and source selection
- Adjustable deviation multipliers
- Log-space scaling toggle
Signal Filters:
- RSI length and threshold levels
- Volume filter with customizable multiplier
- Market type filtering options
Advanced Features:
- Session statistics tracking
- RSI divergence detection
- Market regime analysis
Visual Controls:
- Show/hide individual components
- Custom color schemes
- Signal display toggles
🔔 Alert System
Built-in alerts for:
- Long and short trade opportunities
- Strong signal confirmations
- RSI divergence signals
💡 Best Practices
- Use higher timeframes (15m+) for more reliable signals
- Combine with additional confirmation indicators
- Pay attention to session statistics for timing optimization
- Monitor market regime indicators for context
This indicator is suitable for day traders, swing traders, and anyone looking to improve their VWAP-based trading strategies with advanced filtering and market analysis.

RSI VWAP POC [Uncle Sam Trading]Category: Oscillators, Volume, Market Profile
Timeframe: Suitable for all timeframes
Markets: Crypto, Forex, Stocks, Commodities
Overview
The RSI VWAP POC indicator is a powerful and innovative oscillator that combines the Relative Strength Index (RSI), Volume-Weighted Average Price (VWAP), and Point of Control (POC) from market profile analysis. Designed to provide traders with clear, high-probability trading signals, this indicator helps you identify key market levels, spot overbought/oversold conditions, and time your entries and exits with precision. Whether you’re a day trader, swing trader, or scalper, this free tool adds significant value to your trading strategy by offering a unique blend of momentum, volume, and market profile insights.
How It Works
This indicator integrates three core components to deliver actionable insights:
RSI (Relative Strength Index): Measures momentum to identify overbought (above 70) and oversold (below 30) conditions, helping you anticipate potential reversals.
VWAP (Volume-Weighted Average Price): Calculates a volume-weighted price benchmark, which is used to compute a more accurate, volume-sensitive RSI. This ensures the indicator reflects true market dynamics.
POC (Point of Control): Derived from market profile analysis, the POC represents the price level with the highest traded volume in a session, acting as a critical support or resistance level.
The indicator plots a smoothed RSI based on VWAP, overlaid with market profile data on a user-defined higher timeframe (default: 4H). The POC is displayed as a red line, with aqua bars indicating the value area where the majority of trading volume occurred. When the RSI crosses the POC, the indicator generates clear buy and sell signals:
Strong Buy (SBU): RSI crosses above the POC in an oversold zone.
Strong Sell (SBD): RSI crosses below the POC in an overbought zone.
Additional features include:
Background colors to highlight bullish (green) or bearish (red) trends.
Shaded zones for overbought (70/60) and oversold (30/40) levels.
Customizable settings to fit your trading style and timeframe.
How This Indicator Adds Value
The RSI VWAP POC indicator offers several key benefits that enhance your trading performance:
High-Probability Signals: By combining RSI, VWAP, and POC, this indicator identifies trades at key market levels where price is likely to react, increasing your win rate.
Improved Timing: Clear buy and sell signals, such as ‘SBU’ and ‘SBD’, help you enter and exit trades at optimal points, maximizing profitability.
Risk Management: Overbought/oversold zones and trend confirmation via background colors help you avoid false signals, protecting your capital.
Versatility: Suitable for all markets (crypto, forex, stocks) and timeframes, making it a valuable tool for traders of all experience levels.
Time Efficiency: The indicator does the heavy lifting by analyzing momentum, volume, and market profile data, allowing you to focus on executing trades.
Real-World Performance Example: On a 1-hour Bitcoin chart with a 4-hour higher timeframe, this indicator identified a strong sell signal on April 6th at 12:00 ($82,000), leading to a 9% drop to $74,600. A subsequent strong buy signal on April 7th at 04:00 ($76,200) captured a 6% rise to $81,200 – a potential 25% profit with 5x leverage if exited at 5%.
How to Use
Add the Indicator: Search for “RSI VWAP POC ” in TradingView’s indicator library and add it to your chart.
Set Your Timeframe: The indicator works on any timeframe but is optimized for a 1-hour chart with a 4-hour higher timeframe (set in the settings).
Interpret Signals:
Look for ‘SBU’ (strong buy) labels when the RSI crosses above the POC in an oversold zone, indicating a potential buying opportunity.
Look for ‘SBD’ (strong sell) labels when the RSI crosses below the POC in an overbought zone, signaling a potential selling opportunity.
Use the background colors (green for bullish, red for bearish) to confirm the trend.
Combine with Your Strategy: Use the indicator alongside your existing analysis (e.g., support/resistance, candlestick patterns) for best results.
Settings and Customization
The indicator is highly customizable to suit your trading needs:
RSI Length (Default: 14): Adjust the sensitivity of the RSI. Use a shorter length (e.g., 10) for scalping, or a longer length (e.g., 20) for smoother signals.
EMA Smoothing Length (Default: 3): Smooths the RSI line. Increase to 5 or 7 for less choppy signals in volatile markets.
Higher Timeframe (Default: 240 minutes): Set to 240 (4 hours) for a 1-hour chart. Adjust based on your chart’s timeframe (e.g., 60 minutes for a 15-minute chart).
Value Area Percentage (Default: 100%): Defines the size of the value area around the POC. Lower to 70% for a tighter focus on key levels.
Overbought/Oversold Thresholds (Defaults: 70/30): Adjust these levels to match market conditions (e.g., 80/20 for trending markets).
Show POC Line (Default: True): Toggle the red POC line on or off.
Show Buy/Sell Signals: Enable ‘Show Strong Breakup Signals’ and ‘Show Strong Breakdown Signals’ to focus on high-probability trades.
Why Choose This Indicator?
The RSI VWAP POC indicator stands out by offering a unique combination of momentum, volume, and market profile analysis in a single, easy-to-use tool. It’s designed to help traders of all levels make informed decisions, reduce risk, and increase profitability. Whether you’re trading Bitcoin, forex pairs, or stocks, this indicator provides the clarity and precision you need to succeed.

TWAP & VWAP CombinedThis script integrates Time Weighted Average Price (TWAP) and Volume Weighted Average Price (VWAP) into a single TradingView indicator, allowing traders to analyze both price-weighted and volume-weighted trends simultaneously.
Features:
TWAP Calculation:
Computes the average price over a specified anchor period (e.g., daily).
Resets and recalculates TWAP when the anchor period changes.
Uses the OHLC4 (Open, High, Low, Close average) as the default price source.
VWAP Calculation:
Computes the VWAP based on the selected anchor period (Session, Week, Month, etc.).
Allows the option to hide VWAP when the timeframe is 1D or higher.
Uses HLC3 (High, Low, Close average) as the default source.
Dynamically resets VWAP at the start of a new period.
Customization Options:
Users can modify the source price for TWAP and VWAP calculations.
Adjustable offsets for both indicators to shift plots forward or backward.
Ability to select different VWAP anchor periods, including earnings, dividends, and splits.
Error Handling:
Displays an error message if volume data is missing, ensuring VWAP functions correctly.
Salman Indicator: Multi-Purpose Price ActionSalman Indicator: Multi-Purpose Price Action Tool for Pin Bars, Breakouts, and VWAP Anchoring
This indicator provides a comprehensive suite of price action insights, designed for active traders looking to identify key market structures and potential reversals. The script incorporates a Quarterly VWAP for trend bias, marks pin bars for possible reversal points, highlights outside bars for volatility signals, and indicates simple breakouts and pivot-level breaks. Customizable settings allow for flexibility in various trading styles, with default settings optimized for daily charts.
Outside Bars : Represented by an ⤬ symbol on the chart, these indicate bars where the current high is greater than the previous bar’s high, and the low is lower than the previous bar’s low, signaling high volatility and potential market reversals.
Pin Bars : Denoted by a small dot at the top or bottom of a candle’s wick, these are crucial signals of potential reversal areas. Pin bars are identified based on the percentage length of their shadows, with adjustable strictness in settings.
Quarterly VWAP : The light blue line on the chart represents the VWAP (Volume-Weighted Average Price), which is anchored to the Quarterly period by default. The VWAP acts as a directional bias filter, helping you to determine underlying market trends. This period, source, and offset are fully adjustable in the script’s settings.
Simple Breaks : Hollow candles on the chart indicate "simple breaks," defined when the current bar closes above the previous high or below the previous low. This is an effective way to highlight directional momentum in the market.
Bonus Pivot Breaks : The tilde symbol ~ appears when the price closes above or below prior pivot high/low levels, helping traders spot significant breakout or breakdown points relative to recent pivots.
Alerts
Simple Breaks : Alerts you when a breakout occurs beyond the previous bar’s high or low. Pin Bars : Notifies you of potential reversal points as indicated by bullish or bearish pin bars. Outside Bars : Triggers an alert whenever an outside bar is detected, indicating possible volatility changes.
How to Use
VWAP for Trend Bias : Use the Quarterly VWAP line to gauge overall market trend, with settings that allow adjustment to daily, weekly, monthly, or even larger time frames.
Pin Bars for Reversal Potential : Look for the dot markers on candle wicks, where the strictness of the pin bar detection can be adjusted via settings to match your trading preference.
Simple and Pivot Breaks for Momentum : Watch for hollow candles and the tilde symbol ~ as indicators of potential breakout momentum and pivot break levels, respectively.
This script can serve traders on multiple timeframes, from daily to weekly and beyond. The flexible configuration allows for adjustments in VWAP anchoring and pin bar criteria, providing a tailored fit for individual trading strategies.

Expanding Volume Range with Anchored VWAPExpanding Volume Range with Anchored VWAP Indicator Summary
This Pine Script indicator is designed for intraday trading, particularly for timeframes of 60 minutes or less. It combines several technical analysis concepts to provide traders with a comprehensive view of price action, volume, and potential support/resistance levels.
## Key Features
1. **Anchored VWAP (Volume Weighted Average Price)**
- Calculates and displays an Anchored VWAP line
- Resets at the start of each new day or when a new highest volume bar is detected
2. **Expanding Volume Range (EVR)**
- Identifies and highlights high volume bars
- Creates a box around the price range of the last three high volume bars
- Generates additional support/resistance lines based on this range
3. **Custom Multiplier Calculations**
- Allows users to customize the calculation of support/resistance levels
- Includes options for separate top and bottom multipliers
- Provides an exponential adjustment for fine-tuning
4. **Volume-Based Candle Coloring**
- Colors candles differently based on their volume relative to recent history
- Highlights the first candle of each session in a distinct color
5. **VWAP-Based Line and Fill Colors**
- Changes colors of lines and fills based on price position relative to VWAP
6. **Alert Generation**
- Creates alerts when price breaks above or below the EVR high and low levels
## User Inputs
The indicator offers several customizable inputs grouped into categories:
1. **Volume Colors**
- Customize colors for various elements (lines, fills, candles) based on volume and VWAP relationship
2. **Target Levels**
- Set multipliers for calculating target levels
3. **Multiplier Calculations**
- Enable/disable custom multiplier calculations
- Set base multipliers and exponents for top and bottom levels
## Functionality Breakdown
1. The indicator tracks the highest volume bars for the current and previous day.
2. It creates an Expanding Volume Range (EVR) based on the last three high volume bars.
3. Using the EVR, it calculates and draws support and resistance levels.
4. The levels can be calculated using either simple multipliers or a more complex exponential formula, depending on user preference.
5. Candles are colored based on their volume and whether they're the first candle of a session.
6. An Anchored VWAP is calculated and displayed, resetting at the start of each day or on new highest volume bars.
7. Alerts are generated when price moves beyond the EVR high or low levels.
## Use Cases
This indicator can be particularly useful for:
- Identifying potential support and resistance levels based on high volume price action
- Spotting changes in volume patterns throughout the trading session
- Recognizing price action relative to the Anchored VWAP
- Setting up potential entry and exit points based on the expanding volume range
Traders should use this indicator in conjunction with other forms of analysis and risk management strategies for best results.

TradeTale Targets & SLIts a Leading Indicator. This script explains how 'Pivot Points' along with 'Fibonacci' & 'VWAP' can be used to catch a trend.
Volume Weighted Average Price (VWAP):-
VWAP stands for Volume-Weighted Average Price, which is a tool that shows the average price of a security over a period of time, adjusted for trading volume.
VWAP = (Cumulative (Price * Volume) ÷ (Cumulative Volume)
Pivot Points:-
A pivot point is a price level calculated from previous prices. Pivot point is simply the average of the previous days high and low and the closing price which shows potential areas of support or resistance. Trading above the pivot point on the subsequent day is thought to indicate ongoing bullish sentiment and Trading below the pivot point indicates bearish sentiment. It lets the trader know that the price is trending in that direction if the price moves through these levels. Day traders calculate pivot points to determine levels of entry, stoploss and take profits.
Fibonacci:-
Fibonacci is based on the key numbers identified by mathematician Leonardo Pisano, nicknamed Fibonacci, in the 13th century. Fibonacci's sequence of numbers is not as important as the mathematical relationships, expressed as ratios, between the numbers in the series. A Fibonacci retracement is created by taking two extreme points on a stock chart and dividing the vertical distance by the key Fibonacci ratios of 23.6%, 38.2%, 50%, 61.8% etc. Once these levels are identified, horizontal lines are drawn and used to identify possible support and resistance levels, place stoploss and set targets.
Logic of this indicator:-
Pivot Points are used as Entry level and Stoploss.
Fibonacci Ratios are used as Targets.
VWAP can be used to see the Trend. (Price above VWAP is Bullish Trend & Price below VWAP is Bearish Trend)
How to use:-
Long when price is above "VWAP".
Short when price is below "VWAP".
Long & Short Levels along with Targets & Stoploss appears as horizontal lines.
Chart Timeframe:-
This Indicator works on all timeframes below "1 day" timeframe.
Traders can also set stop loss and take profit levels as per risk reward ratio.
Note:-
Like other technical indicators, This indicator also is not a holy grail. It can only assist you in building a good strategy. You can only succeed with proper position sizing, risk management and following correct trading Psychology (No overtrade, No greed, No revenge trade etc).
THIS INDICATOR IS FOR EDUCATIONAL PURPOSE AND PAPER TRADING ONLY. YOU MAY PAPER TRADE TO GAIN CONFIDENCE AND BUILD FURTHER ON THESE. PLEASE CONSULT YOUR FINANCIAL ADVISOR BEFORE INVESTING. WE ARE NOT SEBI REGISTERED.
Hope you all like it
happy learning.
