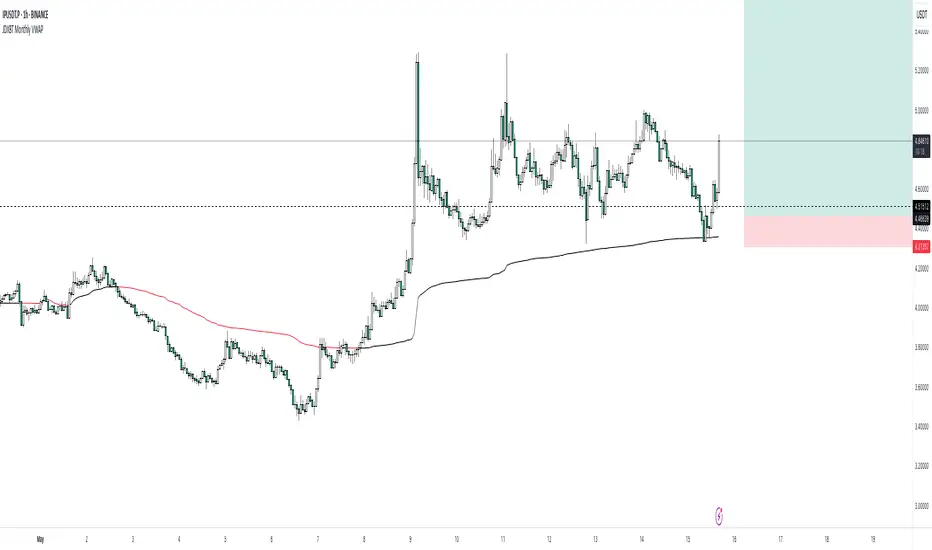
"VWAP" için komut dosyalarını ara
Multi Indicators v1 - 20 50 200 EMA/SMA, Bollinger Bands, VWAPMulti Indicators v1
20 50 200 EMA/SMA, Bollinger Bands, VWAP
These can be turned on and off
I'll be adding to this multi indicator in future updates
Dieyson daytrade EMA 9+20+200+VWAP and bar & line colorDieyson daytrade EMA 9 + EMA20 + EMA 200 + VWAP
Multiple Time Frame Volume-Weighted Average Price (VWAP)Volume-Weighted Average Price (VWAP) with the ability to choose the time frame.
POC bands 2.0 and other assorted goodiesI updated my old indicator that plotted a Kalman filter avg. of the bars inside a higher timeframe bar, to attempt to find the most frequent price in that bar's timespan.
It ended up being somewhat close, but not exact, but the result is that you get a pseudo-vwap without a need for volume data, that isn't cumulative and can indicate trend direction, or if the market's ranging.
This is very powerful information!
I highlight a trade setup we get here, derived from observing the indicator's slope and knowing how to read price action, assisted by rgmov and cci readings.
To get the code for the other indicator's you will have to click on share, and then on 'Make it mine' so you get the whole layout.
Good luck and hope you find these of use.
Cheers,
Ivan.
AVWAP CurvesThis indicator calculates and displays Anchored Volume-Weighted Average Price (AVWAP) for the 15-minute, 1-hour, and 4-hour timeframes. It helps identify volume-weighted support/resistance levels and trends based on volume and price data.
Multiple Timeframes: Displays AVWAP curves for 15m, 1h, and 4h. Users can toggle visibility for each timeframe.
Price Anchor Selection: Choose between Low, High, or HL2 as the price anchor for the AVWAP calculation.
Custom Date & Time Anchor: Set a specific start time for the AVWAP calculation.
Alerts: Alerts are triggered when the price crosses above or below any AVWAP curve.
MACZVWAP modifiedThis is lazy bear script . I just modify little so we can produce better signals
buy is cross above -80 ..
sell is cross down bellow 80
MES ORB Fakeout Alert - No RSIVWAP Integration: In 2025/2026 trading, price action often "reverses" to the VWAP. If the MES breaks the ORB High but stays below the VWAP, it’s a high-probability fakeout. This script catches that.
Relative Volume (Effort vs. Result): Instead of RSI, it looks at the Volume SMA. If the market tries to break a level with less volume than the 20-candle average, the "effort" isn't there, and the "result" (the breakout) is likely a lie.
Automatic Session Handling: It specifically looks at America/New_York time to ensure the 9:30 AM open is captured correctly regardless of where you are located.
CIRRUS strategyVWAP EMA CROSS VOLUME STRATEGY WITH TIME FILTER
with this indicator you will be able to use a free strategy using selected volume , emas and vwaps using the timeframe filter too
VWAP Diario + VWAP 08:00-12:00 (sin fantasmas, toggles) muestra el volumen. De la sesion nueva york y del dia
VWAP x EMA9 Crossover (FLIP BUY/SELL)Another simple script, please use as needed and provide any feedback back or recommendations
VWAP Suite this is vwpa suit updatedthis is vwpa suit updatedthis is vwpa suit updatedthis is vwpa suit updatedthis is vwpa suit updatedthis is vwpa suit updatedthis is vwpa suit updatedthis is vwpa suit updatedthis is vwpa suit updatedthis is vwpa suit updatedthis is vwpa suit updatedthis is vwpa suit updatedthis is vwpa suit updatedthis is vwpa suit updatedthis is vwpa suit updatedthis is vwpa suit updated
VWAP Mean Reversion (RSI + Deviation + ATR Risk)33this is an indicator that relies on other indicators. it relies on volume price action fvgs.OBS. and standard deviations.
VWAP Mean Reversion v2 nice indicator based on volume and price action. it pays attention to RSI ema.VWAP. and many more indicators
Volume x Close in CroresThis indicator provides a clear visualization of the monetary volume activity for each candle by calculating the product of trading volume and closing price and converting it into crores for easier readability.
AVWAP from day's highThis indicator will automatically plot AVWAP from day's high candle.
formual will be HL/2 and H
VWAP Combo: Bands + MACD + Volume + AlertsBands: These are dynamic bands using a 20-period standard deviation and 1.5× width by default. Adjust lookback or bandMultiplier to tighten or widen.
Candle Colors: Green = MACD bullish, Red = bearish.
Volume Spike: Orange triangle when volume > 1.5× average.
Alerts: Fire on breakout, bounce, or combo confirmation.


