Matrix Series and Vix Fix with VWAP CCI and QQE SignalsMatrix Series and Vix Fix with VWAP CCI and QQE Signals
Short Title: Advanced Matrix
Purpose
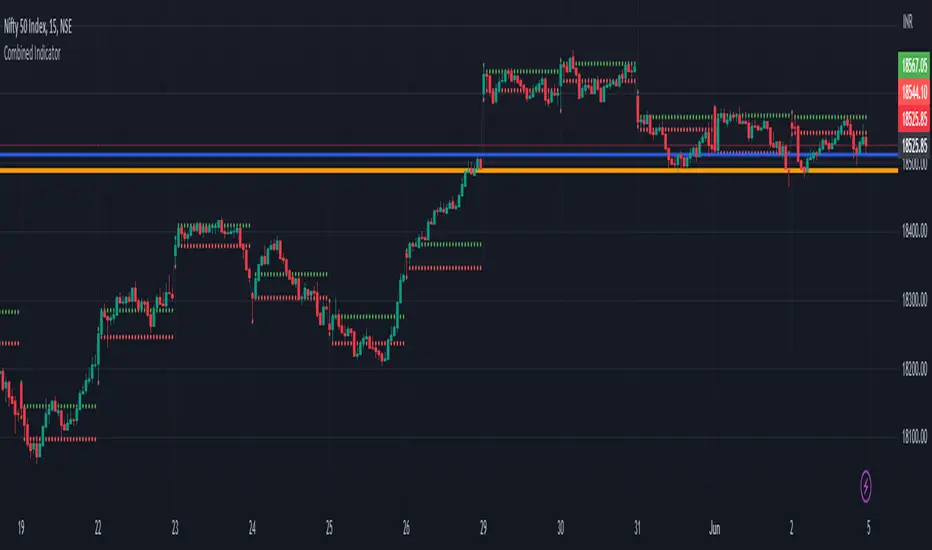
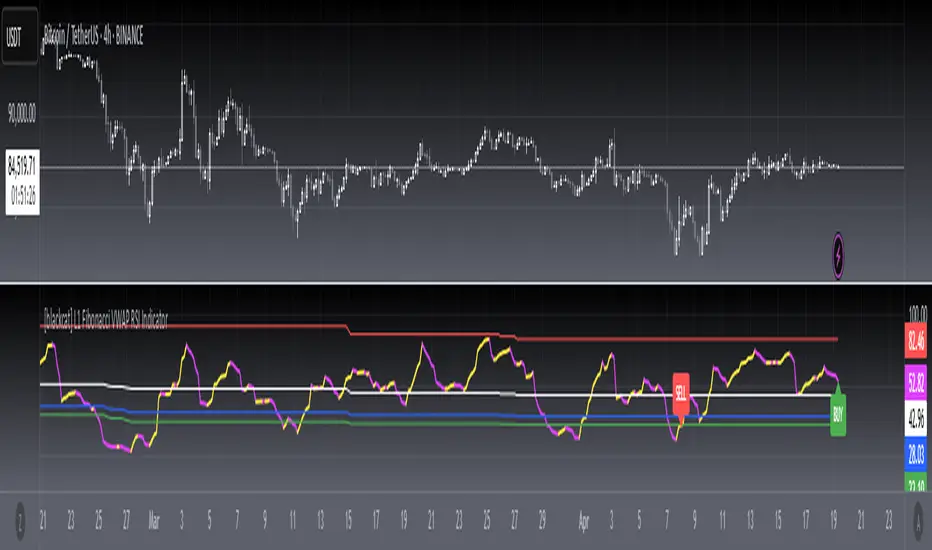
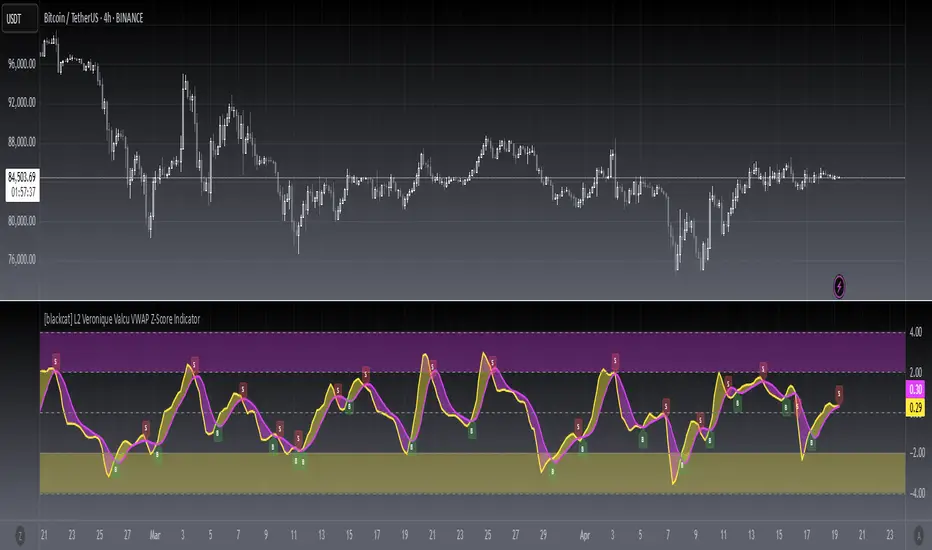
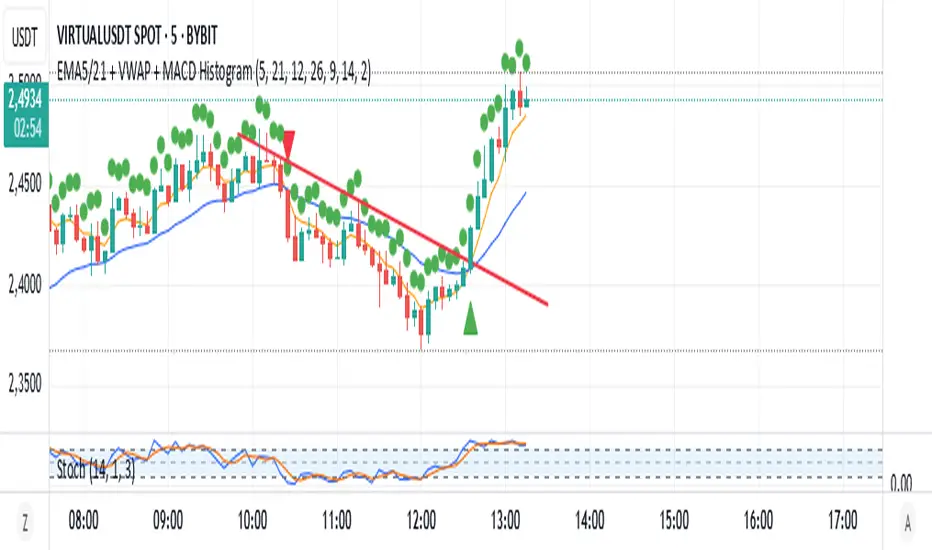
This Pine Script combines multiple technical analysis tools to create a comprehensive trading indicator. It incorporates elements like support/resistance zones, overbought/oversold conditions, Williams Vix Fix, QQE (Quantitative Qualitative Estimation) signals, VWAP CCI signals, and a 200-period SMA for trend filtering. The goal is to provide actionable buy and sell signals with enhanced visualization.
Key Features and Components
1. Matrix Series
Smoothing Input: Allows customization of EMA smoothing for the indicator (default: 5).
Support/Resistance Zones: Based on CCI (Commodity Channel Index) values.
Dynamic zones calculated with customizable parameters (SupResPeriod, SupResPercentage, PricePeriod).
Candlestick Visualization: Custom candlestick plots with colors indicating trends.
Dynamic levels for overbought/oversold conditions.
2. Overbought/Oversold Signals
Overbought and oversold levels are adjustable (ob and os).
Plots circles on the chart to highlight extreme conditions.
3. Williams Vix Fix
Identifies potential reversal points by analyzing volatility.
Uses Bollinger Bands and percentile thresholds to detect high-probability entries.
Includes two alert levels (alert1 and alert2) with customizable criteria for signal filtering.
4. QQE Signals
Based on the smoothed RSI and QQE methodology.
Detects trend changes using adaptive ATR bands (FastAtrRsiTL).
Plots long and short signals when specific conditions are met.
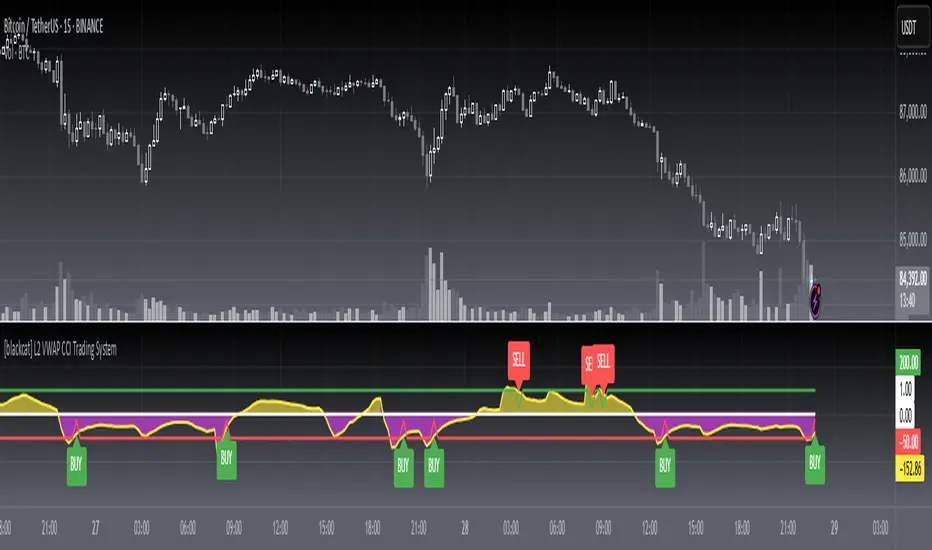
5. VWAP CCI Signals
Combines VWAP and CCI for additional trade signals.
Detects crossovers and crossunders of CCI levels (-200 and 200) to generate long and short signals.
6. 200 SMA
A 200-period simple moving average is plotted to act as a trend filter.
The script rules recommend buying only when the price is above the SMA200.
Customizable Inputs
General:
Smoothing, support/resistance periods, overbought/oversold levels.
Williams Vix Fix:
Lookback periods, Bollinger Band settings, percentile thresholds.
QQE:
RSI length, smoothing factor, QQE factor, and threshold values.
VWAP CCI:
Length for calculating deviations.
Visual Elements
Dynamic candlestick colors to indicate trend direction.
Overbought/oversold circles for extreme price levels.
Resistance and support lines.
Labels and shapes for buy/sell signals from Vix Fix, QQE, and VWAP CCI.
Alerts
Alerts are configured for the Matrix Series (e.g., "BUY MATRIX") and other components, ensuring traders are notified when significant conditions are met.
Intended Use
This indicator is designed for traders seeking a multi-faceted tool to analyze market trends, identify potential reversal points, and generate actionable trading signals. It combines traditional indicators with advanced techniques for comprehensive market analysis.
Pine Script® göstergesi