Ultimate Institutional Order Flow Pro [Pointalgo]Ultimate Institutional Order Flow (UIOF Pro)
Ultimate Institutional Order Flow (UIOF Pro) is a multi-component market analysis indicator designed to study order flow behavior, liquidity interaction, volatility structure, and session-based participation.
It integrates several commonly used market structure and order-flow concepts into a single visual framework.
This script focuses on context and alignment, not on isolated signals.
Core Objective
The indicator aims to identify areas where price, volume, liquidity, and structure appear aligned in the same direction.
It does this by combining:
VWAP behavior
Volume participation
Cumulative delta analysis
Liquidity pool interaction
Order blocks and fair value gaps
Market structure shifts
Session and higher-timeframe confirmation
VWAP & Volatility Framework
Calculates VWAP using session, weekly, or monthly anchors.
Optional VWAP standard-deviation bands visualize price dispersion.
VWAP slope and price position are used to classify directional bias.
VWAP is treated as a dynamic equilibrium reference rather than a signal.
Cumulative Volume Delta (CVD)
Estimates buy and sell pressure based on intrabar price movement.
Tracks cumulative delta and a smoothed delta average.
Uses delta change normalization to highlight abnormal activity.
Detects potential delta divergences when price and participation differ.
CVD is used to assess whether participation supports or contradicts price movement.
Liquidity Zones & Sweeps
Identifies recent swing highs and lows as potential liquidity pools.
Tracks buy-side and sell-side liquidity areas.
Flags conditions where price sweeps liquidity beyond recent extremes.
Liquidity interaction is treated as context, not prediction.
Order Blocks
1. Detects potential bullish and bearish order blocks using:
Candle structure
Volatility thresholds
Volume confirmation
2.Highlights areas where strong participation followed opposing price movement.
Order blocks are visual reference zones and do not imply guaranteed reactions.
Fair Value Gaps (FVG)
Identifies imbalance zones where price moves without overlapping structure.
Filters gaps using ATR-based size conditions.
Visual shading is used to highlight imbalance areas.
These zones may represent inefficient price movement requiring further interaction.
Volume Profile & Point of Control (POC)
Builds a simplified volume profile over a configurable lookback window.
Determines the price level with the highest traded volume (POC).
POC is used as a reference for acceptance or rejection behavior.
Market Structure
Evaluates recent highs and lows to identify structure breaks.
Classifies directional structure as bullish, bearish, or neutral.
Structure is used as a directional filter rather than a trigger.
Multi-Timeframe Confirmation
Optional higher-timeframe confirmation aligns lower-timeframe behavior with broader context.
Prevents analysis from relying on isolated timeframe conditions.
Session Filtering
1. Allows analysis to be limited to specific trading sessions.
2. Helps reduce signals during low-participation periods.
3. Session logic affects signal eligibility, not calculations.
Signal Logic
Signals are generated only when multiple independent conditions align, including:
Liquidity interaction
Order block presence
VWAP bias
Delta confirmation
Structure alignment
Volume participation
Optional higher-timeframe confirmation
Active trading session
Strong continuation conditions are also highlighted when price, volume, and participation remain aligned.
Signals represent confluence states, not trade instructions.
Dashboard Summary
A real-time dashboard summarizes:
VWAP bias and slope
CVD strength and direction
Delta behavior
Market structure state
Higher-timeframe context
Volume conditions
Liquidity pool counts
Session activity
This provides a high-level snapshot of market conditions without manual calculation.
Alerts are available for:
Institutional alignment conditions
Strong continuation pressure
Liquidity sweeps
Delta divergences
Alerts are informational and reflect internal indicator states only.
Usage Notes
Designed for analytical interpretation and market study.
Best used alongside price action and risk management methods.
Performance depends on instrument liquidity and volume quality.
All visual elements can be individually enabled or disabled.
Disclaimer
This script is provided for educational and analytical purposes only.
It does not provide financial, investment, or trading advice.
All outputs should be independently verified before making trading decisions.
"VWAP" için komut dosyalarını ara

Ichimoku + VWAP + OBV + ATR Full System (NQ Daytrade)Extended Indicator Description
Ichimoku + VWAP + OBV + ATR Full System is a rule-based intraday trading indicator designed specifically for NQ day trading, focusing on trend alignment, participation confirmation, and volatility-aware execution.
This indicator does not rely on a single signal or crossover. Instead, it integrates multiple market dimensions into one structured framework to help traders identify high-probability trend continuation scenarios while avoiding low-quality, range-bound conditions.
System Philosophy
The core idea of this system is simple:
trade only when trend, price location, volume, and volatility are aligned.
Each component plays a specific role and is not meant to be used in isolation. The indicator works best when all conditions reinforce the same directional bias.
Component Breakdown
Ichimoku Cloud
Used to define the primary market structure and directional bias. The system favors trades only when price action aligns clearly above or below the cloud, helping filter out indecisive or transitional phases.
VWAP
Acts as a session-based equilibrium reference. Price position and distance relative to VWAP are used to confirm whether the market is trending with intent rather than reverting to the mean.
OBV (On-Balance Volume)
Provides participation and flow confirmation. OBV helps validate whether price movement is supported by volume, reducing the likelihood of false breakouts or weak trend signals.
ATR (Average True Range)
Used as a volatility filter and risk-awareness tool. ATR conditions help the system avoid low-volatility environments and support more realistic expectations for intraday movement.
Trade Logic Overview
The system is designed around trend-following pullbacks, not prediction or counter-trend trading.
When trend structure is established and confirmed by VWAP positioning and OBV behavior, pullback zones within the trend become areas of interest. ATR conditions ensure that trades are taken only when sufficient movement potential exists.
Rather than generating frequent signals, the system prioritizes selectivity and clarity, making it suitable for disciplined day traders who value context over quantity.
Intended Use
This indicator is built for:
NQ intraday and day trading
Trend continuation and pullback strategies
Traders who prefer structured, confirmation-based systems
Lower to mid intraday timeframes such as 3-minute, 5-minute, and 15-minute charts
Important Notes
This is not an automated trading system and does not provide guaranteed results. The indicator is designed as a decision-support tool to assist with market context, directional bias, and trade timing. Risk management, execution, and position sizing remain the responsibility of the user.
롱/숏 삼각형 시그널
동그라미 청산 시그널
VWAP 밴드 기반 방향성
OBV 보조지표
이름 (Name)
BTC Scalping Signal – VWAP + OBV
짧은 설명 (Short Description)
VWAP 밴드와 OBV를 기반으로 방향성, 진입·청산 시그널을 제공하는 스캘핑 지표입니다.
긴 설명 (Long Description)
이 지표는 BTC 단기 스캘핑을 위해 설계된 것으로, 특히 15분봉 환경에 최적화되어 있습니다.
VWAP 밴드의 위치와 추세 판별 로직을 기반으로 롱·숏 진입 신호를 제공합니다.
OBV 모멘텀을 보조 필터로 사용하여 돌파 및 되돌림 가능성을 판단합니다.
시장 변동성이 축소되거나 평균회귀 신호가 감지될 때 청산 시그널을 표시합니다.
삼각형(진입), 원형(청산) 등 직관적 시각 요소를 통해 빠른 의사결정을 지원합니다.

Crypto Anchored VWAP (Swing High/Low)Crypto Anchored VWAP (Swing High/Low)
This indicator provides an automatic Anchored VWAP system designed specifically for highly volatile assets such as cryptocurrencies (ETH, BTC, SOL, etc.).
Unlike traditional AVWAP tools that require manual date input, this script automatically anchors VWAP to the most recent swing high and swing low, making it ideal for real-time trend tracking and intraday/4H structure analysis.
How It Works
The script detects local swing lows and swing highs based on user-defined swing length.
When a new swing point appears, an Anchored VWAP is initialized from that specific candle.
As price evolves, the AVWAP dynamically becomes:
A trend boundary
A fair-value line
A mean-reversion attractor
Traders can use these levels to identify:
Trend continuation
Breakout confirmation
Mean reversion pullbacks
Overextended expansions
Included Features
✔ Auto-Anchored VWAP from swing low
✔ Auto-Anchored VWAP from swing high
✔ Standard deviation bands (1σ) for volatility context
✔ Designed for Crypto 4H / 1H / 15m
✔ Works on any asset & any timeframe
How To Use
1. Trend Direction
Price above Swing-Low VWAP → Bullish bias
Price below Swing-High VWAP → Bearish bias
2. Trade Setups
Break → Retest → Hold above AVWAP = Trend continuation long
Reject from AVWAP / σ band = Mean-reversion short setup
AVWAP zone → High probability liquidity reaction
3. Volatility Bands
Price touching +1σ = extension
Price returning to 0σ = mean reversion
Price breaking −1σ = trend weakening
Inputs
Swing Length: determines sensitivity of swing high/low detection
(Default: 5)
Best Use Cases
ETH 4H trend following
BTC structure shifts
Altcoin volatility filtering
Identifying institutional "cost basis" zones
Confirming breakouts / fakeouts
Notes
This is not a trading system by itself but a structural tool meant to help traders understand trend and value location. Always combine AVWAP with market structure, volume, and risk management.
Disclaimer
This script is for educational and informational purposes only. It does not constitute financial advice or a recommendation to buy or sell any asset. Use at your own discretion.

Victoria Overlay - HTF 200 + VWAP + ATR Stop + MA TrioConsolidated road to minions
Buy Setup:
EMA1 crosses above SMA3.
RSI confirms above 50.
Volume increasing (confirming momentum).
Candle closes above SMA1 base.
Sell Setup:
EMA1 crosses below SMA3.
RSI drops below 50 or exits overbought.
Volume confirms (declining or reversing).
Candle closes below SMA1 base.
Tips:
Think of EMA1 as the scalper’s trigger.
SMA3 is your momentum check.
SMA1 (base) = short-term bias.
Avoid entries during low-volume chop.
Use for day trades or tight scalps; exits happen fast.
Overlay (Smoothed Heikin Ashi + Swing + VWAP + ATR Stop + 200-SMA)
Purpose: Multi-layer trend confirmation + clean structure.
Type: Swing alignment tool.
🟩 BUY / CALL Conditions
Green “Buy (Gated)” arrow appears.
Price is above VWAP, above 200-SMA, and above ATR stop.
ATR stop (green line) sits under price → support confirmed.
Heikin-Ashi candles are green/lime.
Bias label says “Above VWAP | Above 200 | Swing Up”.
🟥 SELL / PUT Conditions
Red “Sell (Gated)” arrow appears.
Price is below VWAP, below 200-SMA, and below ATR stop.
ATR stop (red line) sits above price → resistance confirmed.
Heikin-Ashi candles are red.
Bias label says “Below VWAP | Below 200 | Swing Down”.
Exit / Risk Control:
Close position when price crosses ATR stop.
If Heikin candles flip color, momentum is reversing.
Best Use Cases:
For next-day or multi-hour swing entries.
Use ATR Stop for dynamic stop loss.
Stay out when the bias label is mixed (e.g. “Above VWAP | Below 200 | Swing Down”).
Pro Tip:
On big news days, let VWAP reset post-open before acting on arrows — filters fake signals.
RSI Panel Pro (v6)
Purpose: Strength + exhaustion confirmation.
Type: Momentum filter.
Key Levels:
Overbought: 80+ → take profits soon.
Oversold: 20– → watch for bounce setups.
Bull regime: RSI above 60 = momentum strong.
Bear regime: RSI below 40 = weakness.
Buy / Entry Signals:
RSI crosses up from below 40 or 20.
RSI line is above RSI-EMA (gray line).
Higher timeframe RSI (if used) is also rising.
Trim / Exit:
RSI drops under 60 after being strong.
RSI crosses below its EMA.
Sell / Put Setup:
RSI fails at 60 or drops below 40.
RSI crosses under EMA after a bounce.
Tips:
Pair RSI panel with Victoria Overlay — only take gated buys when RSI confirms.
RSI < 40 but above 20 = “loading zone” for reversals.
RSI > 70 = overextended → wait for confirmation before entering.
Combined Execution Rules
Goal What to Watch Action
Entry (CALL) EMA1 > SMA3, Buy (Gated) arrow, RSI rising > 50 Buy call / open long
Entry (PUT) EMA1 < SMA3, Sell (Gated) arrow, RSI < 50 Buy put / open short
Exit Early Price crosses ATR stop or RSI flips under EMA Exit trade / protect gains
Trend Filter VWAP + 200-SMA alignment Only trade in that direction
Avoid Trades Conflicting bias label or low volume Stay flat
Pro Tips
VWAP → Intraday mean: above = bullish control, below = bearish control.
ATR Stop → Dynamic trailing stop: never widen it manually.
Smoothed Heikin-Ashi → filters noise: trend stays until color flips twice.
RSI Panel → confirms whether to hold through pullbacks.
If RSI and Overlay disagree — wait, not trade.

Institutional Orderflow Pro — VWAP, Delta, and Liquidity
Institutional Orderflow Pro is a next-generation order flow analysis indicator designed to help traders identify institutional participation, directional bias, and exhaustion zones in real time.
Unlike traditional volume-based indicators, it merges VWAP dynamics, cumulative delta, relative volume, and liquidity proximity into a single unified dashboard that updates tick-by-tick — without repainting.
The indicator is open-source, transparent, and educational. It aims to provide traders with a clearer read on who controls the market — buyers or sellers — and where liquidity lies.
The indicator combines multiple institutional-grade analytics into one framework:
RVOL (Relative Volume) = Compares current volume against the average of recent bars to identify strong institutional participation.
zΔ (Delta Z-Score) = Normalizes the buying/selling delta to reveal unusually aggressive market behavior.
CVDΔ (Cumulative Volume Delta Change) = Shows which side (buyers/sellers) is dominating this bar’s order flow.
VWAP Direction & Slope = Determines whether price is trading above/below VWAP and whether VWAP is trending or flat.
PD Distance (Prev Day Confluence) = Measures the current price’s distance from previous day’s high, low, close, and VWAP in ATR units — highlighting liquidity zones.
ABS/EXH Detection = Identifies institutional absorption and exhaustion patterns where momentum may reverse.
Bias Computation = Combines VWAP direction + slope to give a simplified regime signal: UP, DOWN, or FLAT.
All metrics are displayed through a color-coded, non-repainting HUD:
🟢 = bullish / favorable conditions
🔴 = bearish / weak conditions
⚫ = neutral / flat
🟡 = absorption (potential trap zone)
🟠 = exhaustion (momentum fading)
| Metric | Signal | Meaning |
| ---------------------- | ------- | ---------------------------------------------- |
| **RVOL ≥ 1.3** | 🟢 | High institutional activity — valid setup zone |
| **zΔ ≥ 1.2 / ≤ -1.2** | 🟢 / 🔴 | Unusual buy/sell aggression |
| **CVDΔ > 0** | 🟢 | Buyers dominate this bar |
| **VWAP dir ↑ / ↓** | 🟢 / 🔴 | Institutional bias long/short |
| **Slope ok = YES** | 🟢 | Trending market |
| **PD dist ≤ 0.35 ATR** | 🟢 | Near key liquidity zones |
| **Bias = UP/DOWN** | 🟢 / 🔴 | Trend-aligned environment |
| **ABS/EXH active** | 🟡 / 🟠 | Caution — possible reversal zone |
How to Use
Confirm Volume Context → RVOL > 1.2
Align with Bias → Take longs only when Bias = UP, shorts only when Bias = DOWN.
Check Slope and VWAP Dir → Ensure trending context (Slope = YES).
Confirm CVD and zΔ → Flow should agree with price direction.
Avoid ABS/EXH Triggers → These signal exhaustion or absorption by large players.
Enter Near PD Zones → Ideal trade zones are within 0.35 ATR of prior-day levels.
This multi-factor confirmation reduces noise and focuses only on high-probability institutional setups.
Originality
This script was written from scratch in Pine v6.
It does not reuse existing public indicators except for standard built-ins (ta.vwap, ta.atr, etc.).
The unique combination of delta z-scoring, VWAP slope filtering, and real-time confluence zones distinguishes it from typical orderflow tools or cumulative delta overlays.
The core innovation is its merged real-time HUD that integrates institutional metrics and natural-language feedback directly on the chart, allowing traders to read market context intuitively rather than decode multiple subplots.
Notes & Disclaimers
This indicator does not repaint.
It’s intended for educational and analytical purposes only — not as financial advice or a guaranteed signal system.
Works best on liquid instruments (Futures, Indices, FX majors).
Avoid non-standard chart types (Heikin Ashi, Renko, etc.) for accurate readings.
Open-source, modifiable, and compatible with Pine v6.
Recommended Use
Apply it with clean charts and standard candles for the best clarity.
Use alongside a basic structure or volume profile to contextualize institutional bias zones.
Author: Dhawal Ranka
Category - Orderflow / VWAP / Institutional Analysis
Version: Pine Script™ v6
License: Open Source (Educational Use)

Volume Weighted Average Price Band Extension## Volume Weighted Average Price Band Extension (VWAPb)
**Volume Weighted Average Price Band Extension** is an enhanced VWAP indicator that extends the traditional three-band system to include up to **five configurable standard deviation bands**, making it particularly well-suited for analyzing volatile market conditions where price action frequently extends beyond conventional boundaries.
### Key Features
**Extended Band System**
Unlike standard VWAP indicators that typically offer three bands, this indicator provides five independently configurable bands with customizable multipliers (default: 0.5x, 1.0x, 1.5x, 2.0x, and 3.0x). Each band can be toggled on or off, allowing traders to adapt the display to current market volatility and their specific trading strategy.
**Dual Calculation Modes**
The indicator offers flexibility in how bands are calculated:
- **Standard Deviation Mode**: Traditional statistical approach measuring price dispersion from the VWAP
- **Percentage Mode**: Distance calculated as a percentage of VWAP (1 multiplier = 1%), useful for comparing relative moves across different price levels
**Flexible Anchor Periods**
Calculate VWAP from multiple timeframes and events:
- Time-based: Session, Week, Month, Quarter, Year, Decade, Century
- Event-based: Earnings reports, Dividend announcements, Stock splits
- Customizable source (default: hlc3)
**Visual Clarity**
Color-coded bands with semi-transparent fills between upper and lower boundaries help identify key support and resistance zones at a glance. The indicator automatically hides on daily and higher timeframes when enabled, keeping charts clean.
### Ideal For
- **Volatile Markets**: The extended band system captures extreme price movements that often exceed traditional 2-3 standard deviation bounds
- **Scalping & Day Trading**: Multiple bands provide granular entry and exit zones for short-term trades
- **Mean Reversion Strategies**: Identify overextended price action relative to volume-weighted fair value
- **Institutional Order Flow Analysis**: VWAP remains a key benchmark for institutional execution
### How It Works
The Volume Weighted Average Price represents the average price weighted by volume throughout the selected anchor period. The surrounding bands act as dynamic support and resistance levels, with each successive band representing areas of increasing deviation from the volume-weighted mean. In volatile conditions, price may regularly test the outer bands (2.0x, 3.0x), which would be invisible on standard three-band implementations.
**Trading Applications:**
- Price near outer bands (±2.0x, ±3.0x) may signal exhaustion and potential reversal opportunities
- Price oscillating between inner bands (±0.5x, ±1.0x) indicates consolidation
- VWAP itself acts as a dynamic pivot point—bullish above, bearish below
### Settings Overview
- **VWAP Settings**: Anchor period selection, source input, offset capability, option to hide on D/W/M timeframes
- **Bands Settings**: Toggle each of the five bands independently, adjust multipliers, choose between Standard Deviation or Percentage calculation mode
---
**Note**: This indicator requires volume data to function properly. A runtime error will display if volume data is unavailable for the selected symbol.
**Disclaimer**: This indicator is designed for technical analysis and should be used in conjunction with other forms of analysis and proper risk management. Past performance and indicator signals do not guarantee future results.
SAP121212 — Close vs VWAP + Optional RSI (Signals)This indicator combines Supertrend, VWAP with bands, and an optional RSI filter to generate Buy/Sell signals.
How it works
Supertrend Flip (ATR-based): Detects when trend direction changes (from bearish to bullish, or bullish to bearish).
VWAP Band Filter: Signals only trigger if the candle close is beyond the VWAP bands:
Buy = Supertrend flips up AND close > VWAP Upper Band
Sell = Supertrend flips down AND close < VWAP Lower Band
Optional RSI Filter:
Buy requires RSI < 20
Sell requires RSI > 80
Can be enabled/disabled in settings.
Features
Choice of VWAP band calculation mode: Standard Deviation or ATR.
Adjustable ATR/StDev length and multiplier for VWAP bands.
Toggle Supertrend, VWAP lines, and Buy/Sell labels.
Alerts included: add alerts on BUY or SELL conditions (use Once Per Bar Close to avoid intrabar signals).
Use
Works best on intraday or higher timeframes where VWAP is relevant.
Use the RSI filter for more selective signals.
Can be combined with your own stop-loss and risk management rules.
⚠️ Disclaimer: This script is for educational and research purposes only. It is not financial advice. Always test thoroughly and trade at your own risk.
Smart MTF S/R Levels[BullByte]
Smart MTF S/R Levels
Introduction & Motivation
Support and Resistance (S/R) levels are the backbone of technical analysis. However, most traders face two major challenges:
Manual S/R Marking: Drawing S/R levels by hand is time-consuming, subjective, and often inconsistent.
Multi-Timeframe Blind Spots: Key S/R levels from higher or lower timeframes are often missed, leading to surprise reversals or missed opportunities.
Smart MTF S/R Levels was created to solve these problems. It is a fully automated, multi-timeframe, multi-method S/R detection and visualization tool, designed to give traders a complete, objective, and actionable view of the market’s most important price zones.
What Makes This Indicator Unique?
Multi-Timeframe Analysis: Simultaneously analyzes up to three user-selected timeframes, ensuring you never miss a critical S/R level from any timeframe.
Multi-Method Confluence: Integrates several respected S/R detection methods—Swings, Pivots, Fibonacci, Order Blocks, and Volume Profile—into a single, unified system.
Zone Clustering: Automatically merges nearby levels into “zones” to reduce clutter and highlight areas of true market consensus.
Confluence Scoring: Each zone is scored by the number of methods and timeframes in agreement, helping you instantly spot the most significant S/R areas.
Reaction Counting: Tracks how many times price has recently interacted with each zone, providing a real-world measure of its importance.
Customizable Dashboard: A real-time, on-chart table summarizes all key S/R zones, their origins, confluence, and proximity to price.
Smart Alerts: Get notified when price approaches high-confluence zones, so you never miss a critical trading opportunity.
Why Should a Trader Use This?
Objectivity: Removes subjectivity from S/R analysis by using algorithmic detection and clustering.
Efficiency: Saves hours of manual charting and reduces analysis fatigue.
Comprehensiveness: Ensures you are always aware of the most relevant S/R zones, regardless of your trading timeframe.
Actionability: The dashboard and alerts make it easy to act on the most important levels, improving trade timing and risk management.
Adaptability: Works for all asset classes (stocks, forex, crypto, futures) and all trading styles (scalping, swing, position).
The Gap This Indicator Fills
Most S/R indicators focus on a single method or timeframe, leading to incomplete analysis. Manual S/R marking is error-prone and inconsistent. This indicator fills the gap by:
Automating S/R detection across multiple timeframes and methods
Objectively scoring and ranking zones by confluence and reaction
Presenting all this information in a clear, actionable dashboard
How Does It Work? (Technical Logic)
1. Level Detection
For each selected timeframe, the script detects S/R levels using:
SW (Swing High/Low): Recent price pivots where reversals occurred.
Pivot: Classic floor trader pivots (P, S1, R1).
Fib (Fibonacci): Key retracement levels (0.236, 0.382, 0.5, 0.618, 0.786) over the last 50 bars.
Bull OB / Bear OB: Institutional price zones based on bullish/bearish engulfing patterns.
VWAP / POC: Volume Weighted Average Price and Point of Control over the last 50 bars.
2. Level Clustering
Levels within a user-defined % distance are merged into a single “zone.”
Each zone records which methods and timeframes contributed to it.
3. Confluence & Reaction Scoring
Confluence: The number of unique methods/timeframes in agreement for a zone.
Reactions: The number of times price has touched or reversed at the zone in the recent past (user-defined lookback).
4. Filtering & Sorting
Only zones within a user-defined % of the current price are shown (to focus on actionable areas).
Zones can be sorted by confluence, reaction count, or proximity to price.
5. Visualization
Zones: Shaded boxes on the chart (green for support, red for resistance, blue for mixed).
Lines: Mark the exact level of each zone.
Labels: Show level, methods by timeframe (e.g., 15m (3 SW), 30m (1 VWAP)), and (if applicable) Fibonacci ratios.
Dashboard Table: Lists all nearby zones with full details.
6. Alerts
Optional alerts trigger when price approaches a zone with confluence above a user-set threshold.
Inputs & Customization (Explained for All Users)
Show Timeframe 1/2/3: Enable/disable analysis for each timeframe (e.g., 15m, 30m, 1h).
Show Swings/Pivots/Fibonacci/Order Blocks/Volume Profile: Select which S/R methods to include.
Show levels within X% of price: Only display zones near the current price (default: 3%).
How many swing highs/lows to show: Number of recent swings to include (default: 3).
Cluster levels within X%: Merge levels close together into a single zone (default: 0.25%).
Show Top N Zones: Limit the number of zones displayed (default: 8).
Bars to check for reactions: How far back to count price reactions (default: 100).
Sort Zones By: Choose how to rank zones in the dashboard (Confluence, Reactions, Distance).
Alert if Confluence >=: Set the minimum confluence score for alerts (default: 3).
Zone Box Width/Line Length/Label Offset: Control the appearance of zones and labels.
Dashboard Size/Location: Customize the dashboard table.
How to Read the Output
Shaded Boxes: Represent S/R zones. The color indicates type (green = support, red = resistance, blue = mixed).
Lines: Mark the precise level of each zone.
Labels: Show the level, methods by timeframe (e.g., 15m (3 SW), 30m (1 VWAP)), and (if applicable) Fibonacci ratios.
Dashboard Table: Columns include:
Level: Price of the zone
Methods (by TF): Which S/R methods and how many, per timeframe (see abbreviation key below)
Type: Support, Resistance, or Mixed
Confl.: Confluence score (higher = more significant)
React.: Number of recent price reactions
Dist %: Distance from current price (in %)
Abbreviations Used
SW = Swing High/Low (recent price pivots where reversals occurred)
Fib = Fibonacci Level (key retracement levels such as 0.236, 0.382, 0.5, 0.618, 0.786)
VWAP = Volume Weighted Average Price (price level weighted by volume)
POC = Point of Control (price level with the highest traded volume)
Bull OB = Bullish Order Block (institutional support zone from bullish price action)
Bear OB = Bearish Order Block (institutional resistance zone from bearish price action)
Pivot = Pivot Point (classic floor trader pivots: P, S1, R1)
These abbreviations appear in the dashboard and chart labels for clarity.
Example: How to Read the Dashboard and Labels (from the chart above)
Suppose you are trading BTCUSDT on a 15-minute chart. The dashboard at the top right shows several S/R zones, each with a breakdown of which timeframes and methods contributed to their detection:
Resistance zone at 119257.11:
The dashboard shows:
5m (1 SW), 15m (2 SW), 1h (3 SW)
This means the level 119257.11 was identified as a resistance zone by one swing high (SW) on the 5-minute timeframe, two swing highs on the 15-minute timeframe, and three swing highs on the 1-hour timeframe. The confluence score is 6 (total number of method/timeframe hits), and there has been 1 recent price reaction at this level. This suggests 119257.11 is a strong resistance zone, confirmed by multiple swing highs across all selected timeframes.
Mixed zone at 118767.97:
The dashboard shows:
5m (2 SW), 15m (2 SW)
This means the level 118767.97 was identified by two swing points on both the 5-minute and 15-minute timeframes. The confluence score is 4, and there have been 19 recent price reactions at this level, indicating it is a highly reactive zone.
Support zone at 117411.35:
The dashboard shows:
5m (2 SW), 1h (2 SW)
This means the level 117411.35 was identified as a support zone by two swing lows on the 5-minute timeframe and two swing lows on the 1-hour timeframe. The confluence score is 4, and there have been 2 recent price reactions at this level.
Mixed zone at 118291.45:
The dashboard shows:
15m (1 SW, 1 VWAP), 5m (1 VWAP), 1h (1 VWAP)
This means the level 118291.45 was identified by a swing and VWAP on the 15-minute timeframe, and by VWAP on both the 5-minute and 1-hour timeframes. The confluence score is 4, and there have been 12 recent price reactions at this level.
Support zone at 117103.10:
The dashboard shows:
15m (1 SW), 1h (1 SW)
This means the level 117103.10 was identified by a single swing low on both the 15-minute and 1-hour timeframes. The confluence score is 2, and there have been no recent price reactions at this level.
Resistance zone at 117899.33:
The dashboard shows:
5m (1 SW)
This means the level 117899.33 was identified by a single swing high on the 5-minute timeframe. The confluence score is 1, and there have been no recent price reactions at this level.
How to use this:
Zones with higher confluence (more methods and timeframes in agreement) and more recent reactions are generally more significant. For example, the resistance at 119257.11 is much stronger than the resistance at 117899.33, and the mixed zone at 118767.97 has shown the most recent price reactions, making it a key area to watch for potential reversals or breakouts.
Tip:
“SW” stands for Swing High/Low, and “VWAP” stands for Volume Weighted Average Price.
The format 15m (2 SW) means two swing points were detected on the 15-minute timeframe.
Best Practices & Recommendations
Use with Other Tools: This indicator is most powerful when combined with your own price action analysis and risk management.
Adjust Settings: Experiment with timeframes, clustering, and methods to suit your trading style and the asset’s volatility.
Watch for High Confluence: Zones with higher confluence and more reactions are generally more significant.
Limitations
No Future Prediction: The indicator does not predict future price movement; it highlights areas where price is statistically more likely to react.
Not a Standalone System: Should be used as part of a broader trading plan.
Historical Data: Reaction counts are based on historical price action and may not always repeat.
Disclaimer
This indicator is a technical analysis tool and does not constitute financial advice or a recommendation to buy or sell any asset. Trading involves risk, and past performance is not indicative of future results. Always use proper risk management and consult a financial advisor if needed.

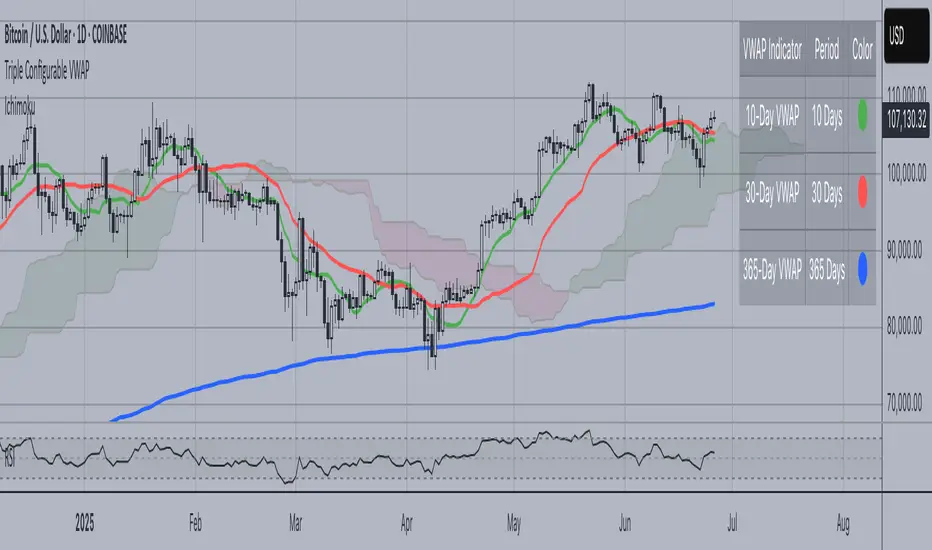
Triple Configurable VWAPTriple Configurable VWAP Indicator
This advanced VWAP (Volume Weighted Average Price) indicator displays three independently configurable VWAP lines on your chart, providing multiple timeframe perspectives for better trading decisions.
Key Features:
• Three Customizable VWAP Periods: Configure each VWAP independently with periods ranging from 1 to 365 days
Default: 10-day (Green), 30-day (Red), 365-day (Blue)
• Dynamic Visual Elements:
Color-coded lines for easy identification
Smart labels at the current price level with matching colors
Contrasting text colors for optimal readability
• Interactive Information Table:
Toggle on/off display
Repositionable to any corner or side of the chart
Shows each VWAP period with corresponding color indicators
Larger, easy-to-read font size
• Professional Calculation Method:
Uses daily timeframe data for accurate VWAP calculations
Anchored VWAP starting from your specified lookback periods
Proper volume weighting for institutional-grade accuracy
Use Cases:
Short-term Trading: 10-day VWAP for recent price action analysis
Medium-term Analysis: 30-day VWAP for monthly trend assessment
Long-term Perspective: 365-day VWAP for yearly institutional levels
Perfect for traders who need multiple VWAP timeframes simultaneously to identify key support/resistance levels, trend direction, and institutional price points across different time horizons.
[Smith] VWAP Deviation + VWAP Deviation +
Short Description:
Advanced VWAP indicator with deviation bands, smart signal filtering, and session-based performance tracking. Features log-space scaling, RSI confirmation, volume filters, and market regime detection.
Full Description:
The VWAP Deviation + is a comprehensive trading indicator that combines Volume Weighted Average Price (VWAP) analysis with advanced signal filtering to identify high-probability trade opportunities. This indicator goes beyond basic VWAP by incorporating multiple confirmation layers and intelligent market analysis.
🎯 Key Features
Core VWAP Analysis:
- Custom volume-weighted mean calculation with deviation bands (2σ and 3σ)
- Optional log-space scaling for proportional price movements
- Real-time VWAP line with customizable visibility
Smart Signal Detection:
- RSI confirmation for all trade signals
- Volume filter requiring above-average trading activity
- Market regime detection (trending vs ranging markets)
- Optional RSI divergence analysis
Advanced Filtering:
- Multi-condition signal validation
- Session-based performance tracking (Asian, London, NY)
- Real-time win rate calculation
- Strong vs regular signal classification
Visual Features:
- Clean, professional interface with customizable colors
- Optional signal shapes and annotations
- Performance statistics table
- Filled deviation bands for easy visualization
📊 How It Works
The indicator identifies trade opportunities when:
1. Price touches VWAP deviation bands (2σ or 3σ)
2. RSI confirms oversold/overbought conditions
3. Volume exceeds the specified threshold
4. Market regime conditions are favorable
Signal Types:
- LONG : Price at lower bands + RSI oversold + volume confirmation
- SHORT : Price at upper bands + RSI overbought + volume confirmation
- STRONG : Same conditions but at 3σ bands for higher conviction trades
⚙️ Customization Options
Core Settings:
- VWAP length and source selection
- Adjustable deviation multipliers
- Log-space scaling toggle
Signal Filters:
- RSI length and threshold levels
- Volume filter with customizable multiplier
- Market type filtering options
Advanced Features:
- Session statistics tracking
- RSI divergence detection
- Market regime analysis
Visual Controls:
- Show/hide individual components
- Custom color schemes
- Signal display toggles
🔔 Alert System
Built-in alerts for:
- Long and short trade opportunities
- Strong signal confirmations
- RSI divergence signals
💡 Best Practices
- Use higher timeframes (15m+) for more reliable signals
- Combine with additional confirmation indicators
- Pay attention to session statistics for timing optimization
- Monitor market regime indicators for context
This indicator is suitable for day traders, swing traders, and anyone looking to improve their VWAP-based trading strategies with advanced filtering and market analysis.

RSI VWAP POC [Uncle Sam Trading]Category: Oscillators, Volume, Market Profile
Timeframe: Suitable for all timeframes
Markets: Crypto, Forex, Stocks, Commodities
Overview
The RSI VWAP POC indicator is a powerful and innovative oscillator that combines the Relative Strength Index (RSI), Volume-Weighted Average Price (VWAP), and Point of Control (POC) from market profile analysis. Designed to provide traders with clear, high-probability trading signals, this indicator helps you identify key market levels, spot overbought/oversold conditions, and time your entries and exits with precision. Whether you’re a day trader, swing trader, or scalper, this free tool adds significant value to your trading strategy by offering a unique blend of momentum, volume, and market profile insights.
How It Works
This indicator integrates three core components to deliver actionable insights:
RSI (Relative Strength Index): Measures momentum to identify overbought (above 70) and oversold (below 30) conditions, helping you anticipate potential reversals.
VWAP (Volume-Weighted Average Price): Calculates a volume-weighted price benchmark, which is used to compute a more accurate, volume-sensitive RSI. This ensures the indicator reflects true market dynamics.
POC (Point of Control): Derived from market profile analysis, the POC represents the price level with the highest traded volume in a session, acting as a critical support or resistance level.
The indicator plots a smoothed RSI based on VWAP, overlaid with market profile data on a user-defined higher timeframe (default: 4H). The POC is displayed as a red line, with aqua bars indicating the value area where the majority of trading volume occurred. When the RSI crosses the POC, the indicator generates clear buy and sell signals:
Strong Buy (SBU): RSI crosses above the POC in an oversold zone.
Strong Sell (SBD): RSI crosses below the POC in an overbought zone.
Additional features include:
Background colors to highlight bullish (green) or bearish (red) trends.
Shaded zones for overbought (70/60) and oversold (30/40) levels.
Customizable settings to fit your trading style and timeframe.
How This Indicator Adds Value
The RSI VWAP POC indicator offers several key benefits that enhance your trading performance:
High-Probability Signals: By combining RSI, VWAP, and POC, this indicator identifies trades at key market levels where price is likely to react, increasing your win rate.
Improved Timing: Clear buy and sell signals, such as ‘SBU’ and ‘SBD’, help you enter and exit trades at optimal points, maximizing profitability.
Risk Management: Overbought/oversold zones and trend confirmation via background colors help you avoid false signals, protecting your capital.
Versatility: Suitable for all markets (crypto, forex, stocks) and timeframes, making it a valuable tool for traders of all experience levels.
Time Efficiency: The indicator does the heavy lifting by analyzing momentum, volume, and market profile data, allowing you to focus on executing trades.
Real-World Performance Example: On a 1-hour Bitcoin chart with a 4-hour higher timeframe, this indicator identified a strong sell signal on April 6th at 12:00 ($82,000), leading to a 9% drop to $74,600. A subsequent strong buy signal on April 7th at 04:00 ($76,200) captured a 6% rise to $81,200 – a potential 25% profit with 5x leverage if exited at 5%.
How to Use
Add the Indicator: Search for “RSI VWAP POC ” in TradingView’s indicator library and add it to your chart.
Set Your Timeframe: The indicator works on any timeframe but is optimized for a 1-hour chart with a 4-hour higher timeframe (set in the settings).
Interpret Signals:
Look for ‘SBU’ (strong buy) labels when the RSI crosses above the POC in an oversold zone, indicating a potential buying opportunity.
Look for ‘SBD’ (strong sell) labels when the RSI crosses below the POC in an overbought zone, signaling a potential selling opportunity.
Use the background colors (green for bullish, red for bearish) to confirm the trend.
Combine with Your Strategy: Use the indicator alongside your existing analysis (e.g., support/resistance, candlestick patterns) for best results.
Settings and Customization
The indicator is highly customizable to suit your trading needs:
RSI Length (Default: 14): Adjust the sensitivity of the RSI. Use a shorter length (e.g., 10) for scalping, or a longer length (e.g., 20) for smoother signals.
EMA Smoothing Length (Default: 3): Smooths the RSI line. Increase to 5 or 7 for less choppy signals in volatile markets.
Higher Timeframe (Default: 240 minutes): Set to 240 (4 hours) for a 1-hour chart. Adjust based on your chart’s timeframe (e.g., 60 minutes for a 15-minute chart).
Value Area Percentage (Default: 100%): Defines the size of the value area around the POC. Lower to 70% for a tighter focus on key levels.
Overbought/Oversold Thresholds (Defaults: 70/30): Adjust these levels to match market conditions (e.g., 80/20 for trending markets).
Show POC Line (Default: True): Toggle the red POC line on or off.
Show Buy/Sell Signals: Enable ‘Show Strong Breakup Signals’ and ‘Show Strong Breakdown Signals’ to focus on high-probability trades.
Why Choose This Indicator?
The RSI VWAP POC indicator stands out by offering a unique combination of momentum, volume, and market profile analysis in a single, easy-to-use tool. It’s designed to help traders of all levels make informed decisions, reduce risk, and increase profitability. Whether you’re trading Bitcoin, forex pairs, or stocks, this indicator provides the clarity and precision you need to succeed.

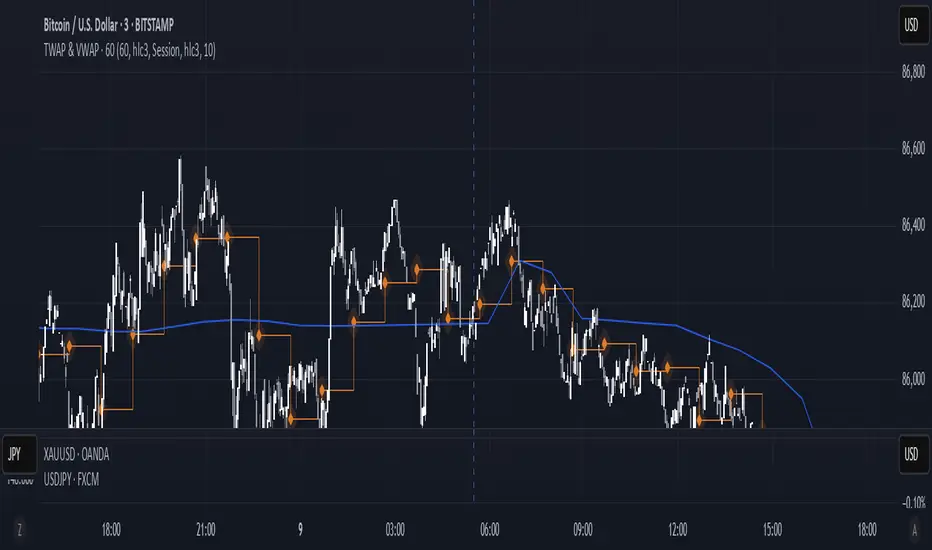
TWAP & VWAP CombinedThis script integrates Time Weighted Average Price (TWAP) and Volume Weighted Average Price (VWAP) into a single TradingView indicator, allowing traders to analyze both price-weighted and volume-weighted trends simultaneously.
Features:
TWAP Calculation:
Computes the average price over a specified anchor period (e.g., daily).
Resets and recalculates TWAP when the anchor period changes.
Uses the OHLC4 (Open, High, Low, Close average) as the default price source.
VWAP Calculation:
Computes the VWAP based on the selected anchor period (Session, Week, Month, etc.).
Allows the option to hide VWAP when the timeframe is 1D or higher.
Uses HLC3 (High, Low, Close average) as the default source.
Dynamically resets VWAP at the start of a new period.
Customization Options:
Users can modify the source price for TWAP and VWAP calculations.
Adjustable offsets for both indicators to shift plots forward or backward.
Ability to select different VWAP anchor periods, including earnings, dividends, and splits.
Error Handling:
Displays an error message if volume data is missing, ensuring VWAP functions correctly.
Salman Indicator: Multi-Purpose Price ActionSalman Indicator: Multi-Purpose Price Action Tool for Pin Bars, Breakouts, and VWAP Anchoring
This indicator provides a comprehensive suite of price action insights, designed for active traders looking to identify key market structures and potential reversals. The script incorporates a Quarterly VWAP for trend bias, marks pin bars for possible reversal points, highlights outside bars for volatility signals, and indicates simple breakouts and pivot-level breaks. Customizable settings allow for flexibility in various trading styles, with default settings optimized for daily charts.
Outside Bars : Represented by an ⤬ symbol on the chart, these indicate bars where the current high is greater than the previous bar’s high, and the low is lower than the previous bar’s low, signaling high volatility and potential market reversals.
Pin Bars : Denoted by a small dot at the top or bottom of a candle’s wick, these are crucial signals of potential reversal areas. Pin bars are identified based on the percentage length of their shadows, with adjustable strictness in settings.
Quarterly VWAP : The light blue line on the chart represents the VWAP (Volume-Weighted Average Price), which is anchored to the Quarterly period by default. The VWAP acts as a directional bias filter, helping you to determine underlying market trends. This period, source, and offset are fully adjustable in the script’s settings.
Simple Breaks : Hollow candles on the chart indicate "simple breaks," defined when the current bar closes above the previous high or below the previous low. This is an effective way to highlight directional momentum in the market.
Bonus Pivot Breaks : The tilde symbol ~ appears when the price closes above or below prior pivot high/low levels, helping traders spot significant breakout or breakdown points relative to recent pivots.
Alerts
Simple Breaks : Alerts you when a breakout occurs beyond the previous bar’s high or low. Pin Bars : Notifies you of potential reversal points as indicated by bullish or bearish pin bars. Outside Bars : Triggers an alert whenever an outside bar is detected, indicating possible volatility changes.
How to Use
VWAP for Trend Bias : Use the Quarterly VWAP line to gauge overall market trend, with settings that allow adjustment to daily, weekly, monthly, or even larger time frames.
Pin Bars for Reversal Potential : Look for the dot markers on candle wicks, where the strictness of the pin bar detection can be adjusted via settings to match your trading preference.
Simple and Pivot Breaks for Momentum : Watch for hollow candles and the tilde symbol ~ as indicators of potential breakout momentum and pivot break levels, respectively.
This script can serve traders on multiple timeframes, from daily to weekly and beyond. The flexible configuration allows for adjustments in VWAP anchoring and pin bar criteria, providing a tailored fit for individual trading strategies.

Expanding Volume Range with Anchored VWAPExpanding Volume Range with Anchored VWAP Indicator Summary
This Pine Script indicator is designed for intraday trading, particularly for timeframes of 60 minutes or less. It combines several technical analysis concepts to provide traders with a comprehensive view of price action, volume, and potential support/resistance levels.
## Key Features
1. **Anchored VWAP (Volume Weighted Average Price)**
- Calculates and displays an Anchored VWAP line
- Resets at the start of each new day or when a new highest volume bar is detected
2. **Expanding Volume Range (EVR)**
- Identifies and highlights high volume bars
- Creates a box around the price range of the last three high volume bars
- Generates additional support/resistance lines based on this range
3. **Custom Multiplier Calculations**
- Allows users to customize the calculation of support/resistance levels
- Includes options for separate top and bottom multipliers
- Provides an exponential adjustment for fine-tuning
4. **Volume-Based Candle Coloring**
- Colors candles differently based on their volume relative to recent history
- Highlights the first candle of each session in a distinct color
5. **VWAP-Based Line and Fill Colors**
- Changes colors of lines and fills based on price position relative to VWAP
6. **Alert Generation**
- Creates alerts when price breaks above or below the EVR high and low levels
## User Inputs
The indicator offers several customizable inputs grouped into categories:
1. **Volume Colors**
- Customize colors for various elements (lines, fills, candles) based on volume and VWAP relationship
2. **Target Levels**
- Set multipliers for calculating target levels
3. **Multiplier Calculations**
- Enable/disable custom multiplier calculations
- Set base multipliers and exponents for top and bottom levels
## Functionality Breakdown
1. The indicator tracks the highest volume bars for the current and previous day.
2. It creates an Expanding Volume Range (EVR) based on the last three high volume bars.
3. Using the EVR, it calculates and draws support and resistance levels.
4. The levels can be calculated using either simple multipliers or a more complex exponential formula, depending on user preference.
5. Candles are colored based on their volume and whether they're the first candle of a session.
6. An Anchored VWAP is calculated and displayed, resetting at the start of each day or on new highest volume bars.
7. Alerts are generated when price moves beyond the EVR high or low levels.
## Use Cases
This indicator can be particularly useful for:
- Identifying potential support and resistance levels based on high volume price action
- Spotting changes in volume patterns throughout the trading session
- Recognizing price action relative to the Anchored VWAP
- Setting up potential entry and exit points based on the expanding volume range
Traders should use this indicator in conjunction with other forms of analysis and risk management strategies for best results.

BabyShark VWAP Strategy What the code does:
This Pine Script implements a trading strategy based on two indicators: Volume Weighted Average Price (VWAP) and On Balance Volume (OBV) Relative Strength Index (RSI). The strategy aims to identify potential buy and sell signals based on deviations from VWAP and OBV RSI crossing certain threshold levels.
How it does it:
**VWAP Calculation**: The script calculates the VWAP using either standard deviation or average deviation over a specified length. It then plots the VWAP and its upper and lower deviation bands.
**OBV RSI Calculation**: It computes the OBV and then calculates the RSI using the cumulative changes in OBV. The RSI is plotted and compared against predefined levels.
**Table Visibility and Occurrence Counting**: It allows the user to display a table showing the number of occurrences where the price is above Upper Dev 2, below Lower Dev 2, crosses above a higher RSI level, or crosses below a lower RSI level.
**Entries**: Long and short entry conditions are defined based on the position of the price relative to the VWAP deviation bands and the color of the OBV RSI. Entries are made when specific conditions are met, and there hasn't been a recent entry.
**Exit Conditions**: The script includes stop-loss and take-profit mechanisms. It exits positions based on price crossing the VWAP or a certain percentage, and it prevents further trading after a certain number of consecutive losses.
What traders can use it for:
**Trend Identification**: Traders can use the VWAP and its deviation bands to identify potential trend reversals or continuations.
**Volume Confirmation**: The inclusion of OBV RSI provides confirmation of price movements based on volume changes.
**Entry and Exit Signals**: The script generates buy and sell signals based on the specified conditions, allowing traders to enter and exit positions with defined stop-loss and take-profit levels.
**Statistical Analysis**: The visibility of occurrence counts in the table allows traders to perform statistical analysis on the frequency of price movements relative to the VWAP and OBV RSI levels.

Multi-Time AVWAP_BEARConcept
Collaboration Highlight:
This was a collaboration with @Chart_School and @KioseffTrading Thank you to both, along with Ricardo Santos for his awesome library we used.
Overview
See how you view different time frame charts with one indicator and little to no adjustment.
Innovation:
The concept of using Anchored VWAP (AVWAP) with time events is a powerful technique in trading and technical analysis. Anchored VWAP differs from the traditional Volume Weighted Average Price (VWAP) by allowing traders to select a specific starting point or "anchor," from which the VWAP calculation begins. This approach is particularly useful for assessing price movements in relation to significant market events or specific periods of interest.
Utility and Flexibility:
Explaining the flexibility in turning on and off different time slices without much adjustment showcases a user-friendly design.
Key Uses and Benefits
Comparative Performance:
Anchoring the VWAP at the start of different time frames (e.g., weekly, monthly, quarterly) enables traders to compare the current price performance against previous periods. This comparison can highlight trends or shifts in trading momentum relative to past activity.
Support and Resistance Levels:
AVWAP lines can act as dynamic support and resistance levels. When anchored to significant time events, these levels gain additional relevance as they reflect the market's valuation of an asset since a notable point in time. Traders often watch for price interactions with these levels to make informed trading decisions.
Risk Management:
Anchored VWAP can serve as a benchmark for setting stop-loss orders or profit targets. By considering the price's relation to the AVWAP of a specific period or after a key event, traders can define exit points that are aligned with market-generated information.
Trend Confirmation: The direction and stability of the price relative to an anchored VWAP can indicate the strength of a trend. If the price consistently remains above an AVWAP anchored at a bullish event (or below for a bearish event), it may confirm the trend's continuation.
Further Reading
Educational Resource:
Becuase we are using Volume with a relation to price AVWAP is very powerful to show data that cannot be eye balled on its own. Brian Shannon's book "Maximum Trading Gains With Anchored VWAP - The Perfect Combination of Price, Time & Volume", is an excellent guide to best practices on how to use AVWAP to your advatage while trading. His book goes into depth about the best way to use this indicator to its fullest potencial.
Tips for Using This Indicator
Weekly / Monthly / Quarterly Settings:
All the settings for the lower timeframe charts are similar. Here is an example of seeing a Weekly AVWAP for 6 weeks, showing:
1. The start of the 6-week AVWAP is using a High Low Close source for the first candle of the 6 weeks.
2. The lines are colored "Red" for the AVWAPs.
3. The line thickness is "1".
Yearly Settings
Simlair to the other settings with the Yearly we give you a couple more options along with 3 years to toggle on and off. The idea was to allow the user to see which AVWAP most effected by price and quickly toggle them on and off to unclutter their chart.
Watch for how and if the labels over lap and choose the one you feel is most in play. In Shannon's Book he talks about "Hand off's" and "Pinches". These concepts are easy to spot with being able to see all the Major Time Events, then simply toggle off the one you dont need.
A great benefit to how we coded this script you can buzz through a watch list without having to re-adjust the Anchor points. This will save you time if following a basket of symbols and show coorlations in the overall market.
Secret Feature
When looking at these becuase the user doesn't need to hand plot the anchor points and we are fouced on major time slices, I encourge you to use the Trading View "Bar Replay" Feature. You think that you are missing a high or low AVWAP but what is happening is the indicator is re-plotting a level that is super hard to see, then you will see the hand-offs like Shannon discusses in his book. This blew me away while we were discussing it post development.
Conclusion
There are so many uses of how to use VWAP and therories on its best practice. We are only using "TIME EVENTS". For more ways to use AVWAP, I would encourge you to also handplot them with Trading View's new "Anchored VWAP", as seen in the standard toolbar.
Using your ideas along with this indicator i think its a powerful combination.
Also Check Out: allanster's - Anchored VWAP Pinch & Handoff, Intervals, and Signals
He has a great AVWAP script that incorporates many AVWAP ideas.

Noa: Z-distance from VWAP with Kalman Smoother
Title: Noa: Z-distance from VWAP with Kalman Smoother
Description:
The "Z-distance from VWAP with Kalman Smoother" is a tool constructed on the premise that price evolves in distinct stages: normal or extreme trends (upward or downward) and transitional periods, termed as 'flips'. The Volume Weighted Average Price (VWAP) serves as a benchmark, representing the market's expectation of a fair value over a given time frame. However, since each stock trades on its unique price scale, direct comparisons are not feasible. This script introduces a standardized method, using the Z-score from the VWAP, to understand and compare these relationships across diverse scales.
Core Principles:
Stages of Price Movement:
- Prices don't move purely randomly; while they contain a random element, they oscillate in discernible patterns or stages—either maintaining a trend (normal or extreme) or undergoing transition (flip).
- VWAP as Fair Value: VWAP offers a dynamic representation of what the market perceives as fair value for a stock over a specific period.
- Standardizing Price Relations: Given the varied scales at which different stocks trade, a model was imperative to standardize these relations. The Z-score from the VWAP fulfills this role, offering a normalized measure of how far the price deviates from its perceived fair value.
Features:
Z-score Levels:
The indicator demarcates various stages of price movements, offering clarity on potential overbought or oversold conditions.
- Extreme Up Trend: Indicated when the Z-score surpasses the upper limit.
- Normal Up Trend: Represented when the Z-score lies between the flip upper and the upper limit.
- Transition (Flip): Recognized when the Z-score oscillates within the flip range.
- Normal Down Trend: Denoted when the Z-score is between the flip lower and the lower limit.
- Extreme Down Trend: Marked when the Z-score falls below the lower limit.
Visual Aids:
- Color-coded regions between specific Z-score levels and the Z-score plot itself elucidate the current market state.
- Kalman Filter: By incorporating a Kalman filter, the indicator offers a less noisy and smoother representation of the Z-score, enhancing its interpretability.
Usage:
Trend Analysis:
- The Z-score states and the color-coded plot facilitate a nuanced understanding of the prevailing market trend.
- Potential Reversal Points: Extremely positive or negative Z-scores might hint at impending reversals.
- Buy/Sell Signals: Z-score's interactions with the flip level can be interpreted as potential trading signals.
Example (for illustration purposes only):
AAPL since April 2022: The stock exited from a normal uptrend and transitioned potentially towards a downtrend. By the end of April, AAPL flipped twice before transitioning to a normal downtrend. By early May, the stock moved into an aggressive downtrend. Market buyers were able to counter this downtrend by June, but selling pressure persisted, pushing the stock back into an aggressive downtrend. By the end of June, buyers halted the aggressive selling and transitioned the stock from an aggressive to normal downtrend, then to a flip, and finally to a normal uptrend by the end of August. AAPL briefly peaked into an aggressive uptrend before being pressured back to a normal downtrend. The rest of 2022 saw AAPL attempting several short-lived uptrend flips. However, 2023 brought a change, with AAPL flipping into a normal uptrend by the end of January, maintaining it until August of that year.
Credits:
This script, inspired by Z distance from VWAP by LazyBear and Kalman Smoother by alexgrover, was revamped and enriched by nord-ouestadvisors to embed these core principles and heighten its usability. A special acknowledgment to ChatGPT by OpenAI for the guidance.

Volatility Weighted Moving Average + Session Average linesHi Traders !
Just finished my Y2 university finals exams, and thought I would cook up a quick and hopefully useful script.
VWAP + Session Average Lines :
Volatility Weighted Average Price in the standard case is a trading indicator that measures the average trading price for the user defined period, usually a standard session (D timeframe), & is used by traders as a trend confirmation tool.
This VWAP script allows for altering of the session to higher dimensions (D, W, M) or those of lower dimension (H4, or even H1 timeframes), furthermore this script allows the lookback of data to be switched from the standard session to a user defined amount of bars (e.g. the VWAP of 200 bars as opposed to the VWAP of a standard session which contains 95 bars in M15 timeframe for 24/7 traded assets e.g. BTCUSD), lastly this script plots Session VWAP Average Lines (if true in settings) so tradaes can gauge the area of highest liquidity within a session, this can be interpreted as the fair price within a session. If Average lines are increasing and decreasing consistently like a monotonic function this singles traders interest is at higher / lower prices respectively (Bullish / Bearish bias respectively ?), However if Average lines are centered around the same zones without any major fluctuations this signals a ranging market.
VWAP calculation :
VWAP is derived from the ratio of the assets value to total volume of transactions where value is the product of typical price (Average of high, low and close bars / candles) and corresponding bar volume, value can be thought of as the dollar value traded per bar.
How is VWAP used by Institutions / Market movers :
For some context and general information, VWAP is typically used by Market movers (e.g. Hedge funds, Mutual funds ,..., ...) in their trade execution, as trading at the VWAP equals the area of highest market volume, trading in line with the volume of the market reduces transaction costs by minimizing market impact (extra liquidity lowers spreads and lag time between order fills), this overall improves market efficiency.
In my opinion the script is best used with its standard settings on the M15 timeframe, note as of now the script is not functional on certain timeframes, however this script is not intended to be used in these timeframes, i will try fix this code bug as soon as possible.
Custom Weighted Moving Average with SMA, EMA, and VWAPThe Custom Weighted Moving Average with SMA, EMA, and VWAP (CWMA-SMA-EMA-VWAP) is a versatile and comprehensive trading indicator that combines the strength of Simple Moving Averages (SMAs), Exponential Moving Averages (EMAs), and the Volume Weighted Average Price (VWAP) to create a custom weighted moving average. This indicator is designed to provide a more holistic view of the market and enhance trading decisions by considering multiple moving average types and their respective timeframes. The indicator also highlights intersections between the custom weighted moving average and the individual SMA, EMA, and VWAP lines by changing their color to yellow, which can be used as potential entry or exit signals.
How to Use:
The CWMA-SMA-EMA-VWAP indicator can be used in various ways to make informed trading decisions. Here are some possible strategies:
Trend Identification: The custom weighted moving average (CWMA) can act as a dynamic support and resistance level, smoothing out the price movements and revealing the underlying trend. When the price is above the CWMA, it may indicate an uptrend, and when it's below, a downtrend. Traders can use this information to align their trades with the prevailing market trend.
Crossovers: The intersections between the CWMA and individual SMA, EMA, and VWAP lines are highlighted in yellow, which can serve as potential entry or exit signals. For instance, when the price or one of the moving averages crosses above the CWMA, it may signal a bullish trend, and traders could consider entering a long position. Conversely, when the price or one of the moving averages crosses below the CWMA, it may signal a bearish trend, and traders could consider entering a short position.
Confirmation of Signals: The CWMA-SMA-EMA-VWAP indicator can be used in conjunction with other technical analysis tools to confirm or strengthen trading signals. For example, traders may use oscillators like the RSI or MACD to confirm overbought or oversold conditions and identify potential reversals in tandem with the CWMA-SMA-EMA-VWAP crossovers.
Stop Loss and Take Profit Levels: The CWMA, SMAs, EMAs, and VWAP lines can serve as dynamic support and resistance levels, helping traders set stop loss and take profit targets. For example, a trader might set a stop loss below the CWMA during an uptrend or above the CWMA during a downtrend. Similarly, they might set take profit targets near significant SMA or EMA levels, anticipating that the price may reverse or consolidate at these points.
It's important to note that the CWMA-SMA-EMA-VWAP indicator, like any other technical analysis tool, should not be used in isolation. Combining it with other technical analysis methods, proper risk management, and a well-defined trading plan will increase the chances of success in the market. Additionally, traders should backtest and validate any strategy using historical data before applying it to real-world trading.

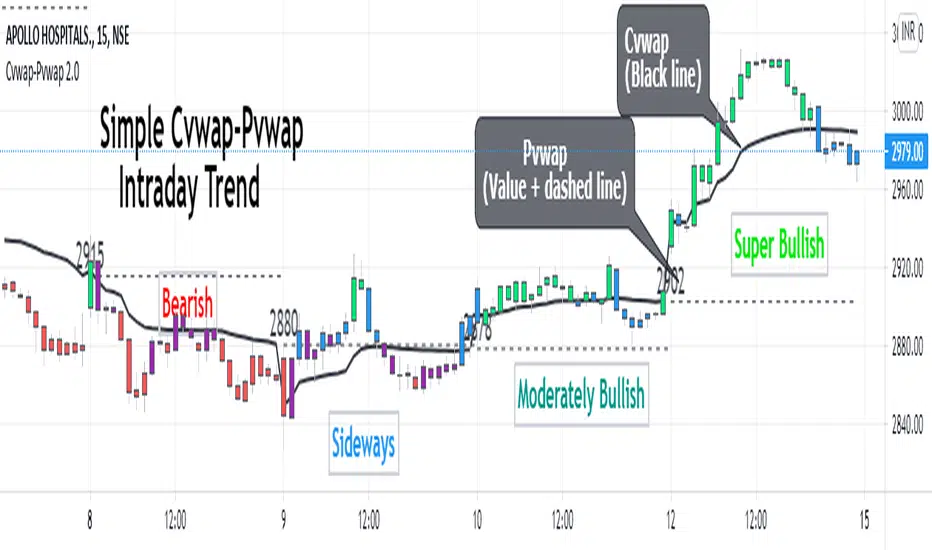
Cvwap-Pvwap 2.0A simple vwap based Intraday trend indicator.
Volume-Weighted Average Price (VWAP) - the average price weighted by volume, starts when trading opens and ends when it closes. This can help institutions buy or sell in large orders, without disturbing the market.
After buying or selling, institutions compare instrument price to closing VWAP values at end of the day.
For big financial institutions;
A buy order executed below the VWAP value, considered a good fill because the security was bought at a below average price.
A sell order executed above the VWAP would be deemed a good fill because it was sold at an above average price.
Simple price based moving average is not helpful for them; = as it doesn't incorporates volume traded. Hence - VWAP :)
So how it helps us in decoding the IntraDay-trend? - Through a 2 day vwap co-relation.
So, Closing value of previous day vwap = Pvwap
Today's running vwap = Cvwap
Defining the IntraDay Trend:
Moderately Bullish = candle closing price above Pvwap but below Cvwap
Super Bullish = Closing price is above both (Cvwap and Pvwap)
Moderately Bearish = Closing price is above Cvwap but below Pvwap
Super Bearish = Closing Price is below both (Cvwap and Pvwap)
A big gap between the Cvwap and the candle closing price defines the strong participation from institutions in that direction. (Strong Trend)
Moving with the smart money, in the overall trend is a wise decision for any intraday trader and this helps at its best.
RSI of VWAP [SHORT selling]This is SHORT selling version of RSIofVWAP strategy. Settings and Logic are totally different from LONG side version , hence I am publishing it as a new strategy.
Settings
============
VWAP of RSI Length 15
Slow EMA Length 200
Short entry level 25
Cover short level 70
stop loss 5
SHORT Entry
============
condition1 : When RSIofVWAP crossdown below 25 and VWAP is below ema200
condition2: When weekly RSIofVWAP crossdown 70 and VWAP (note : session vwap , not weekly vwap) is below ema200
condition3: Use VIX value , if you want to short when the price is above ema200
vwap RSI crossing down 70 and VIX RSI is cossing up 70
enter short ... This is like falling knife :-)
I need to add the code -- later
if any of above condition is TRUE , SHORT entry will be taken
Take Profit
============
When close less than short entry price and RSIofVWAp is crossing up 25 , take profit ...close 1/3 of the position
Exit
============
When RSIofVWAP crossing up 70 level
Stop Loss
============
Stop Loss is set to 5%
Note:
1. When strategy is in SHORT position , background and bar color changes to gray
2. When strategy is already in short position , possible entries are shown in yellow background
3. RSI Length 15 is working most of the equities on hourly chart. ( RSI length 9 and 14 also works good , but not for all ... You may want to try which setting works for your symbol)
4. weekly VWAP (blue color) is also plotted by default ... you can disable it if you dont want to see it. But there is advantage keeping it on the chart , you can notice whenever weekly VWAP crosses above 70 line , trend is UP ... if you have LONG position you can hold on it ... Hurray :-)
Warning
============
For the educational purposes only

Whale Hunter V121. Overview
Whale Hunter V12 is a specialized Pine Script indicator designed for high-precision scalping (1m, 5m timeframes) on Futures and Crypto markets. Unlike standard indicators that lag, V12 focuses on Volume Spread Analysis (VSA) and Order Flow to detect institutional "Whale" activity.
Its "Precision Engine" filters out low-volatility churn and fake signals by enforcing strict volatility gates (ATR) and volume thresholds.
2. The Logic: How Scoring Works (0-12 Points)
Every candle is analyzed and given a "Confluence Score" from 0 to 12. A signal is only generated if the score meets your minimum threshold (Default: 8).
Component
Max Points
Logic
A. Volume Spike
4 pts
Measures relative volume vs. 20-period average.
• 2.0x Vol = 2 pts
• 3.0x Vol = 3 pts
• 5.0x Vol = 4 pts (Whale)
B. Trend (VWAP)
3 pts
Checks alignment with Volume Weighted Average Price.
• Buy above VWAP = +3 pts
• Sell below VWAP = +3 pts
C. Absorption Wick
3 pts
Measures the rejection wick vs. candle body.
• Wick > 1.5x Body = 1 pt
• Wick > 50% Range = 2 pts
• Wick > 65% Range = 3 pts (Hammer/Shooting Star)
D. CVD Divergence
2 pts
Checks if momentum contradicts price.
• Price Lows lower + Volume Flow Higher = +2 pts (Bullish Divergence)
E. Penalties
-3 pts
The Fakeout Killer:
• Buying on a Red Candle = -3 pts
• Selling on a Green Candle = -3 pts
3. Settings & Configuration
You can customize the strictness of the engine in the indicator settings menu.
A. Signal Precision
Minimum Score to Show (Default: 8)
8-12: "Sniper Mode." Shows only high-probability setups trading with the trend (VWAP aligned).
6-7: "Scout Mode." Shows counter-trend reversals and riskier scalps.
< 5: Not recommended (Too much noise).
Ignore Small Candles (ATR %) (Default: 0.5)
The "Churn Filter". It ignores any candle smaller than 50% of the average size.
Increase to 0.8 if you are getting too many signals during flat/choppy markets.
B. Volume Logic
Strict Volume (Default: ON)
When checked, the script blocks any signal with less than 2.0x average volume, regardless of the score. This ensures you only trade when Whales are actually present.
4. How to Read the Signals
🟢 Bullish Signal (Buy)
Symbol: Green Triangle below the bar.
Condition: Score ≥ 8. The Whale absorbed selling pressure (Wick) on high volume, likely creating a "Bear Trap."
Ideal Setup: Price is Above the Blue Line (VWAP) + Green Arrow.
Stop Loss: Just below the low of the signal candle (the wick).
🔴 Bearish Signal (Sell)
Symbol: Red Triangle above the bar.
Condition: Score ≥ 8. The Whale absorbed buying pressure (Wick) on high volume, likely creating a "Bull Trap."
Ideal Setup: Price is Below the Blue Line (VWAP) + Red Arrow.
Stop Loss: Just above the high of the signal candle.
🔵 Blue Line (VWAP)
This is your "Trend Anchor."
Do not Short if price is significantly above the Blue Line.
Do not Long if price is significantly below the Blue Line.
5. Troubleshooting / FAQ
Q: Why did a signal disappear?
A: The script repaints only during the live candle. Once a candle closes, the signal is permanent. If a signal vanishes before close, it means the volume or price action changed last second (e.g., the candle turned Red, triggering the -3 penalty).
Q: Why are there no signals on my chart?
A: You are likely in a low-volume period (Lunch hour / Late night). The Strict Volume filter is doing its job by keeping you out of dead markets. Alternatively, lower the Minimum Score to 6.
Q: Can I use this on 1-minute timeframes?
A: Yes, but increase the ATR Filter to 0.6 or 0.7 to filter out the micro-noise common on 1m charts.

Session VWAP Cumulative BiasThe Session VWAP Cumulative Bias indicator is designed to differentiate between "choppy" price action and true "institutional" trend days. Unlike standard VWAP indicators that only show where price is now, this tool tracks the cumulative sentiment of the entire session.
Core Functions:
Cumulative Z-Score Logic: It calculates the distance between price and VWAP (in Standard Deviations) and sums it up over the course of the day. This reveals the "weight" of the market bias—the longer price stays pinned away from the VWAP, the more extreme the histogram becomes.
Scale Protection: It includes a "Capping" mechanism that prevents morning gaps or low-volume outliers from distorting the scale, ensuring the histogram remains readable from open to close.
Momentum vs. Regime Toggles: Users can switch between VWAP Slope (measuring the speed of the average's movement) and Cumulative Bias (measuring total session dominance).
Visual price Overlay: It automatically colors the price candles and plots a session-anchored VWAP line on the main chart, providing a clear visual of when price is "fair" versus "overextended."
How to read it:
Trend Confirmation: A steadily growing "mountain" in the histogram confirms an institutional trend day where dips are being bought (or rips sold).
Mean Reversion: When price hits a new high but the Cumulative Histogram begins to round off or diverge, it signals that the "elastic band" is stretched and price is likely to return to the orange VWAP line.
Regime Shifts: A cross of the zero-line on the histogram indicates a total shift in session control from buyers to sellers (or vice versa).
