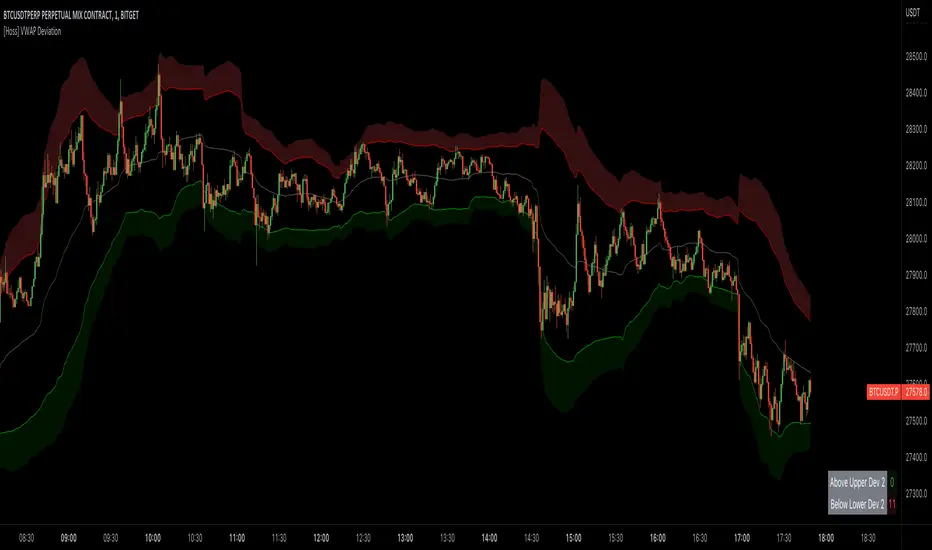
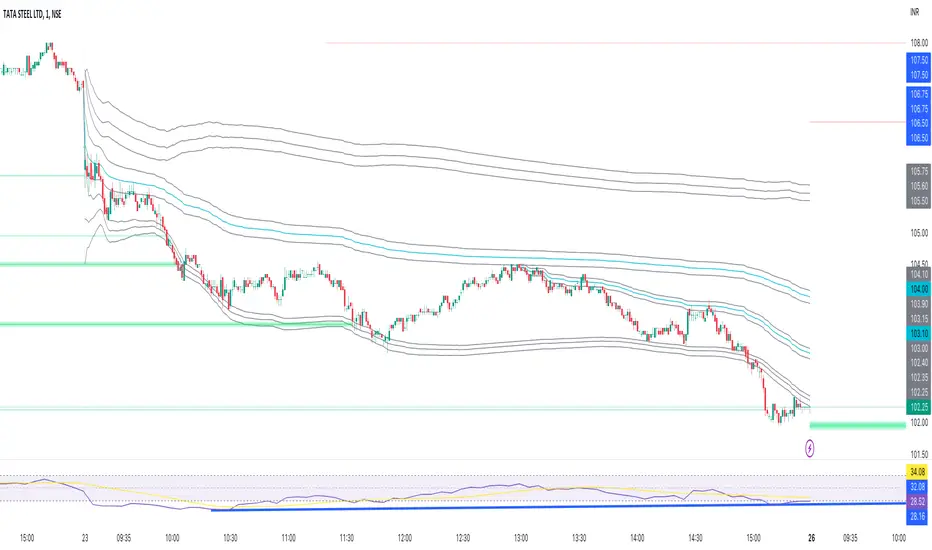
Rumpy's Multi Interval Extended VWAPsExperiment with various intervals of VWAPs and extending them 1 & 2 extra intervals. Uses base intervals from the standard 1 day to half yearly intervals (day/month/quarterly/half yearly).
VWAPs are calculated by the sum of typical price x volume divided by sum volume over the interval. With the 1 D (standard vwap ) the sums reset to zero at the end of the day.
The extensions instead of resetting to zero continues the calculation. Extending the interval an additional interval length.
Technically this means in the case of the standard VWAP that the 1st extension is actually the 2nd day of a 2 Day interval VWAP and the 2nd extension is the 3rd day of a 3 Day interval VWAP .
Same goes for the other intervals eg.
1 Month VWAP =>
1st extension : 2nd Month of a 2 Month interval VWAP
2nd extension : 3rd Month of a 3 Month interval VWAP
2nd extensions are disabled by default as there is usually often overlap, however there can be notable exceptions (such as the current 2nd Monthly extension on BTCUSD )
--------------------------------------
If you find it useful please consider a tip/donation :
BTC - 3BMEXEDyWJ58eXUEALYPadbn1wwWKmf6sA
--------------------------------------
Komut dosyalarını "VWAP" için ara
3 Zero Lag + 3 Moving Averages + 3 RVWAPThe "3 Zero Lag + 3 Moving Averages + 3 RVWAP" (ZMR) indicator combines three groups of tools for technical analysis.
1. Three Customizable Moving Averages (MAs):
Configuration for Each MA:
Choice of 7 types (SMA, EMA, WMA, HMA, VWMA, LSMA, SMMA).
Independent periods and price sources for each line.
Visualization:
MA1 (Blue), MA2 (Red), MA3 (Green).
2. Three Zero Lag EMAs (ZLEMA) with Individual Settings:
Lag Reduction: Corrects traditional EMA lag using:
Adjusted Price = 2 * Current Price - Price .
Flexibility:
Unique lengths (20, 50, 70) and individual price sources for each ZLEMA (HLC3, HL2, Close, etc.).
Colors:
ZLEMA1 (Yellow), ZLEMA2 (Orange), ZLEMA3 (Purple).
3. Three Rolling VWAPs with Custom Parameters:
Volume-Weighted Average Price (VWAP):
Calculated for three periods (20, 50, 100) with dedicated price sources for each VWAP.
Colors:
VWAP1 (Pink), VWAP2 (Light Blue), VWAP3 (Neon Green).
MVSF 6.0[ELPANO]The "MVSF 6.0 " indicator, which stands for Multi-Variable Strategy Framework, overlays on price charts to aid in trading decisions. It combines various moving averages and volume data to generate buy and sell signals based on predefined conditions.
Key features of the indicator include:
Moving Averages: It uses three exponential moving averages (EMAs) with lengths of 200, 100, and 50, and two simple moving averages (SMAs) with lengths of 14 and 9. These averages are combined into a single average line to detect trends.
Volume Analysis: The volume is assessed over a specified period (default is 2 bars) to determine its trend relative to its average, influencing the color and interpretation of signals.
Price Source and VWAP: Users can select the price (close, low, or high) used for calculations. The volume-weighted average price (VWAP) serves as a potential benchmark or condition in signal generation.
Signal Generation: Buy and sell signals are based on the relationship of the price to the average line and VWAP, the direction of the last candle, and the trend direction of the average line. These signals are visually represented on the chart.
Customization: Traders can toggle the visibility of signals, entry points, the average line, and even use these elements as conditions for filtering signals.
This script is designed to be flexible, allowing traders to modify settings according to their strategy needs. The description and implementation aim to provide clarity on how each component works together to assist in trading decisions, adhering to best practices for creating and publishing trading scripts.
*************************************
Der Indikator "MVSF 6.0 ", der für Multi-Variable Strategy Framework steht, wird über Preisdiagramme gelegt, um bei Handelsentscheidungen zu helfen. Er kombiniert verschiedene gleitende Durchschnitte und Volumendaten, um Kauf- und Verkaufssignale basierend auf vordefinierten Bedingungen zu generieren.
Wesentliche Merkmale des Indikators umfassen:
Gleitende Durchschnitte: Es werden drei exponentielle gleitende Durchschnitte (EMAs) mit Längen von 200, 100 und 50 sowie zwei einfache gleitende Durchschnitte (SMAs) mit Längen von 14 und 9 verwendet. Diese Durchschnitte werden zu einer einzelnen Durchschnittslinie kombiniert, um Trends zu erkennen.
Volumenanalyse: Das Volumen wird über einen festgelegten Zeitraum (standardmäßig 2 Balken) bewertet, um seinen Trend im Vergleich zum Durchschnitt zu bestimmen, was die Farbe und Interpretation der Signale beeinflusst.
Preisquelle und VWAP: Benutzer können den für Berechnungen verwendeten Preis (Schluss-, Tief- oder Hochkurs) auswählen. Der volumengewichtete Durchschnittspreis (VWAP) dient als mögliche Benchmark oder Bedingung bei der Generierung von Signalen.
Signalgenerierung: Kauf- und Verkaufssignale basieren auf dem Verhältnis des Preises zur Durchschnittslinie und zum VWAP, der Richtung der letzten Kerze und der Trendrichtung der Durchschnittslinie. Diese Signale werden visuell auf dem Diagramm dargestellt.
Anpassung: Händler können die Sichtbarkeit von Signalen, Einstiegspunkten, der Durchschnittslinie und sogar deren Verwendung als Bedingungen für die Filterung von Signalen ein- und ausschalten.
Dieses Skript ist so konzipiert, dass es flexibel ist und Händlern erlaubt, die Einstellungen gemäß ihren Strategiebedürfnissen zu modifizieren. Die Beschreibung und Implementierung zielen darauf ab, Klarheit darüber zu schaffen, wie jede Komponente zusammenarbeitet, um bei Handelsentscheidungen zu helfen, und halten sich an die besten Praktiken für die Erstellung und Veröffentlichung von Handelsskripten.
Stock trending strategy This is a long only strategy designed maily for stock markets and futures. In general it works best with 1h, however it can be optimized with other timeframes as well.
Components:
VWAP
MACD histogram
EMA 9
Rules for entry
Long :
For VWAP: close is above the vwap daily
EMA: close is above the moving average
MACD histogram is above 0
Short:
For VWAP: close is belowthe vwap daily
EMA: close is below the moving average
MACD histogram is below 0
Rules for exit
This strategy does not have any risk management inside. Instead it exits whenver it receives an opposite signal form the original one used for entry.
If you have any questions let me know !
Smoothed SuperTrend with VWAP Confirmation [CHE] Smoothed SuperTrend with Automated Optimization and VWAP Confirmation
Overview
The "Smoothed SuperTrend with VWAP Confirmation" is an advanced technical analysis indicator designed for precise trend identification and trading signal generation. This script integrates a smoothed version of the popular SuperTrend indicator with an additional layer of confirmation using the Volume-Weighted Average Price (VWAP). The combination of these two elements offers traders a powerful tool for identifying optimal entry and exit points in the market.
Key Features
1. Smoothed SuperTrend
- Super Smoother Algorithm: The SuperTrend in this script is not just a regular one; it is enhanced by the Super Smoother filter, which reduces market noise and provides more reliable trend signals.
- Customizable Parameters: Traders can adjust three different sets of SuperTrend parameters (factor and ATR length), allowing them to tailor the indicator to their specific trading strategies.
- Automatic Optimization: The script automatically evaluates the performance of each SuperTrend parameter set and selects the one with the best cumulative performance. This selection process can be set to pick either the best or the worst performing parameter set, depending on the trader's preference.
2. VWAP Confirmation
- Precise Trend Confirmation: Once the best-performing SuperTrend is identified, the script further refines the signals by using VWAP as a confirmation tool. VWAP is a highly respected indicator in the trading community, often used to assess the true average price of an asset.
- Long and Short Signal Generation: The script generates Long and Short signals only when the price action is confirmed by both the SuperTrend and VWAP. For a Long signal, the price must be above the VWAP, and for a Short signal, it must be below the VWAP. This dual confirmation ensures higher accuracy and reduces the likelihood of false signals.
3. Visual and Informative Labels
- Signal Labels: Upon confirmation of a trend reversal by both the SuperTrend and VWAP, the script plots clear labels on the chart, indicating confirmed Long or Short signals. These labels are customizable in terms of color, text, and size, ensuring they fit seamlessly into any chart setup.
- Best Parameters Display: At the close of the most recent bar, the script displays a label that provides detailed information about the best-performing SuperTrend parameters and their cumulative performance. This feature keeps traders informed about which settings are currently most effective.
Input Customization Options
1. Super Smoother Length
- Traders can define the length of the Super Smoother filter, which is used to smooth both price data and ATR (Average True Range) values. This input allows traders to control the sensitivity of the indicator, with shorter lengths providing faster responses and longer lengths offering smoother trends.
2. SuperTrend Parameters
- Factor: For each of the three SuperTrends, traders can set a unique factor that determines the distance of the SuperTrend bands from the average price. A higher factor results in wider bands and fewer signals, while a lower factor results in narrower bands and more signals.
- ATR Length: Traders can also specify the length of the ATR used in each SuperTrend calculation. A longer ATR period captures broader market volatility, while a shorter period focuses on more immediate price movements.
3. Label Settings
- Label Colors: The script allows full customization of label colors for Long and Short signals, ensuring that they match the trader’s chart aesthetics.
- Label Text Colors and Sizes: Traders can adjust the text color and size of the labels for Long, Short, and information labels, allowing them to prioritize visibility and readability on their charts.
4. Performance Selection Mode
- Best or Worst Performer: This input allows traders to select whether the script should optimize for the best or worst performing SuperTrend parameter set. This flexibility is useful in different market conditions, where a trader might want to analyze either the strongest trend or focus on a contrarian strategy.
5. VWAP Calculation
- The script automatically recalculates the VWAP based on trend changes, ensuring that the confirmation signals are as accurate and relevant as possible to the current market context.
Important Note
This script is designed to provide more accurate trend signals and confirmations, but like all technical indicators, it should not be used in isolation. It is recommended to use this tool as part of a broader trading strategy, including proper risk management and consideration of fundamental market conditions.
Conclusion
The "Smoothed SuperTrend with VWAP Confirmation" script is an innovative trading tool that combines the strengths of the SuperTrend and VWAP indicators. By integrating smoothing techniques and automatic parameter optimization, this indicator provides traders with more accurate and reliable trend signals. The added confirmation by VWAP further enhances the precision of the entry and exit points, making it an excellent choice for traders looking to improve their technical analysis and trading outcomes. This tool is especially valuable for those who prefer customizable inputs and a systematic approach to trading, ensuring that the indicator adapts to various market conditions and individual trading styles.
Best regards
Chervolino
True Moving VWAPHaven't found any moving VWAPs that calculate correctly (were weighted by time rather than volume) - this is correctly weighted VWAP.
EMA and VWAP by Phil VoEMA and VWAP by Phil Vo
Description
This indicator combines two powerful technical analysis tools: Exponential Moving Averages (EMAs) and Volume Weighted Average Price (VWAP). Designed to assist traders in identifying trends and key price levels, this script overlays two customizable EMAs and a daily VWAP on your chart.
* EMA 1 (Blue): A fast-moving EMA with a default period of 9, ideal for short-term trend analysis.
* EMA 2 (Red): A slower EMA with a default period of 21, useful for confirming longer-term trends.
* VWAP (Yellow): The Volume Weighted Average Price, calculated using the typical price (HLC3) and volume, resetting daily. It serves as a dynamic support/resistance level and reflects the average price weighted by volume.
Features
* Customizable EMAs: Adjust the periods of both EMAs via the settings (minimum period: 1).
* Visual Clarity: Each line is plotted in a distinct color (Blue for EMA 1, Red for EMA 2, Yellow for VWAP) with a linewidth of 2 for easy identification.
* Daily VWAP: The VWAP resets at the start of each trading day, providing a reliable intraday reference point.
* Tooltips: Hover over the input settings to see descriptions of each EMA period.
How to Use
1. Add the indicator to your chart.
2. Customize the EMA periods in the settings if desired (defaults are 9 and 21).
3. Use the EMAs to spot trends:
* When EMA 1 crosses above EMA 2, it may signal a bullish trend.
* When EMA 1 crosses below EMA 2, it may indicate a bearish trend.
4. Use the VWAP as a dynamic support/resistance level:
* Prices above VWAP might suggest bullish momentum.
* Prices below VWAP might indicate bearish pressure.
Settings
* EMA 1 Length: Set the period for the fast EMA (default: 9).
* EMA 2 Length: Set the period for the slow EMA (default: 21).
Notes
* The VWAP resets daily by default, making it most suitable for intraday trading.
* This script is open-source under the Mozilla Public License 2.0, so feel free to study or modify it!
Author
Created by Phil Vo. Happy trading!
How to Add This to TradingView
When you publish the script:
1. Paste the description above into the "Description" field in the "Publish Script" dialog.
2. Set the title as "EMA and VWAP by Phil Vo".
3. Choose "Public" visibility and "Open" access to share it with the community.
4. Add tags like "EMA", "VWAP", "Moving Average", "Trend", and "Volume" to help users find it.
This description provides a clear explanation of the indicator’s purpose, usage instructions, and customization options, making it accessible and helpful for TradingView users. Let me know if you’d like to adjust anything!
EMA with VWAPThis indicator combines two popular technical analysis tools: the Exponential Moving Average (EMA) and the Volume Weighted Average Price (VWAP), into a single, powerful overlay on your chart. It allows you to analyze both trend direction using the EMA and institutional interest and fair value using the VWAP, all while saving valuable indicator slots on your TradingView layout.
Key Features:
- Exponential Moving Average (EMA):
- Calculates the EMA based on a user-defined Length and Source (e.g., close, open, hl2).
- Includes an optional Offset to shift the EMA line forward or backward on the chart.
- Offers a Smoothing Line feature, allowing you to further smooth the EMA using various moving average types (SMA, EMA, SMMA (RMA), WMA, VWMA) with a customizable Smoothing Length.
- EMA and Smoothing Line can be toggled on or off.
- EMA and Smoothing Line have independent offset capabilities.
Volume Weighted Average Price (VWAP):
-Calculates the VWAP, a crucial indicator that reflects the average price weighted by volume.
- Offers a wide range of Anchor Periods for resetting the VWAP calculation, including: Session, Week, Month, Quarter, Year, Decade, Century, Earnings, Dividends, and Splits.
- Includes an optional Offset to shift the VWAP line.
- Option to Hide VWAP on 1D or Above timeframes to focus on intraday analysis.
- Provides up to three customizable Standard Deviation Bands above and below the VWAP, visually representing volatility and potential support/resistance levels.
- Bands can be calculated using either "Standard Deviation" or "Percentage" methods.
- Bands can be turned on or off independently.
How to Use:
- EMA: Use the EMA to identify the overall trend direction. An upward-sloping EMA suggests an uptrend, while a downward-sloping EMA suggests a downtrend. The Smoothing Line can help confirm the EMA's trend.
- VWAP: The VWAP acts as a benchmark for the "fair" price of an asset during the selected anchor period. Prices above the VWAP may indicate bullish sentiment, while prices below may indicate bearish sentiment.
- Bands: The Standard Deviation Bands can help identify potential overbought and oversold conditions. Price reaching the upper bands might suggest overbought levels, while price reaching the lower bands might suggest oversold levels.
Customization:
- The indicator offers extensive customization through its settings:
- EMA Settings: Adjust the EMA length, source, offset, smoothing method, and smoothing length.
- VWAP Settings: Choose the VWAP anchor period, source, offset, and whether to hide it on daily or higher timeframes.
- VWAP Bands Settings: Control the visibility, multiplier, and calculation method for each of the three standard deviation bands.
Benefits:
- Consolidated Analysis: Combines two essential indicators into one, providing a comprehensive view of price action and volume.
- Saves Indicator Slots: Frees up valuable indicator slots on your TradingView chart.
- Highly Customizable: Offers a wide range of settings to tailor the indicator to your specific trading style and preferences.
- Visual Clarity: Clearly displays the EMA, VWAP, and optional bands on the chart, facilitating quick and easy analysis.
This combined EMA and VWAP indicator is a valuable tool for traders of all levels, offering a powerful and flexible way to analyze market trends and identify potential trading opportunities.
Rolling VWAP with Optional Kalman FilterThis script provides an advanced and customizable Rolling VWAP (Volume-Weighted Average Price) indicator, designed for traders who want to refine their trend analysis and improve decision-making. With a unique option to apply a Kalman Filter, you can smooth out VWAP values to reduce noise in volatile markets, making it easier to identify actionable trends.
Key Features:
Dynamic Rolling VWAP:
Choose the rolling window size (number of bars) to match your trading style, whether you’re an intraday scalper or a swing trader.
Kalman Filter Toggle:
Enable the Kalman filter to smooth VWAP values and eliminate market noise.
Adjustable Kalman Gain to control the level of smoothing, making it suitable for both fast and slow markets.
Price Source Flexibility:
Use the Typical Price ((H+L+C)/3) or the Close Price as the basis for VWAP calculation.
Visual Enhancements:
Background shading highlights whether the price is above (bullish) or below (bearish) the VWAP, helping traders make quick visual assessments.
A legend dynamically updates the current VWAP value.
Dual View Option:
Compare the raw Rolling VWAP and the Kalman-filtered VWAP when the filter is enabled, giving you deeper insight into market trends.
Use Cases:
Intraday Traders: Identify key price levels for re-entry or exits using a short rolling window and responsive filtering.
Swing Traders: Analyze broader trends with a longer rolling window and smoother VWAP output.
Volatile Markets: Use the Kalman filter to reduce noise and avoid false signals during high market volatility.
How to Use:
Adjust the Rolling Window to set the number of bars for VWAP calculation.
Toggle Kalman Filter on/off depending on your preference for raw or smoothed VWAP values.
Fine-tune the Kalman Gain for the desired level of smoothing.
Use the shading to quickly assess whether the price is trading above or below the VWAP for potential entry/exit signals.
Eze Profit - VWAP + MACD Combined SignalThe Eze Profit - VWAP + MACD Combined Signal is an advanced trading tool designed to help traders align price trends with momentum confirmation for better decision-making. By combining Volume-Weighted Average Price (VWAP) and Moving Average Convergence Divergence (MACD), this indicator provides clear entry and exit signals, allowing traders to follow trends and take advantage of momentum shifts.
How It Works:
VWAP:
VWAP represents the average price of an asset, weighted by volume, over a specific period.
It acts as a dynamic support/resistance level and trend filter. Price above VWAP indicates bullish conditions, while price below VWAP suggests bearish conditions.
MACD:
MACD measures momentum through the difference between fast and slow exponential moving averages (EMAs).
Signals are generated when the MACD line crosses its signal line:
Bullish Crossover: Indicates increasing upward momentum.
Bearish Crossunder: Indicates increasing downward momentum.
Combined Logic:
Long Signal: Triggered when price is above VWAP, and MACD exhibits a bullish crossover.
Short Signal: Triggered when price is below VWAP, and MACD exhibits a bearish crossunder.
The script tracks the trader's "in-position" state to prevent redundant signals and ensure clarity.
How to Use:
Use this script to identify potential long and short trading opportunities:
Buy Signal: Enter a long position when the price moves above VWAP and MACD confirms bullish momentum.
Sell Signal: Exit or short when the price drops below VWAP and MACD confirms bearish momentum.
Combine with additional tools like support/resistance, volume analysis, or candlestick patterns for confirmation.
Features:
VWAP Trend Filter: Dynamically adjusts to the trading session to identify overall trend direction.
MACD Momentum Confirmation: Detects key momentum shifts with configurable settings for fast, slow, and signal lengths.
Position State Tracking: Avoids signal redundancy by monitoring open positions.
Buy/Sell Visualizations: Plots Buy/Sell signals directly on the chart for ease of use.
Alerts: Notifies traders in real-time when a long or short signal is triggered.
Customizable Settings:
MACD Fast Length, Slow Length, and Signal Smoothing parameters.
VWAP timeframe resolution to adapt to different trading styles (e.g., intraday or daily).
Credits:
This script is based on standard VWAP and MACD calculations provided by TradingView’s library and has been enhanced with unique logic for combined signal generation.
Notes:
This indicator is intended for educational purposes and should not be considered financial advice. Use it as part of a broader trading strategy alongside other tools for optimal results.
TrendWave EMA/VWAP IndicatorThe TrendWave EMA/VWAP Indicator is a powerful technical analysis tool designed for traders seeking to enhance their market strategies. By combining the dynamic Exponential Moving Average (EMA) and the Volume Weighted Average Price (VWAP), this indicator provides valuable insights into price trends and potential trading signals, allowing for informed decision-making in various market conditions.
Key Features:
Exponential Moving Average (EMA):
The EMA component helps traders identify the direction of the prevailing trend by giving more weight to recent price action. This responsiveness makes the EMA an essential tool for trend-following strategies.
Customizable Length: Users can adjust the EMA length (default set to 50 periods) to align with their specific trading style and preferences.
Volume Weighted Average Price (VWAP):
The VWAP is crucial for evaluating the average price of a security throughout the trading day, factoring in volume. It serves as a benchmark for price action and can help traders identify significant support and resistance levels.
Real-time Benchmarking: The VWAP enables traders to assess current prices against historical averages, improving their entry and exit strategies.
Signal Generation:
The TrendWave EMA/VWAP Indicator generates clear buy and sell signals based on the interaction between the price and the VWAP:
Bullish Signal: Triggered when the price crosses above the VWAP, indicating a potential upward movement.
Bearish Signal: Triggered when the price crosses below the VWAP, suggesting a potential downward movement.
These signals are visually represented with intuitive arrows on the chart, facilitating quick recognition of trading opportunities.
User-Friendly Interface:
The indicator allows traders to enable or disable components (EMA and VWAP) based on their preferences, ensuring a personalized trading experience.
Clear color coding enhances visual clarity: the EMA is displayed in blue, while the VWAP is shown in orange.
Use Cases:
Trend Following: Use the EMA to confirm the direction of the trend and make trades that align with that trend.
Price Action Analysis: Employ the VWAP to determine the average trading price and identify key support/resistance levels.
Signal Confirmation: Combine signals from both the EMA and VWAP to enhance trading strategies and decision-making.
The TrendWave EMA/VWAP Indicator is an essential addition to any trader's toolkit. By leveraging the strengths of both the EMA and VWAP, this indicator empowers traders to make informed, data-driven decisions and capitalize on market movements with confidence.
Rolling VWAPGuide for Traders
What is the Rolling VWAP?
The Volume Weighted Average Price (VWAP) is a key indicator used by traders to assess the average price of an asset, weighted by volume over a specified period. Unlike a simple moving average, the VWAP accounts for trading volume, making it a more accurate reflection of price action and market sentiment.
The Rolling VWAP in this script dynamically updates based on a user-defined period, allowing traders to view the average price over a chosen number of bars. This is particularly useful for identifying trends and potential entry or exit points in the market.
Key Benefits of Using Rolling VWAP
Better Market Insight: VWAP provides insight into where most trading is occurring, helping you gauge the strength of a price move.
Support and Resistance Levels: It often acts as dynamic support or resistance, signaling areas where price might reverse.
Trend Confirmation: A rising VWAP suggests a bullish trend, while a falling VWAP indicates a bearish trend.
Informed Entry/Exit Decisions: Use the VWAP to find entry points below it in an uptrend or exit points above it in a downtrend.
How to Use this Script:
Custom Period Input:
You can modify the "VWAP Period" to adjust the number of bars considered in the rolling calculation.
The default period is 14 bars, but you can set it based on your strategy (e.g., shorter for intraday trading, longer for swing trading).
Chart Interpretation
Bullish Signals: When the price is above the VWAP line, it suggests upward momentum, and you may consider buying opportunities.
Bearish Signals: When the price is below the VWAP, it indicates downward momentum, and you may consider selling or shorting opportunities.
Reversion to VWAP: Prices often revert to the VWAP after extended moves away from it, offering potential trade setups.
Combine with Other Indicators:
Momentum Indicators: Use with RSI, MACD, or moving averages for confirmation.
Volume Analysis: VWAP works well when combined with volume indicators to assess if a breakout is supported by high trading volume.
Customization:
Traders can customize the script's period and plot color to fit their charting preferences.
Practical Tips:
Intraday Traders: Use shorter periods (e.g., 5 or 10) to capture VWAP trends in fast-moving markets.
Swing Traders: Use longer periods (e.g., 50 or 100) to assess longer-term price and volume trends.
By integrating this Rolling VWAP into your strategy, you can better understand where the majority of trading volume has occurred, allowing you to make more informed decisions in your trading process.
F.B_Volume Weighted Average Price MTFThe F.B_Volume Weighted Average Price MTF (VWAP MTF) indicator calculates the volume-weighted average price of a security across different timeframes. The VWAP is a powerful indicator used by both institutional and retail traders to make better trading decisions.
Functionality:
Timeframe:
The indicator allows you to adjust the timeframe for the VWAP calculation via the settings. By default, the timeframe is set to weekly ("W").
Restart at new timeframe:
At each new period in the chosen timeframe, the VWAP calculations are reset, and a new VWAP is calculated.
VWAP Calculation:
The VWAP is calculated by the volume-weighted average of the typical prices (High, Low, and Close) of the security. This calculation takes into account the volume of each transaction to provide an accurate average price.
Visualization:
The VWAP is displayed as a line on the chart, and the color of the line changes depending on the price position relative to the VWAP:
Green: The current closing price is above the VWAP (bullish signal).
Red: The current closing price is below the VWAP (bearish signal).
Options:
Show barcolors:
This option allows you to display the colors of the candles based on their position relative to the VWAP (green for bullish, red for bearish).
Show previous VWAP close:
This option shows the closing value of the VWAP from the previous period to provide historical reference points.
Interpretation:
Bullish Signal:
If the current price is above the VWAP, this indicates that the market trend is upward, which could be considered a buying opportunity.
Bearish Signal:
If the current price is below the VWAP, this indicates that the market trend is downward, which could be considered a selling signal.
LUX CLARA - EMA + VWAP (No ATR Filter) - v6EMA STRAT SHOUT OUTOUTLIERSSSSS
Overview:
an intraday strategy built around two core principles:
Trend Confirmation using the 50 EMA (Exponential Moving Average) in relation to the VWAP (Volume-Weighted Average Price).
Entry Signals triggered by the 8 EMA crossing the 50 EMA in the direction of that confirmed trend.
Key Logic:
Bullish Trend if the 50 EMA is above VWAP. Only long entries are allowed when the 8 EMA crosses above the 50 EMA during that bullish phase.
Bearish Trend if the 50 EMA is below VWAP. Only short entries are allowed when the 8 EMA crosses below the 50 EMA during that bearish phase.
Intraday Focus: Trades are restricted to a user-defined session window (default 7:30 AM–11:30 AM), aligning entries/exits with peak intraday liquidity.
Exit Rule: Positions close automatically when the 8 EMA crosses back in the opposite direction of the entry.
Why It Works:
EMA + VWAP helps detect both immediate momentum (EMAs) and overall institutional bias (VWAP).
By confining trades to a set intraday window, the strategy aims to capture morning volatility while avoiding choppy afternoon or overnight sessions.
Customization:
Users can adjust EMA lengths, session times, or incorporate stops/targets for additional risk management.
It can be tested on various symbols and intraday timeframes to gauge performance and robustness.
MACD Crossover Breakout Rays with VWAP & Breakout ConfirmationOverview
This script is designed to highlight potential strong breakout moves by combining MACD crossovers, VWAP confirmation, and price action breakouts. It helps traders identify momentum shifts and filter high-probability trade setups.
How It Works
1. MACD Crossover Detection
- The script detects bullish crossovers (MACD line crossing above the signal line) and bearish crossovers (MACD line crossing below the signal line).
- A horizontal ray is drawn at the high (bullish) or low (bearish) of the crossover candle.
2. Multi-Timeframe MACD Confirmation
- A secondary MACD crossover is checked on a lower timeframe (default: 5 minutes) to confirm the strength of the move.
- The script ensures alignment between the primary and lower timeframe MACD crossovers before signaling a strong move.
3. VWAP Confirmation
- A bullish breakout is valid only if the price is above the VWAP.
- A bearish breakout is valid only if the price is below the VWAP.
4. Breakout Validation
- The script waits for price action confirmation—a breakout is only valid when a candle closes above (bullish) or below (bearish) the horizontal ray.
- Once confirmed, the ray color changes to blue to signal a strong move.
5. Label Alerts for Strong Moves
- When all conditions align, the script prints "STRONG 💪 MOVE" above or below the breakout candle.
- The previous label is automatically removed to keep the chart clean.
Customization Options
- MACD Settings: Adjust fast/slow lengths and signal smoothing.
- Lower Timeframe Confirmation: Choose a different timeframe for multi-timeframe MACD validation.
- VWAP Filtering: Ensure breakouts align with volume-weighted trends.
- Ray Length & Colors: Customize the horizontal ray length, width, and colors.
- Breakout Confirmation Window: Adjust how many bars to check for MACD alignment.
Best Use Cases
✅ Identifying high-probability breakouts with trend confirmation.
✅ Filtering out false signals by requiring multi-timeframe agreement.
✅ Helping traders stay in momentum-driven moves with strong confirmation.
⚠ Note: This script is for educational purposes only and does not constitute financial advice. Always conduct your own analysis before making trading decisions.
Smartos VWAPSmartos VWAP Indicator Description
Smartos VWAP is a versatile and customizable technical analysis tool designed for traders and analysts to gauge the average price of a security based on its trading volume. The indicator calculates the Volume Weighted Average Price (VWAP) over six different customizable periods, allowing users to adapt the analysis to their trading strategies.
Key Features:
Volume Weighted Average Price (VWAP): The Smartos VWAP provides a dynamic measure of the average price at which a security has traded throughout the day, weighted by volume. This makes it a useful reference point for assessing price levels.
Customizable Periods: The indicator allows users to set six different candle lengths for VWAP calculations, with default values of 21, 48, 84, 175, 480, and 840 candles. Users can easily modify these values to suit their trading preferences.
Multiple VWAP Lines: The indicator plots six distinct VWAP lines on the chart, each representing a different period. This enables traders to observe price action relative to multiple VWAPs, helping identify trends and potential support and resistance levels.
Visual Clarity: Each VWAP line is color-coded for easy differentiation, making it simple for traders to analyze price movements and the relationship between the current price and the average price over the selected periods.
Usage:
Traders can use the Smartos VWAP indicator to make informed decisions regarding entry and exit points, as well as to assess overall market sentiment. By observing the position of the price relative to the VWAP lines, traders can gain insights into potential bullish or bearish trends.
Push and Exhaustion Strategy with VWAP and Moving AveragesOverview:
The Push and Exhaustion Strategy Indicator is a custom technical analysis tool designed to help traders identify potential market turning points by highlighting significant price movements (pushes) and subsequent periods of reduced momentum (exhaustion). This indicator also incorporates key moving averages (50-period and 200-period) and the Volume Weighted Average Price (VWAP) to provide additional context for trading decisions.
Components:
Push and Exhaustion Thresholds:
Push Threshold: Set at 1.5 by default. This means the price must increase by 50% or more compared to the previous close to signal a push.
Exhaustion Threshold: Set at 0.7 by default. This means the price must decrease by 30% or more compared to the previous close to signal exhaustion.
VWAP (Volume Weighted Average Price):
VWAP is plotted on the chart to provide an average price weighted by volume, giving insight into the true average price paid for an asset.
Moving Averages:
50-period Moving Average (MA): Plotted in blue, it helps identify the short-to-mid-term trend direction.
200-period Moving Average (MA): Plotted in orange, it helps identify the long-term trend direction.
How It Works:
Push Condition:
A push signal is generated when the current closing price is at least 1.5 times the previous closing price (pushThreshold).
Additionally, the closing price must be above the VWAP, indicating strong upward momentum.
When these conditions are met, a green triangle is plotted above the price bar.
Exhaustion Condition:
An exhaustion signal is generated when the current closing price is at most 0.7 times the previous closing price (exhaustionThreshold).
Additionally, the closing price must be below the VWAP, indicating weakened momentum and potential reversal.
When these conditions are met, a red triangle is plotted below the price bar.
Visualization:
The indicator plots green triangles above bars to indicate a push signal and red triangles below bars to indicate an exhaustion signal.
It also plots the 50-period and 200-period moving averages as blue and orange lines, respectively.
The VWAP is plotted as a purple line, showing the average price considering the trading volume.
Alerts:
The indicator includes optional alerts that notify the trader when a push or exhaustion signal is detected.
Usage:
Push Signals: Traders might use push signals to enter trades in the direction of strong momentum, typically buying in an uptrend.
Exhaustion Signals: Traders might use exhaustion signals to anticipate potential reversals, considering exiting positions or entering counter-trend trades.
Moving Averages: The 50-period and 200-period moving averages help provide context to the overall trend, aiding in decision-making.
VWAP: Being above or below the VWAP helps validate the strength of the price movement.
This indicator provides a comprehensive view of market momentum, aiding traders in making informed decisions by highlighting significant price moves and potential reversals within the context of prevailing trends.
Zigzag Tails [Trendoscope®] 🎲 Introducing Zigzag Tails Indicator by Trendoscope.
The Zigzag Tails Indicator, a groundbreaking tool from Trendoscope, redefines technical analysis by seamlessly integrating anchored VWAPs (Volume Weighted Average Prices) and Average Price calculations with Zigzag pivot points. This advanced indicator recalculates Average Price or VWAP from one Zigzag pivot to the next, offering unparalleled insights into market movements.
🎯 Innovative Design
Each Zigzag pivot can feature up to three distinct tails, corresponding to the high, low, and close prices of each candle. Users have the flexibility to select between Average Price and VWAP for display on their charts. By default, the indicator plots all three tails, but individual tail visibility is customizable via the settings panel.
Average Price Mode: When selected, tails depict the average price across a specified number of bars.
VWAP Mode: In this mode, tails represent the VWAP, calculated for a given price over a set number of bars.
🎯 Dynamic Dotted Tail
The Zigzag Tails Indicator features dotted tails that extend from the last Zigzag pivot to the current bar. These dotted tails dynamically adapt to market changes and are subject to repainting with the emergence of new Zigzag pivots.
When repainting is enabled, the dotted tails originate from the last unconfirmed Zigzag pivot, extending to the current bar. This setting offers a more immediate, albeit tentative, visual representation of market trends.
With repainting disabled, the dotted tails will be anchored from the last confirmed Zigzag pivot to the current bar, providing a more stable but slightly delayed market analysis.
Irrespective of the repaint option, the dotted dynamic tails is always expected to repaint.
🎯 Practical Applications
The Zigzag Tails Indicator provides more accurate support and resistance levels than traditional VWAP, rolling VWAP, or moving averages. Its precision makes it an invaluable tool for identifying trends, as well as potential trend continuations or reversals.
🛠 Indicator Settings
Zigzag Configuration:
Zigzag Length determines the loopback length for the foundational Zigzag calculation.
Number of Bars represent the calculation distance. This limitation is added to avoid runtime errors on lower timeframes. The calculations run through lots of loops. Hence, if it is run across too many bars, we may get timeout issues.
Repaint: Activating this will also display the last, unconfirmed Zigzag pivot. Since the last pivot is inherently tentative, it may repaint with the arrival of new bars. A pivot is confirmed only when a subsequent unconfirmed pivot emerges on the chart.
Tail Configuration
Tail Type: Choose between average and VWAP for the tail calculation. The average option plots a simple average, while the VWAP option calculates an anchored VWAP from pivot to pivot.
Display Options: Tailored display options for High, Low, Close prices, with customizable colors for each tail type.
Inspired by the ideas of @KioseffTrading's implementation of Zigzag Anchored VWAP
Liquid Pulse Liquid Pulse by Dskyz (DAFE) Trading Systems
Liquid Pulse is a trading algo built by Dskyz (DAFE) Trading Systems for futures markets like NQ1!, designed to snag high-probability trades with tight risk control. it fuses a confluence system—VWAP, MACD, ADX, volume, and liquidity sweeps—with a trade scoring setup, daily limits, and VIX pauses to dodge wild volatility. visuals include simple signals, VWAP bands, and a dashboard with stats.
Core Components for Liquid Pulse
Volume Sensitivity (volumeSensitivity) controls how much volume spikes matter for entries. options: 'Low', 'Medium', 'High' default: 'High' (catches small spikes, good for active markets) tweak it: 'Low' for calm markets, 'High' for chaos.
MACD Speed (macdSpeed) sets the MACD’s pace for momentum. options: 'Fast', 'Medium', 'Slow' default: 'Medium' (solid balance) tweak it: 'Fast' for scalping, 'Slow' for swings.
Daily Trade Limit (dailyTradeLimit) caps trades per day to keep risk in check. range: 1 to 30 default: 20 tweak it: 5-10 for safety, 20-30 for action.
Number of Contracts (numContracts) sets position size. range: 1 to 20 default: 4 tweak it: up for big accounts, down for small.
VIX Pause Level (vixPauseLevel) stops trading if VIX gets too hot. range: 10 to 80 default: 39.0 tweak it: 30 to avoid volatility, 50 to ride it.
Min Confluence Conditions (minConditions) sets how many signals must align. range: 1 to 5 default: 2 tweak it: 3-4 for strict, 1-2 for more trades.
Min Trade Score (Longs/Shorts) (minTradeScoreLongs/minTradeScoreShorts) filters trade quality. longs range: 0 to 100 default: 73 shorts range: 0 to 100 default: 75 tweak it: 80-90 for quality, 60-70 for volume.
Liquidity Sweep Strength (sweepStrength) gauges breakouts. range: 0.1 to 1.0 default: 0.5 tweak it: 0.7-1.0 for strong moves, 0.3-0.5 for small.
ADX Trend Threshold (adxTrendThreshold) confirms trends. range: 10 to 100 default: 41 tweak it: 40-50 for trends, 30-35 for weak ones.
ADX Chop Threshold (adxChopThreshold) avoids chop. range: 5 to 50 default: 20 tweak it: 15-20 to dodge chop, 25-30 to loosen.
VWAP Timeframe (vwapTimeframe) sets VWAP period. options: '15', '30', '60', '240', 'D' default: '60' (1-hour) tweak it: 60 for day, 240 for swing, D for long.
Take Profit Ticks (Longs/Shorts) (takeProfitTicksLongs/takeProfitTicksShorts) sets profit targets. longs range: 5 to 100 default: 25.0 shorts range: 5 to 100 default: 20.0 tweak it: 30-50 for trends, 10-20 for chop.
Max Profit Ticks (maxProfitTicks) caps max gain. range: 10 to 200 default: 60.0 tweak it: 80-100 for big moves, 40-60 for tight.
Min Profit Ticks to Trail (minProfitTicksTrail) triggers trailing. range: 1 to 50 default: 7.0 tweak it: 10-15 for big gains, 5-7 for quick locks.
Trailing Stop Ticks (trailTicks) sets trail distance. range: 1 to 50 default: 5.0 tweak it: 8-10 for room, 3-5 for fast locks.
Trailing Offset Ticks (trailOffsetTicks) sets trail offset. range: 1 to 20 default: 2.0 tweak it: 1-2 for tight, 5-10 for loose.
ATR Period (atrPeriod) measures volatility. range: 5 to 50 default: 9 tweak it: 14-20 for smooth, 5-9 for reactive.
Hardcoded Settings volLookback: 30 ('Low'), 20 ('Medium'), 11 ('High') volThreshold: 1.5 ('Low'), 1.8 ('Medium'), 2 ('High') swingLen: 5
Execution Logic Overview trades trigger when confluence conditions align, entering long or short with set position sizes. exits use dynamic take-profits, trailing stops after a profit threshold, hard stops via ATR, and a time stop after 100 bars.
Features Multi-Signal Confluence: needs VWAP, MACD, volume, sweeps, and ADX to line up.
Risk Control: ATR-based stops (capped 15 ticks), take-profits (scaled by volatility), and trails.
Market Filters: VIX pause, ADX trend/chop checks, volatility gates. Dashboard: shows scores, VIX, ADX, P/L, win %, streak.
Visuals Simple signals (green up triangles for longs, red down for shorts) and VWAP bands with glow. info table (bottom right) with MACD momentum. dashboard (top right) with stats.
Chart and Backtest:
NQ1! futures, 5-minute chart. works best in trending, volatile conditions. tweak inputs for other markets—test thoroughly.
Backtesting: NQ1! Frame: Jan 19, 2025, 09:00 — May 02, 2025, 16:00 Slippage: 3 Commission: $4.60
Fee Typical Range (per side, per contract)
CME Exchange $1.14 – $1.20
Clearing $0.10 – $0.30
NFA Regulatory $0.02
Firm/Broker Commis. $0.25 – $0.80 (retail prop)
TOTAL $1.60 – $2.30 per side
Round Turn: (enter+exit) = $3.20 – $4.60 per contract
Disclaimer this is for education only. past results don’t predict future wins. trading’s risky—only use money you can lose. backtest and validate before going live. (expect moderators to nitpick some random chart symbol rule—i’ll fix and repost if they pull it.)
About the Author Dskyz (DAFE) Trading Systems crafts killer trading algos. Liquid Pulse is pure research and grit, built for smart, bold trading. Use it with discipline. Use it with clarity. Trade smarter. I’ll keep dropping badass strategies ‘til i build a brand or someone signs me up.
2025 Created by Dskyz, powered by DAFE Trading Systems. Trade smart, trade bold.
Scalper's Fractal Cloud with RSI + VWAP + MACD (Fixed)Scalper’s Fractal Confluence Dashboard
1. Purpose of the Indicator
This TradingView indicator script provides a high-confluence setup for scalping and day trading. It blends momentum indicators (RSI, MACD), trend bias tools (EMA Cloud, VWAP), and structure (fractal swings, gap zones) to help confirm precise entries and exits.
2. Components of the Indicator
- EMA Cloud (50 & 200 EMA): Trend bias – green means bullish, red means bearish. Avoid longs under red cloud.
- VWAP: Institutional volume anchor. Ideal entries are pullbacks to VWAP in direction of trend.
- Gap Zones: Shows open-air zones (white space) where price can move fast. Used to anticipate momentum moves.
- ZigZag Swings: Marks structural pivots (highs/lows) – useful for stop placement and range anticipation.
- MACD Histogram: Shows bullish or bearish momentum via background color.
- RSI: Overbought (>70) or oversold (<30) warnings. Good for exits or countertrend reversion plays.
- EMA Spread Label: Quick view of momentum strength. Wide spread = strong trend.
3. Scalping Entry Checklist
Before entering a trade, confirm these conditions:
• • Bias: EMA cloud color supports trade direction
• • Price is above/below VWAP (confirming institutional flow)
• • MACD histogram matches direction (green for long, red for short)
• • RSI not at extreme (unless you’re fading trend)
• • If entering gap zone, expect fast move
• • Recent swing high/low nearby for target or stop
4. Risk & Sizing Guidelines
Risk 1–2% of account per trade. Place stop below recent swing low (for longs) or high (for shorts). Use fractional sizing near VWAP or white space zones for scalping reversals.
5. Daily Trade Journal Template
- Date:
- Ticker:
- Setup Type (VWAP pullback, Gap Break, EMA reversion):
- Entry Time:
- Bias (Green/Red Cloud):
- RSI Level / MACD Reading:
- Stop Loss:
- Target:
- Result (P/L):
- What I Did Well:
- What Needs Work:
Moving Averages + BB & R.VWAP StDev (multi-tf)█ Moving Averages + Bollinger Bands and Rolling Volume Weighted Average Price with Standard Deviation Bands (Multi Timeframe)
Multiple moving averages can be independently applied.
The length , type and timeframe of each moving average are configurable .
The lines and colors are customizable too.
This script can display:
Moving Averages
Bollinger Bands
Rolling VWAP and Standard Deviation Bands
Types of Moving Averages:
Simple Moving Average (SMA)
Exponential Moving Average (EMA)
Smoothed Moving Average (SMMA)
Weighted Moving Average (WMA)
Volume Weighted Moving Average (VWMA)
Least Squares Moving Average (LSMA)
Hull Moving Average (HMA)
Arnaud Legoux Moving Average (ALMA)
█ Moving Average
Moving Averages are price based, lagging (or reactive) indicators that display the average price of a security over a set period of time.
A Moving Average is a good way to gauge momentum as well as to confirm trends, and define areas of support and resistance.
█ Bollinger Bands
Bollinger Bands consist of a band of three lines which are plotted in relation to security prices.
The line in the middle is usually a Simple Moving Average (SMA) set to a period of 20 days (the type of trend line and period can be changed by the trader, a 20 day moving average is by far the most popular).
The SMA then serves as a base for the Upper and Lower Bands which are used as a way to measure volatility by observing the relationship between the Bands and price.
█ Rolling VWAP
The typical VWAP is designed to be used on intraday charts, as it resets at the beginning of the day.
Such VWAPs cannot be used on daily, weekly or monthly charts. Instead, this rolling VWAP uses a time period that automatically adjusts to the chart's timeframe.
You can thus use the rolling VWAP on any chart that includes volume information in its data feed.
Because the rolling VWAP uses a moving window, it does not exhibit the jumpiness of VWAP plots that reset.
Based on the previous script :
MTF MA Ribbon and Bands + BB, Gaussian F. and R. VWAP with StDev█ Multi Timeframe Moving Average Ribbon and Bands + Bollinger Bands, Gaussian Filter and Rolling Volume Weighted Average Price with Standard Deviation Bands
Up to 9 moving averages can be independently applied.
The length , type and timeframe of each moving average are configurable .
The lines, colors and background fill are customizable too.
This script can also display:
Moving Average Bands
Bollinger Bands
Gaussian Filter
Rolling VWAP and Standard Deviation Bands
Types of Moving Averages:
Simple Moving Average (SMA)
Exponential Moving Average (EMA)
Smoothed Moving Average (SMMA)
Weighted Moving Average (WMA)
Volume Weighted Moving Average (VWMA)
Least Squares Moving Average (LSMA)
Hull Moving Average (HMA)
Arnaud Legoux Moving Average (ALMA)
█ Moving Average
Moving Averages are price based, lagging (or reactive) indicators that display the average price of a security over a set period of time.
A Moving Average is a good way to gauge momentum as well as to confirm trends, and define areas of support and resistance.
█ Bollinger Bands
Bollinger Bands consist of a band of three lines which are plotted in relation to security prices.
The line in the middle is usually a Simple Moving Average (SMA) set to a period of 20 days (the type of trend line and period can be changed by the trader, a 20 day moving average is by far the most popular).
The SMA then serves as a base for the Upper and Lower Bands which are used as a way to measure volatility by observing the relationship between the Bands and price.
█ Gaussian Filter
Gaussian filter can be used for smoothing.
It rejects high frequencies (fast movements) better than an EMA and has lower lag.
A Gaussian filter is one whose transfer response is described by the familiar Gaussian bell-shaped curve.
In the case of low-pass filters, only the upper half of the curve describes the filter.
The use of gaussian filters is a move toward achieving the dual goal of reducing lag and reducing the lag of high-frequency components relative to the lag of lower-frequency components.
█ Rolling VWAP
The typical VWAP is designed to be used on intraday charts, as it resets at the beginning of the day.
Such VWAPs cannot be used on daily, weekly or monthly charts. Instead, this rolling VWAP uses a time period that automatically adjusts to the chart's timeframe.
You can thus use the rolling VWAP on any chart that includes volume information in its data feed.
Because the rolling VWAP uses a moving window, it does not exhibit the jumpiness of VWAP plots that reset.
Made with the help from scripts of: adam24x, VishvaP, loxx and pmk07.
Rolling VWAP█ OVERVIEW
This indicator displays a Rolling Volume-Weighted Average Price. Contrary to VWAP indicators which reset at the beginning of a new time segment, RVWAP calculates using a moving window defined by a time period (not a simple number of bars), so it never resets.
█ CONCEPTS
If you are not already familiar with VWAP, our Help Center will get you started.
The typical VWAP is designed to be used on intraday charts, as it resets at the beginning of the day. Such VWAPs cannot be used on daily, weekly or monthly charts. Instead, this rolling VWAP uses a time period that automatically adjusts to the chart's timeframe. You can thus use RVWAP on any chart that includes volume information in its data feed.
Because RVWAP uses a moving window, it does not exhibit the jumpiness of VWAP plots that reset. You can see the more jagged VWAP on the chart above. We think both can be useful to traders; up to you to decide which flavor works for you.
█ HOW TO USE IT
Load the indicator on an active chart (see the Help Center if you don't know how).
Time period
By default, the script uses an auto-stepping mechanism to adjust the time period of its moving window to the chart's timeframe. The following table shows chart timeframes and the corresponding time period used by the script. When the chart's timeframe is less than or equal to the timeframe in the first column, the second column's time period is used to calculate RVWAP:
Chart Time
timeframe period
1min 🠆 1H
5min 🠆 4H
1H 🠆 1D
4H 🠆 3D
12H 🠆 1W
1D 🠆 1M
1W 🠆 3M
You can use the script's inputs to specify a fixed time period, which you can express in any combination of days, hours and minutes.
By default, the time period currently used is displayed in the lower-right corner of the chart. The script's inputs allow you to hide the display or change its size and location.
Minimum Window Size
This input field determines the minimum number of values to keep in the moving window, even if these values are outside the prescribed time period. This mitigates situations where a large time gap between two bars would cause the time window to be empty, which can occur in non-24x7 markets where large time gaps may separate contiguous chart bars, namely across holidays or trading sessions. For example, if you were using a 1D time period and there is a two-day gap between two bars, then no chart bars would fit in the moving window after the gap. The default value is 10 bars.
█ NOTES
If you are interested in VWAP indicators, you may find the VWAP Auto Anchored built-in indicator worth a try.
For Pine Script™ coders
The heart of this script's calculations uses the `totalForTimeWhen()` function from the ConditionalAverages library published by PineCoders . It works by maintaining an array of values included in a time period, but without a for loop requiring a lookback from the current bar, so it is much more efficient.
We write our Pine Script™ code using the recommendations in the User Manual's Style Guide .
Look first. Then leap.