"VOLUME BAR" için komut dosyalarını ara

Volume Color Bars with SMA MACD & Linear RegressionVolume Bars colored to make it easy to read with Volume Spread Analysis Indicator.
1. Red - Volume less than Simple Moving Average
2. Blue - Volume higher than Simple Moving Average
3. Black - Maximum volume of last Max_Count bar (default = 40 bars)
Additionally, you can plot Moving Average, Linear Regression and MACD of volume.

Volume BarsVolume Sato's Bar / Satos Bar / Raio X Preditivo
This is an experimental code based on Satos Bar by Raio X Preditivo
It's a way to check expressive volume in one bar, and it's can give you an idea of a important Zones to make decisions.
Example:

Volume Bars and Regions of InterestThe bars are colored according to the volume traded. The volume weights were distributed logically for a better analysis.
<0.666 low volume
0.666 to 1.333 median volume
1,333 to 2,666 high volume
> 2,666 'institutional' volume
The moving average bands are the average of the highs and lows. They show a region of interest and not just a 'line'.

Volume Bars - Shubhashish DixitThis helps you to identify volume based on your given period and it solves the issues which we are unable to see units in the main bar of Volume default chart

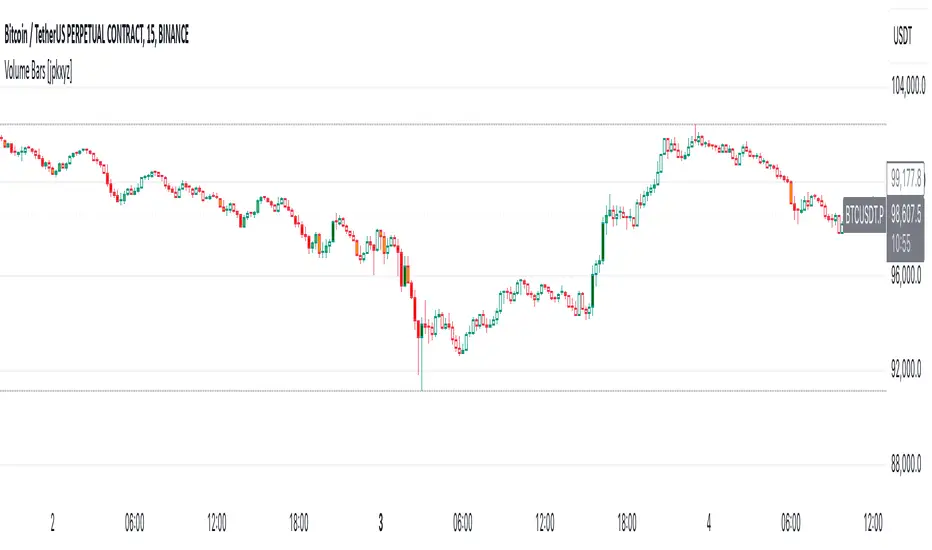
Volume Bars [jpkxyz]
Multi-Timeframe Volume indicator by @jpkxyz
This script is a Multi-Timeframe Volume Z-Score Indicator. It dynamically calculates /the Z-Score of volume over different timeframes to assess how significantly current
volume deviates from its historical average. The Z-Score is computed for each
timeframe independently and is based on a user-defined lookback period. The
script switches between timeframes automatically, adapting to the chart's current
timeframe using `timeframe.multiplier`.
The Z-Score formula used is: (current volume - mean) / standard deviation, where
mean and standard deviation are calculated over the lookback period.
The indicator highlights periods of "significant" and "massive" volume by comparing
the Z-Score to user-specified thresholds (`zScoreThreshold` for significant volume
and `massiveZScoreThreshold` for massive volume). The script flags buy or sell
conditions based on whether the current close is higher or lower than the open.
Visual cues:
- Dark Green for massive buy volume.
- Red for massive sell volume.
- Green for significant buy volume.
- Orange for significant sell volume.
- Gray for normal volume.
The script also provides customizable alert conditions for detecting significant or massive buy/sell volume events, allowing users to set real-time alerts.


ULTIMATE ORDER FLOW SYSTEM🔥 ULTIMATE ORDER FLOW SYSTEM
Overview
This comprehensive order flow analysis tool combines **Volume Profile**, **Cumulative Delta**, and **Large Order Detection** to identify high-probability trading setups. The script analyzes institutional order flow patterns and volume distribution to pinpoint key levels where price is likely to react.
📊 Core Components & Methodology
🔥 ULTIMATE ORDER FLOW SYSTEM
Overview
This comprehensive order flow analysis tool combines Volume Profile, Cumulative Delta, and Large Order Detection to identify high-probability trading setups. The script analyzes institutional order flow patterns and volume distribution to pinpoint key levels where price is likely to react.
________________________________________
📊 Core Components & Methodology
1. Volume Profile Analysis
The script constructs a horizontal volume profile by:
• Dividing the price range into configurable rows (default: 20)
• Accumulating volume at each price level over a lookback period (default: 50 bars)
• Separating buy volume (green bars close > open) from sell volume (red bars)
• Identifying three critical levels:
o POC (Point of Control): Price level with highest traded volume - acts as a strong magnet
o VAH/VAL (Value Area High/Low): Contains 70% of total volume - defines fair value zone
o HVN (High Volume Nodes): Resistance zones where institutions accumulated positions
o LVN (Low Volume Nodes): Thin zones that price moves through quickly - ideal targets
Why This Matters: Institutional traders leave footprints through volume. HVN zones show where large players defended levels, making them reliable support/resistance.
________________________________________
2. Cumulative Delta (Order Flow)
Tracks the running total of buying vs selling pressure:
• Bar Delta: Difference between buy and sell volume per candle
• Cumulative Delta: Sum of all bar deltas - shows net directional pressure
• Delta Moving Average: Smoothed delta (20-period) to identify trend
• Delta Divergences:
o Bullish: Price makes lower low, but delta makes higher low (absorption at bottom)
o Bearish: Price makes higher high, but delta makes lower high (exhaustion at top)
How It Works: When cumulative delta trends up while price consolidates, it signals accumulation. Delta divergences reveal when smart money is positioned opposite to retail expectations.
________________________________________
3. Large Order Detection
Identifies institutional-sized orders in real-time:
• Compares current bar volume to 20-period moving average
• Flags orders exceeding 2.5x average volume (configurable multiplier)
• Distinguishes bullish (green circles below) vs bearish (red circles above) large orders
Rationale: Sudden volume spikes at key levels indicate institutional participation - the "fuel" needed for breakouts or reversals.
________________________________________
🎯 Trading Signal Logic
Combined Setup Criteria
The script generates SHORT and LONG signals when multiple conditions align:
SHORT Signal Requirements:
1. Price reaches an HVN resistance zone (within 0.2%)
2. Large sell order detected (volume spike + red candle)
3. Cumulative delta is bearish OR bearish divergence present
4. 10-bar cooldown between signals (prevents overtrading)
LONG Signal Requirements:
1. Price reaches an HVN support zone
2. Large buy order detected (volume spike + green candle)
3. Cumulative delta is bullish OR bullish divergence present
4. 10-bar cooldown enforced
________________________________________
🔧 Customization Options
Setting - Purpose - Recommendation
Volume Profile Rows - Granularity of level detection - 20 (balanced)
Lookback Period - Historical data analyzed - 50 bars (intraday), 200 (swing)
Large Order Multiplier - Sensitivity to volume spikes - 2.5x (standard), 3.5x (conservative)
HVN Threshold - Resistance zone detection - 1.3 (default)
LVN Threshold - Target zone identification - 0.6 (default)
Divergence Lookback - Pivot detection period - 5 bars (responsive)
________________________________________
📈 Dashboard Indicators
The real-time panel displays:
• POC: Current Point of Control price
• Location: Whether price is at HVN resistance
• Orders: Current large buy/sell activity
• Cumulative Δ: Net order flow value + trend direction
• Divergence: Active bullish/bearish divergences
• Bar Strength: % of candle volume that's directional (>65% = strong)
• SETUP: Current trade signal (LONG/SHORT/WAIT)
________________________________________
🎨 Visual System
• Yellow POC Line: Highest volume level - primary pivot
• Blue Value Area Box: Fair value zone (VAH to VAL)
• Red HVN Zones: Resistance/support from institutional accumulation
• Green LVN Zones: Low-liquidity targets for quick moves
• Volume Bars: Green (buy pressure) vs Red (sell pressure) distribution
• Triangles: LONG (green up) and SHORT (red down) entry signals
• Diamonds: Divergence warnings (cyan=bullish, fuchsia=bearish)
________________________________________
💡 How This Script Is Unique
Unlike standalone volume profile or delta indicators, this script:
1. Synthesizes three complementary methods - volume structure, order flow momentum, and liquidity detection
2. Requires multi-factor confirmation - signals only trigger when price, volume, and delta align at key zones
3. Adapts to market regime - delta filters ensure you're trading with the dominant order flow direction
4. Provides context, not just signals - the dashboard helps you understand why a setup is forming
________________________________________
⚙️ Best Practices
Timeframes:
• 5-15 min: Scalping (use 30-50 bar lookback)
• 1-4 hour: Swing trading (use 100-200 bar lookback)
Risk Management:
• Enter on signal candle close
• Stop loss: Beyond nearest HVN/LVN zone
• Target 1: Next LVN level
• Target 2: Opposite value area boundary
Filters:
• Avoid signals during major news events
• Require bar delta strength >65% for aggressive entries
• Wait for delta MA cross confirmation in ranging markets
________________________________________
🚨 Alerts Available
• Long Setup Trigger
• Short Setup Trigger
• Bullish/Bearish Divergence Detection
• Large Buy/Sell Order Execution
________________________________________
📚 Educational Context
This methodology is based on principles used by professional order flow traders:
• Market Profile Theory: Volume distribution reveals fair value
• Tape Reading: Large orders show institutional intent
• Auction Theory: Price seeks areas of liquidity imbalance (LVN zones)
The script automates pattern recognition that discretionary traders spend years learning to identify manually.
________________________________________
⚠️ Disclaimer
This indicator is a trading tool, not a trading system. It identifies high-probability setups based on order flow analysis but requires proper risk management, market context, and trader discretion. Past performance does not guarantee future results.
________________________________________
Version: 6 (Pine Script)
Type: Overlay + Separate Pane (Delta Panel)
Resource Usage: Moderate (500 bars history, 500 lines/boxes)
________________________________________
For questions or support, please comment below. If you find this script valuable, please boost and favorite! 🚀
1. Volume Profile Analysis
The script constructs a horizontal volume profile by:
- Dividing the price range into configurable rows (default: 20)
- Accumulating volume at each price level over a lookback period (default: 50 bars)
- Separating buy volume (green bars close > open) from sell volume (red bars)
- Identifying three critical levels:
- POC (Point of Control): Price level with highest traded volume - acts as a strong magnet
- VAH/VAL (Value Area High/Low): Contains 70% of total volume - defines fair value zone
- HVN (High Volume Nodes): Resistance zones where institutions accumulated positions
- LVN (Low Volume Nodes): Thin zones that price moves through quickly - ideal targets
Why This Matters: Institutional traders leave footprints through volume. HVN zones show where large players defended levels, making them reliable support/resistance.
---
2. Cumulative Delta (Order Flow)
Tracks the running total of buying vs selling pressure:
- **Bar Delta**: Difference between buy and sell volume per candle
- **Cumulative Delta**: Sum of all bar deltas - shows net directional pressure
- **Delta Moving Average**: Smoothed delta (20-period) to identify trend
- **Delta Divergences**:
- **Bullish**: Price makes lower low, but delta makes higher low (absorption at bottom)
- **Bearish**: Price makes higher high, but delta makes lower high (exhaustion at top)
**How It Works**: When cumulative delta trends up while price consolidates, it signals accumulation. Delta divergences reveal when smart money is positioned opposite to retail expectations.
---
### 3. **Large Order Detection**
Identifies **institutional-sized orders** in real-time:
- Compares current bar volume to 20-period moving average
- Flags orders exceeding 2.5x average volume (configurable multiplier)
- Distinguishes bullish (green circles below) vs bearish (red circles above) large orders
**Rationale**: Sudden volume spikes at key levels indicate institutional participation - the "fuel" needed for breakouts or reversals.
---
## 🎯 Trading Signal Logic
### Combined Setup Criteria
The script generates **SHORT** and **LONG** signals when multiple conditions align:
**SHORT Signal Requirements:**
1. Price reaches an HVN resistance zone (within 0.2%)
2. Large sell order detected (volume spike + red candle)
3. Cumulative delta is bearish OR bearish divergence present
4. 10-bar cooldown between signals (prevents overtrading)
**LONG Signal Requirements:**
1. Price reaches an HVN support zone
2. Large buy order detected (volume spike + green candle)
3. Cumulative delta is bullish OR bullish divergence present
4. 10-bar cooldown enforced
---
## 🔧 Customization Options
| Setting | Purpose | Recommendation |
|---------|---------|----------------|
| **Volume Profile Rows** | Granularity of level detection | 20 (balanced) |
| **Lookback Period** | Historical data analyzed | 50 bars (intraday), 200 (swing) |
| **Large Order Multiplier** | Sensitivity to volume spikes | 2.5x (standard), 3.5x (conservative) |
| **HVN Threshold** | Resistance zone detection | 1.3 (default) |
| **LVN Threshold** | Target zone identification | 0.6 (default) |
| **Divergence Lookback** | Pivot detection period | 5 bars (responsive) |
---
## 📈 Dashboard Indicators
The real-time panel displays:
- **POC**: Current Point of Control price
- **Location**: Whether price is at HVN resistance
- **Orders**: Current large buy/sell activity
- **Cumulative Δ**: Net order flow value + trend direction
- **Divergence**: Active bullish/bearish divergences
- **Bar Strength**: % of candle volume that's directional (>65% = strong)
- **SETUP**: Current trade signal (LONG/SHORT/WAIT)
---
## 🎨 Visual System
- **Yellow POC Line**: Highest volume level - primary pivot
- **Blue Value Area Box**: Fair value zone (VAH to VAL)
- **Red HVN Zones**: Resistance/support from institutional accumulation
- **Green LVN Zones**: Low-liquidity targets for quick moves
- **Volume Bars**: Green (buy pressure) vs Red (sell pressure) distribution
- **Triangles**: LONG (green up) and SHORT (red down) entry signals
- **Diamonds**: Divergence warnings (cyan=bullish, fuchsia=bearish)
---
## 💡 How This Script Is Unique
Unlike standalone volume profile or delta indicators, this script:
1. **Synthesizes three complementary methods** - volume structure, order flow momentum, and liquidity detection
2. **Requires multi-factor confirmation** - signals only trigger when price, volume, and delta align at key zones
3. **Adapts to market regime** - delta filters ensure you're trading with the dominant order flow direction
4. **Provides context, not just signals** - the dashboard helps you understand *why* a setup is forming
---
## ⚙️ Best Practices
**Timeframes:**
- 5-15 min: Scalping (use 30-50 bar lookback)
- 1-4 hour: Swing trading (use 100-200 bar lookback)
**Risk Management:**
- Enter on signal candle close
- Stop loss: Beyond nearest HVN/LVN zone
- Target 1: Next LVN level
- Target 2: Opposite value area boundary
**Filters:**
- Avoid signals during major news events
- Require bar delta strength >65% for aggressive entries
- Wait for delta MA cross confirmation in ranging markets
---
## 🚨 Alerts Available
- Long Setup Trigger
- Short Setup Trigger
- Bullish/Bearish Divergence Detection
- Large Buy/Sell Order Execution
---
## 📚 Educational Context
This methodology is based on principles used by professional order flow traders:
- **Market Profile Theory**: Volume distribution reveals fair value
- **Tape Reading**: Large orders show institutional intent
- **Auction Theory**: Price seeks areas of liquidity imbalance (LVN zones)
The script automates pattern recognition that discretionary traders spend years learning to identify manually.
---
## ⚠️ Disclaimer
This indicator is a **trading tool, not a trading system**. It identifies high-probability setups based on order flow analysis but requires proper risk management, market context, and trader discretion. Past performance does not guarantee future results.
---
**Version**: 6 (Pine Script)
**Type**: Overlay + Separate Pane (Delta Panel)
**Resource Usage**: Moderate (500 bars history, 500 lines/boxes)
---
*For questions or support, please comment below. If you find this script valuable, please boost and favorite!* 🚀

Mars Signals - Ultimate Institutional Suite v3.0(Joker)Comprehensive Trading Manual
Mars Signals – Ultimate Institutional Suite v3.0 (Joker)
## Chapter 1 – Philosophy & System Architecture
This script is not a simple “buy/sell” indicator.
Mars Signals – UIS v3.0 (Joker) is designed as an institutional-style analytical assistant that layers several methodologies into a single, coherent framework.
The system is built on four core pillars:
1. Smart Money Concepts (SMC)
- Detection of Order Blocks (professional demand/supply zones).
- Detection of Fair Value Gaps (FVGs) (price imbalances).
2. Smart DCA Strategy
- Combination of RSI and Bollinger Bands
- Identifies statistically discounted zones for scaling into spot positions or exiting shorts.
3. Volume Profile (Visible Range Simulation)
- Distribution of volume by price, not by time.
- Identification of POC (Point of Control) and high-/low-volume areas.
4. Wyckoff Helper – Spring
- Detection of bear traps, liquidity grabs, and sharp bullish reversals.
All four pillars feed into a Confluence Engine (Scoring System).
The final output is presented in the Dashboard, with a clear, human-readable signal:
- STRONG LONG 🚀
- WEAK LONG ↗
- NEUTRAL / WAIT
- WEAK SHORT ↘
- STRONG SHORT 🩸
This allows the trader to see *how many* and *which* layers of the system support a bullish or bearish bias at any given time.
## Chapter 2 – Settings Overview
### 2.1 General & Dashboard Group
- Show Dashboard Panel (`show_dash`)
Turns the dashboard table in the corner of the chart ON/OFF.
- Show Signal Recommendation (`show_rec`)
- If enabled, the textual signal (STRONG LONG, WEAK SHORT, etc.) is displayed.
- If disabled, you only see feature status (ON/OFF) and the current price.
- Dashboard Position (`dash_pos`)
Determines where the dashboard appears on the chart:
- `Top Right`
- `Bottom Right`
- `Top Left`
### 2.2 Smart Money (SMC) Group
- Enable SMC Strategy (`show_smc`)
Globally enables or disables the Order Block and FVG logic.
- Order Block Pivot Lookback (`ob_period`)
Main parameter for detecting key pivot highs/lows (swing points).
- Default value: 5
- Concept:
A bar is considered a pivot low if its low is lower than the lows of the previous 5 and the next 5 bars.
Similarly, a pivot high has a high higher than the previous 5 and the next 5 bars.
These pivots are used as anchors for Order Blocks.
- Increasing `ob_period`:
- Fewer levels.
- But levels tend to be more significant and reliable.
- In highly volatile markets (major news, war events, FOMC, etc.),
using values 7–10 is recommended to filter out weak levels.
- Show Fair Value Gaps (`show_fvg`)
Enables/disables the drawing of FVG zones (imbalances).
- Bullish OB Color (`c_ob_bull`)
- Color of Bullish Order Blocks (Demand Zones).
- Default: semi-transparent green (transparency ≈ 80).
- Bearish OB Color (`c_ob_bear`)
- Color of Bearish Order Blocks (Supply Zones).
- Default: semi-transparent red.
- Bullish FVG Color (`c_fvg_bull`)
- Color of Bullish FVG (upward imbalance), typically yellow.
- Bearish FVG Color (`c_fvg_bear`)
- Color of Bearish FVG (downward imbalance), typically purple.
### 2.3 Smart DCA Strategy Group
- Enable DCA Zones (`show_dca`)
Enables the Smart DCA logic and visual labels.
- RSI Length (`rsi_len`)
Lookback period for RSI (default: 14).
- Shorter → more sensitive, more noise.
- Longer → fewer signals, higher reliability.
- Bollinger Bands Length (`bb_len`)
Moving average period for Bollinger Bands (default: 20).
- BB Multiplier (`bb_mult`)
Standard deviation multiplier for Bollinger Bands (default: 2.0).
- For extremely volatile markets, values like 2.5–3.0 can be used so that only extreme deviations trigger a DCA signal.
### 2.4 Volume Profile (Visible Range Sim) Group
- Show Volume Profile (`show_vp`)
Enables the simulated Volume Profile bars on the right side of the chart.
- Volume Lookback Bars (`vp_lookback`)
Number of bars used to compute the Volume Profile (default: 150).
- Higher values → broader historical context, heavier computation.
- Row Count (`vp_rows`)
Number of vertical price segments (rows) to divide the total price range into (default: 30).
- Width (%) (`vp_width`)
Relative width of each volume bar as a percentage.
In the code, bar widths are scaled relative to the row with the maximum volume.
> Technical note: Volume Profile calculations are executed only on the last bar (`barstate.islast`) to keep the script performant even on higher timeframes.
### 2.5 Wyckoff Helper Group
- Show Wyckoff Events (`show_wyc`)
Enables detection and plotting of Wyckoff Spring events.
- Volume MA Length (`vol_ma_len`)
Length of the moving average on volume.
A bar is considered to have Ultra Volume if its volume is more than 2× the volume MA.
## Chapter 3 – Smart Money Strategy (Order Blocks & FVG)
### 3.1 What Is an Order Block?
An Order Block (OB) represents the footprint of large institutional orders:
- Bullish Order Block (Demand Zone)
The last selling region (bearish candle/cluster) before a strong upward move.
- Bearish Order Block (Supply Zone)
The last buying region (bullish candle/cluster) before a strong downward move.
Institutions and large players place heavy orders in these regions. Typical price behavior:
- Price moves away from the zone.
- Later returns to the same zone to fill unfilled orders.
- Then continues the larger trend.
In the script:
- If `pl` (pivot low) forms → a Bullish OB is created.
- If `ph` (pivot high) forms → a Bearish OB is created.
The box is drawn:
- From `bar_index ` to `bar_index`.
- Between `low ` and `high `.
- `extend=extend.right` extends the OB into the future, so it acts as a dynamic support/resistance zone.
- Only the last 4 OB boxes are kept to avoid clutter.
### 3.2 Order Block Color Guide
- Semi-transparent Green (`c_ob_bull`)
- Represents a Bullish Order Block (Demand Zone).
- Interpretation: a price region with a high probability of bullish reaction.
- Semi-transparent Red (`c_ob_bear`)
- Represents a Bearish Order Block (Supply Zone).
- Interpretation: a price region with a high probability of bearish reaction.
Overlap (Multiple OBs in the Same Area)
When two or more Order Blocks overlap:
- The shared area appears visually denser/stronger.
- This suggests higher order density.
- Such zones can be treated as high-priority levels for entries, exits, and stop-loss placement.
### 3.3 Demand/Supply Logic in the Scoring Engine
is_in_demand = low <= ta.lowest(low, 20)
is_in_supply = high >= ta.highest(high, 20)
- If current price is near the lowest lows of the last 20 bars, it is considered in a Demand Zone → positive impact on score.
- If current price is near the highest highs of the last 20 bars, it is considered in a Supply Zone → negative impact on score.
This logic complements Order Blocks and helps the Dashboard distinguish whether:
- Market is currently in a statistically cheap (long-friendly) area, or
- In a statistically expensive (short-friendly) area.
### 3.4 Fair Value Gaps (FVG)
#### Concept
When the market moves aggressively:
- Some price levels are skipped and never traded.
- A gap between wicks/shadows of consecutive candles appears.
- These regions are called Fair Value Gaps (FVGs) or Imbalances.
The market generally “dislikes” imbalance and often:
- Returns to these zones in the future.
- Fills the gap (rebalance).
- Then resumes its dominant direction.
#### Implementation in the Code
Bullish FVG (Yellow)
fvg_bull_cond = show_smc and show_fvg and low > high and close > high
if fvg_bull_cond
box.new(bar_index , high , bar_index, low, ...)
Core condition:
`low > high ` → the current low is above the high of two bars ago; the space between them is an untraded gap.
Bearish FVG (Purple)
fvg_bear_cond = show_smc and show_fvg and high < low and close < low
if fvg_bear_cond
box.new(bar_index , low , bar_index, high, ...)
Core condition:
`high < low ` → the current high is below the low of two bars ago; again a price gap exists.
#### FVG Color Guide
- Transparent Yellow (`c_fvg_bull`) – Bullish FVG
Often acts like a magnet for price:
- Price tends to retrace into this zone,
- Fill the imbalance,
- And then continue higher.
- Transparent Purple (`c_fvg_bear`) – Bearish FVG
Price tends to:
- Retrace upward into the purple area,
- Fill the imbalance,
- And then resume downward movement.
#### Trading with FVGs
- FVGs are *not* standalone entry signals.
They are best used as:
- Targets (take-profit zones), or
- Reaction areas where you expect a pause or reversal.
Examples:
- If you are long, a bearish FVG above is often an excellent take-profit zone.
- If you are short, a bullish FVG below is often a good cover/exit zone.
### 3.5 Core SMC Trading Templates
#### Reversal Long
1. Price trades down into a green Order Block (Demand Zone).
2. A bullish confirmation candle (Close > Open) forms inside or just above the OB.
3. If this zone is close to or aligned with a bullish FVG (yellow), the signal is reinforced.
4. Entry:
- At the close of the confirmation candle, or
- Using a limit order near the upper boundary of the OB.
5. Stop-loss:
- Slightly below the OB.
- If the OB is broken decisively and price consolidates below it, the zone loses validity.
6. Targets:
- The next FVG,
- Or the next red Order Block (Supply Zone) above.
#### Reversal Short
The mirror scenario:
- Price rallies into a red Order Block (Supply).
- A bearish confirmation candle forms (Close < Open).
- FVG/premium structure above can act as a confluence.
- Stop-loss goes above the OB.
- Targets: lower FVGs or subsequent green OBs below.
## Chapter 4 – Smart DCA Strategy (RSI + Bollinger Bands)
### 4.1 Smart DCA Concept
- Classic DCA = buying at fixed time intervals regardless of price.
- Smart DCA = scaling in only when:
- Price is statistically cheaper than usual, and
- The market is in a clear oversold condition.
Code logic:
rsi_val = ta.rsi(close, rsi_len)
= ta.bb(close, bb_len, bb_mult)
dca_buy = show_dca and rsi_val < 30 and close < bb_lower
dca_sell = show_dca and rsi_val > 70 and close > bb_upper
Conditions:
- DCA Buy – Smart Scale-In Zone
- RSI < 30 → oversold.
- Close < lower Bollinger Band → price has broken below its typical volatility envelope.
- DCA Sell – Overbought/Distribution Zone
- RSI > 70 → overbought.
- Close > upper Bollinger Band → price is extended far above the mean.
### 4.2 Visual Representation on the Chart
- Green “DCA” Label Below Candle
- Shape: `labelup`.
- Color: lime background, white text.
- Meaning: statistically attractive level for laddered spot entries or short exits.
- Red “SELL” Label Above Candle
- Warning that the market is in an extended, overbought condition.
- Suitable for profit-taking on longs or considering short entries (with proper confluence and risk management).
- Light Green Background (`bgcolor`)
- When `dca_buy` is true, the candle background turns very light green (high transparency).
- This helps visually identify DCA Zones across the chart at a glance.
### 4.3 Practical Use in Trading
#### Spot Trading
Used to build a better average entry price:
- Every time a DCA label appears, allocate a fixed portion of capital (e.g., 2–5%).
- Combining DCA signals with:
- Green OBs (Demand Zones), and/or
- The Volume Profile POC
makes the zone structurally more important.
#### Futures Trading
- Longs
- Use DCA Buy signals as low-risk zones for opening or adding to longs when:
- Price is inside a green OB, or
- The Dashboard already leans LONG.
- Shorts
- Use DCA Sell signals as:
- Exit zones for longs, or
- Areas to initiate shorts with stops above structural highs.
## Chapter 5 – Volume Profile (Visible Range Simulation)
### 5.1 Concept
Traditional volume (histogram under the chart) shows volume over time.
Volume Profile shows volume by price level:
- At which prices has the highest trading activity occurred?
- Where did buyers and sellers agree the most (High Volume Nodes – HVNs)?
- Where did price move quickly due to low participation (Low Volume Nodes – LVNs)?
### 5.2 Implementation in the Script
Executed only when `show_vp` is enabled and on the last bar:
1. The last `vp_lookback` bars (default 150) are processed.
2. The minimum low and maximum high over this window define the price range.
3. This price range is divided into `vp_rows` segments (e.g., 30 rows).
4. For each row:
- All bars are scanned.
- If the mid-price `(high + low ) / 2` falls inside a row, that bar’s volume is added to the row total.
5. The row with the greatest volume is stored as `max_vol_idx` (the POC row).
6. For each row, a volume box is drawn on the right side of the chart.
### 5.3 Color Scheme
- Semi-transparent Orange
- The row with the maximum volume – the Point of Control (POC).
- Represents the strongest support/resistance level from a volume perspective.
- Semi-transparent Blue
- Other volume rows.
- The taller the bar → the higher the volume → the stronger the interest at that price band.
### 5.4 Trading Applications
- If price is above POC and retraces back into it:
→ POC often acts as support, suitable for long setups.
- If price is below POC and rallies into it:
→ POC often acts as resistance, suitable for short setups or profit-taking.
HVNs (Tall Blue Bars)
- Represent areas of equilibrium where the market has spent time and traded heavily.
- Price tends to consolidate here before choosing a direction.
LVNs (Short or Nearly Empty Bars)
- Represent low participation zones.
- Price often moves quickly through these areas – useful for targeting fast moves.
## Chapter 6 – Wyckoff Helper – Spring
### 6.1 Spring Concept
In the Wyckoff framework:
- A Spring is a false break of support.
- The market briefly trades below a well-defined support level, triggers stop losses,
then sharply reverses upward as institutional buyers absorb liquidity.
This movement:
- Clears out weak hands (retail sellers).
- Provides large players with liquidity to enter long positions.
- Often initiates a new uptrend.
### 6.2 Code Logic
Conditions for a Spring:
1. The current low is lower than the lowest low of the previous 50 bars
→ apparent break of a long-standing support.
2. The bar closes bullish (Close > Open)
→ the breakdown was rejected.
3. Volume is significantly elevated:
→ `volume > 2 × volume_MA` (Ultra Volume).
When all conditions are met and `show_wyc` is enabled:
- A pink diamond is plotted below the bar,
- With the label “Spring” – one of the strongest long signals in this system.
### 6.3 Trading Use
- After a valid Spring, markets frequently enter a meaningful bullish phase.
- The highest quality setups occur when:
- The Spring forms inside a green Order Block, and
- Near or on the Volume Profile POC.
Entries:
- At the close of the Spring bar, or
- On the first pullback into the mid-range of the Spring candle.
Stop-loss:
- Slightly below the Spring’s lowest point (wick low plus a small buffer).
## Chapter 7 – Confluence Engine & Dashboard
### 7.1 Scoring Logic
For each bar, the script:
1. Resets `score` to 0.
2. Adjusts the score based on different signals.
SMC Contribution
if show_smc
if is_in_demand
score += 1
if is_in_supply
score -= 1
- Being in Demand → `+1`
- Being in Supply → `-1`
DCA Contribution
if show_dca
if dca_buy
score += 2
if dca_sell
score -= 2
- DCA Buy → `+2` (strong, statistically driven long signal)
- DCA Sell → `-2`
Wyckoff Spring Contribution
if show_wyc
if wyc_spring
score += 2
- Spring → `+2` (entry of strong money)
### 7.2 Mapping Score to Dashboard Signal
- score ≥ 2 → STRONG LONG 🚀
Multiple bullish conditions aligned.
- score = 1 → WEAK LONG ↗
Some bullish bias, but only one layer clearly positive.
- score = 0 → NEUTRAL / WAIT
Rough balance between buying and selling forces; staying flat is usually preferable.
- score = -1 → WEAK SHORT ↘
Mild bearish bias, suited for cautious or short-term plays.
- score ≤ -2 → STRONG SHORT 🩸
Convergence of several bearish signals.
### 7.3 Dashboard Structure
The dashboard is a two-column table:
- Row 0
- Column 0: `"Mars Signals"` – black background, white text.
- Column 1: `"UIS v3.0"` – black background, yellow text.
- Row 1
- Column 0: `"Price:"` (light grey background).
- Column 1: current closing price (`close`) with a semi-transparent blue background.
- Row 2
- Column 0: `"SMC:"`
- Column 1:
- `"ON"` (green) if `show_smc = true`
- `"OFF"` (grey) otherwise.
- Row 3
- Column 0: `"DCA:"`
- Column 1:
- `"ON"` (green) if `show_dca = true`
- `"OFF"` (grey) otherwise.
- Row 4
- Column 0: `"Signal:"`
- Column 1: signal text (`status_txt`) with background color `status_col`
(green, red, teal, maroon, etc.)
- If `show_rec = false`, these cells are cleared.
## Chapter 8 – Visual Legend (Colors, Shapes & Actions)
For quick reading inside TradingView, the visual elements are described line by line instead of a table.
Chart Element: Green Box
Color / Shape: Transparent green rectangle
Core Meaning: Bullish Order Block (Demand Zone)
Suggested Trader Response: Look for longs, Smart DCA adds, closing or reducing shorts.
Chart Element: Red Box
Color / Shape: Transparent red rectangle
Core Meaning: Bearish Order Block (Supply Zone)
Suggested Trader Response: Look for shorts, or take profit on existing longs.
Chart Element: Yellow Area
Color / Shape: Transparent yellow zone
Core Meaning: Bullish FVG / upside imbalance
Suggested Trader Response: Short take-profit zone or expected rebalance area.
Chart Element: Purple Area
Color / Shape: Transparent purple zone
Core Meaning: Bearish FVG / downside imbalance
Suggested Trader Response: Long take-profit zone or temporary supply region.
Chart Element: Green "DCA" Label
Color / Shape: Green label with white text, plotted below the candle
Core Meaning: Smart ladder-in buy zone, DCA buy opportunity
Suggested Trader Response: Spot DCA entry, partial short exit.
Chart Element: Red "SELL" Label
Color / Shape: Red label with white text, plotted above the candle
Core Meaning: Overbought / distribution zone
Suggested Trader Response: Take profit on longs, consider initiating shorts.
Chart Element: Light Green Background (bgcolor)
Color / Shape: Very transparent light-green background behind bars
Core Meaning: Active DCA Buy zone
Suggested Trader Response: Treat as a discount zone on the chart.
Chart Element: Orange Bar on Right
Color / Shape: Transparent orange horizontal bar in the volume profile
Core Meaning: POC – price with highest traded volume
Suggested Trader Response: Strong support or resistance; key reference level.
Chart Element: Blue Bars on Right
Color / Shape: Transparent blue horizontal bars in the volume profile
Core Meaning: Other volume levels, showing high-volume and low-volume nodes
Suggested Trader Response: Use to identify balance zones (HVN) and fast-move corridors (LVN).
Chart Element: Pink "Spring" Diamond
Color / Shape: Pink diamond with white text below the candle
Core Meaning: Wyckoff Spring – liquidity grab and potential major bullish reversal
Suggested Trader Response: One of the strongest long signals in the suite; look for high-quality long setups with tight risk.
Chart Element: STRONG LONG in Dashboard
Color / Shape: Green background, white text in the Signal row
Core Meaning: Multiple bullish layers in confluence
Suggested Trader Response: Consider initiating or increasing longs with strict risk management.
Chart Element: STRONG SHORT in Dashboard
Color / Shape: Red background, white text in the Signal row
Core Meaning: Multiple bearish layers in confluence
Suggested Trader Response: Consider initiating or increasing shorts with a logical, well-placed stop.
## Chapter 9 – Timeframe-Based Trading Playbook
### 9.1 Timeframe Selection
- Scalping
- Timeframes: 1M, 5M, 15M
- Objective: fast intraday moves (minutes to a few hours).
- Recommendation: focus on SMC + Wyckoff.
Smart DCA on very low timeframes may introduce excessive noise.
- Day Trading
- Timeframes: 15M, 1H, 4H
- Provides a good balance between signal quality and frequency.
- Recommendation: use the full stack – SMC + DCA + Volume Profile + Wyckoff + Dashboard.
- Swing Trading & Position Investing
- Timeframes: Daily, Weekly
- Emphasis on Smart DCA + Volume Profile.
- SMC and Wyckoff are used mainly to fine-tune swing entries within larger trends.
### 9.2 Scenario A – Scalping Long
Example: 5-Minute Chart
1. Price is declining into a green OB (Bullish Demand).
2. A candle with a long lower wick and bullish close (Pin Bar / Rejection) forms inside the OB.
3. A Spring diamond appears below the same candle → very strong confluence.
4. The Dashboard shows at least WEAK LONG ↗, ideally STRONG LONG 🚀.
5. Entry:
- On the close of the confirmation candle, or
- On the first pullback into the mid-range of that candle.
6. Stop-loss:
- Slightly below the OB.
7. Targets:
- Nearby bearish FVG above, and/or
- The next red OB.
### 9.3 Scenario B – Day-Trading Short
Recommended Timeframes: 1H or 4H
1. The market completes a strong impulsive move upward.
2. Price enters a red Order Block (Supply).
3. In the same zone, a purple FVG appears or remains unfilled.
4. On a lower timeframe (e.g., 15M), RSI enters overbought territory and a DCA Sell signal appears.
5. The main timeframe Dashboard (1H) shows WEAK SHORT ↘ or STRONG SHORT 🩸.
Trade Plan
- Open a short near the upper boundary of the red OB.
- Place the stop above the OB or above the last swing high.
- Targets:
- A yellow FVG lower on the chart, and/or
- The next green OB (Demand) below.
### 9.4 Scenario C – Swing / Investment with Smart DCA
Timeframes: Daily / Weekly
1. On the daily or weekly chart, each time a green “DCA” label appears:
- Allocate a fixed fraction of your capital (e.g., 3–5%) to that asset.
2. Check whether this DCA zone aligns with the orange POC of the Volume Profile:
- If yes → the quality of the entry zone is significantly higher.
3. If the DCA signal sits inside a daily green OB, the probability of a medium-term bottom increases.
4. Always build the position laddered, never all-in at a single price.
Exits for investors:
- Near weekly red OBs or large purple FVG zones.
- Ideally via partial profit-taking rather than closing 100% at once.
### 9.5 Case Study 1 – BTCUSDT (15-Minute)
- Context: Price has sold off down towards 65,000 USD.
- A green OB had previously formed at that level.
- Near the lower boundary of this OB, a partially filled yellow FVG is present.
- As price returns to this region, a Spring appears.
- The Dashboard shifts from NEUTRAL / WAIT to WEAK LONG ↗.
Plan
- Enter a long near the OB low.
- Place stop below the Spring low.
- First target: a purple FVG around 66,200.
- Second (optional) target: the first red OB above that level.
### 9.6 Case Study 2 – Meme Coin (PEPE – 4H)
- After a strong pump, price enters a corrective phase.
- On the 4H chart, RSI drops below 30; price breaks below the lower Bollinger Band → a DCA label prints.
- The Volume Profile shows the POC at approximately the same level.
- The Dashboard displays STRONG LONG 🚀.
Plan
- Execute laddered buys in the combined DCA + POC zone.
- Place a protective stop below the last significant swing low.
- Target: an expected 20–30% upside move towards the next red OB or purple FVG.
## Chapter 10 – Risk Management, Psychology & Advanced Tuning
### 10.1 Risk Management
No signal, regardless of its strength, replaces risk control.
Recommendations:
- In futures, do not expose more than 1–3% of account equity to risk per trade.
- Adjust leverage to the volatility of the instrument (lower leverage for highly volatile altcoins).
- Place stop-losses in zones where the idea is clearly invalidated:
- Below/above the relevant Order Block or Spring, not randomly in the middle of the structure.
### 10.2 Market-Specific Parameter Tuning
- Calmer Markets (e.g., major FX pairs)
- `ob_period`: 3–5.
- `bb_mult`: 2.0 is usually sufficient.
- Highly Volatile Markets (Crypto, news-driven assets)
- `ob_period`: 7–10 to highlight only the most robust OBs.
- `bb_mult`: 2.5–3.0 so that only extreme deviations trigger DCA.
- `vol_ma_len`: increase (e.g., to ~30) so that Spring triggers only on truly exceptional
volume spikes.
### 10.3 Trading Psychology
- STRONG LONG 🚀 does not mean “risk-free”.
It means the probability of a successful long, given the model’s logic, is higher than average.
- Treat Mars Signals as a confirmation and context system, not a full replacement for your own decision-making.
- Example of disciplined thinking:
- The Dashboard prints STRONG LONG,
- But price is simultaneously testing a multi-month macro resistance or a major negative news event is imminent,
- In such cases, trade smaller, widen stops appropriately, or skip the trade.
## Chapter 11 – Technical Notes & FAQ
### 11.1 Does the Script Repaint?
- Order Blocks and Springs are based on completed pivot structures and confirmed candles.
- Until a pivot is confirmed, an OB does not exist; after confirmation, behavior is stable under classic SMC assumptions.
- The script is designed to be structurally consistent rather than repainting signals arbitrarily.
### 11.2 Computational Load of Volume Profile
- On the last bar, the script processes up to `vp_lookback` bars × `vp_rows` rows.
- On very low timeframes with heavy zooming, this can become demanding.
- If you experience performance issues:
- Reduce `vp_lookback` or `vp_rows`, or
- Temporarily disable Volume Profile (`show_vp = false`).
### 11.3 Multi-Timeframe Behavior
- This version of the script is not internally multi-timeframe.
All logic (OB, DCA, Spring, Volume Profile) is computed on the active timeframe only.
- Practical workflow:
- Analyze overall structure and key zones on higher timeframes (4H / Daily).
- Use lower timeframes (15M / 1H) with the same tool for timing entries and exits.
## Conclusion
Mars Signals – Ultimate Institutional Suite v3.0 (Joker) is a multi-layer trading framework that unifies:
- Price structure (Order Blocks & FVG),
- Statistical behavior (Smart DCA via RSI + Bollinger),
- Volume distribution by price (Volume Profile with POC, HVN, LVN),
- Liquidity events (Wyckoff Spring),
into a single, coherent system driven by a transparent Confluence Scoring Engine.
The final output is presented in clear, actionable language:
> STRONG LONG / WEAK LONG / NEUTRAL / WEAK SHORT / STRONG SHORT
The system is designed to support professional decision-making, not to replace it.
Used together with strict risk management and disciplined execution,
Mars Signals – UIS v3.0 (Joker) can serve as a central reference manual and operational guide
for your trading workflow, from scalping to swing and investment positioning.

Volume Based Sampling [BackQuant]Volume Based Sampling
What this does
This indicator converts the usual time-based stream of candles into an event-based stream of “synthetic” bars that are created only when enough trading activity has occurred . You choose the activity definition:
Volume bars : create a new synthetic bar whenever the cumulative number of shares/contracts traded reaches a threshold.
Dollar bars : create a new synthetic bar whenever the cumulative traded dollar value (price × volume) reaches a threshold.
The script then keeps an internal ledger of these synthetic opens, highs, lows, closes, and volumes, and can display them as candles, plot a moving average calculated over the synthetic closes, mark each time a new sample is formed, and optionally overlay the native time-bars for comparison.
Why event-based sampling matters
Markets do not release information on a clock: activity clusters during news, opens/closes, and liquidity shocks. Event-based bars normalize for that heteroskedastic arrival of information: during active periods you get more bars (finer resolution); during quiet periods you get fewer bars (coarser resolution). Research shows this can reduce microstructure pathologies and produce series that are closer to i.i.d. and more suitable for statistical modeling and ML. In particular:
Volume and dollar bars are a common event-time alternative to time bars in quantitative research and are discussed extensively in Advances in Financial Machine Learning (AFML). These bars aim to homogenize information flow by sampling on traded size or value rather than elapsed seconds.
The Volume Clock perspective models market activity in “volume time,” showing that many intraday phenomena (volatility, liquidity shocks) are better explained when time is measured by traded volume instead of seconds.
Related market microstructure work on flow toxicity and liquidity highlights that the risk dealers face is tied to information intensity of order flow, again arguing for activity-based clocks.
How the indicator works (plain English)
Choose your bucket type
Volume : accumulate volume until it meets a threshold.
Dollar Bars : accumulate close × volume until it meets a dollar threshold.
Pick the threshold rule
Dynamic threshold : by default, the script computes a rolling statistic (mean or median) of recent activity to set the next bucket size. This adapts bar size to changing conditions (e.g., busier sessions produce more frequent synthetic bars).
Fixed threshold : optionally override with a constant target (e.g., exactly 100,000 contracts per synthetic bar, or $5,000,000 per dollar bar).
Build the synthetic bar
While a bucket fills, the script tracks:
o_s: first price of the bucket (synthetic open)
h_s: running maximum price (synthetic high)
l_s: running minimum price (synthetic low)
c_s: last price seen (synthetic close)
v_s: cumulative native volume inside the bucket
d_samples: number of native bars consumed to complete the bucket (a proxy for “how fast” the threshold filled)
Emit a new sample
Once the bucket meets/exceeds the threshold, a new synthetic bar is finalized and stored. If overflow occurs (e.g., a single native bar pushes you past the threshold by a lot), the code will emit multiple synthetic samples to account for the extra activity.
Maintain a rolling history efficiently
A ring buffer can overwrite the oldest samples when you hit your Max Stored Samples cap, keeping memory usage stable.
Compute synthetic-space statistics
The script computes an SMA over the last N synthetic closes and basic descriptors like average bars per synthetic sample, mean and standard deviation of synthetic returns, and more. These are all in event time , not clock time.
Inputs and options you will actually use
Data Settings
Sampling Method : Volume or Dollar Bars.
Rolling Lookback : window used to estimate the dynamic threshold from recent activity.
Filter : Mean or Median for the dynamic threshold. Median is more robust to spikes.
Use Fixed? / Fixed Threshold : override dynamic sizing with a constant target.
Max Stored Samples : cap on synthetic history to keep performance snappy.
Use Ring Buffer : turn on to recycle storage when at capacity.
Indicator Settings
SMA over last N samples : moving average in synthetic space . Because its index is sample count, not minutes, it adapts naturally: more updates in busy regimes, fewer in quiet regimes.
Visuals
Show Synthetic Bars : plot the synthetic OHLC candles.
Candle Color Mode :
Green/Red: directional close vs open
Volume Intensity: opacity scales with synthetic size
Neutral: single color
Adaptive: graded by how large the bucket was relative to threshold
Mark new samples : drop a small marker whenever a new synthetic bar prints.
Comparison & Research
Show Time Bars : overlay the native time-based candles to visually compare how the two sampling schemes differ.
How to read it, step by step
Turn on “Synthetic Bars” and optionally overlay “Time Bars.” You will see that during high-activity bursts, synthetic bars print much faster than time bars.
Watch the synthetic SMA . Crosses in synthetic space can be more meaningful because each update represents a roughly comparable amount of traded information.
Use the “Avg Bars per Sample” in the info table as a regime signal. Falling average bars per sample means activity is clustering, often coincident with higher realized volatility.
Try Dollar Bars when price varies a lot but share count does not; they normalize by dollar risk taken in each sample. Volume Bars are ideal when share count is a better proxy for information flow in your instrument.
Quant finance background and citations
Event time vs. clock time : Easley, López de Prado, and O’Hara advocate measuring intraday phenomena on a volume clock to better align sampling with information arrival. This framing helps explain volatility bursts and liquidity droughts and motivates volume-based bars.
Flow toxicity and dealer risk : The same authors show how adverse selection risk changes with the intensity and informativeness of order flow, further supporting activity-based clocks for modeling and risk management.
AFML framework : In Advances in Financial Machine Learning , event-driven bars such as volume, dollar, and imbalance bars are presented as superior sampling units for many ML tasks, yielding more stationary features and fewer microstructure distortions than fixed time bars. ( Alpaca )
Practical use cases
1) Regime-aware moving averages
The synthetic SMA in event time is not fooled by quiet periods: if nothing of consequence trades, it barely updates. This can make trend filters less sensitive to calendar drift and more sensitive to true participation.
2) Breakout logic on “equal-information” samples
The script exposes simple alerts such as breakout above/below the synthetic SMA . Because each bar approximates a constant amount of activity, breakouts are conditioned on comparable informational mass, not arbitrary time buckets.
3) Volatility-adaptive backtests
If you use synthetic bars as your base data stream, most signal rules become self-paced : entry and exit opportunities accelerate in fast markets and slow down in quiet regimes, which often improves the realism of slippage and fill modeling in research pipelines (pair this indicator with strategy code downstream).
4) Regime diagnostics
Avg Bars per Sample trending down: activity is dense; expect larger realized ranges.
Return StdDev (synthetic) rising: noise or trend acceleration in event time; re-tune risk.
Interpreting the info panel
Method : your sampling choice and current threshold.
Total Samples : how many synthetic bars have been formed.
Current Vol/Dollar : how much of the next bucket is already filled.
Bars in Bucket : native bars consumed so far in the current bucket.
Avg Bars/Sample : lower means higher trading intensity.
Avg Return / Return StdDev : return stats computed over synthetic closes .
Research directions you can build from here
Imbalance and run bars
Extend beyond pure volume or dollar thresholds to imbalance bars that trigger on directional order flow imbalance (e.g., buy volume minus sell volume), as discussed in the AFML ecosystem. These often further homogenize distributional properties used in ML. alpaca.markets
Volume-time indicators
Re-compute classical indicators (RSI, MACD, Bollinger) on the synthetic stream. The premise is that signals are updated by traded information , not seconds, which may stabilize indicator behavior in heteroskedastic regimes.
Liquidity and toxicity overlays
Combine synthetic bars with proxies of flow toxicity to anticipate spread widening or volatility clustering. For instance, tag synthetic bars that surpass multiples of the threshold and test whether subsequent realized volatility is elevated.
Dollar-risk parity sampling for portfolios
Use dollar bars to align samples across assets by notional risk, enabling cleaner cross-asset features and comparability in multi-asset models (e.g., correlation studies, regime clustering). AFML discusses the benefits of event-driven sampling for cross-sectional ML feature engineering.
Microstructure feature set
Compute duration in native bars per synthetic sample , range per sample , and volume multiple of threshold as inputs to state classifiers or regime HMMs . These features are inherently activity-aware and often predictive of short-horizon volatility and trend persistence per the event-time literature. ( Alpaca )
Tips for clean usage
Start with dynamic thresholds using Median over a sensible lookback to avoid outlier distortion, then move to Fixed thresholds when you know your instrument’s typical activity scale.
Compare time bars vs synthetic bars side by side to develop intuition for how your market “breathes” in activity time.
Keep Max Stored Samples reasonable for performance; the ring buffer avoids memory creep while preserving a rolling window of research-grade data.

Auto Volume Spread Analysis (VSA) [TANHEF]Auto Volume Spread Analysis (visible volume and spread bars auto-scaled): Understanding Market Intentions through the Interpretation of Volume and Price Movements.
All the sections below contain the same descriptions as my other indicator "Volume Spread Analysis" with the exception of 'Auto Scaling'.
█ Auto-Scaling
This indicator auto-scales spread bars to match the visible volume bars, unlike the previous "Volume Spread Analysis " version which limited the number of visible spread bars to a fixed count. The auto-scaling feature allows for easier navigation through historical data, enabling both more historical spread bars to be viewed and more historical VSA pattern labels being displayed without requiring using the bar replay tool. Please note that this indicator’s auto-scaling feature recalculates the visible bars on the chart, causing the indicator to reload whenever the chart is moved.
Auto-scaled spread bars have two display options (set via 'Spread Bars Method' setting):
Lines: a bar lookback limit of 500 bars.
Polylines: no bar lookback limit as only plotted on visible bars on chart, which uses multiple polylines are used.
█ Simple Explanation:
The Volume Spread Analysis (VSA) indicator is a comprehensive tool that helps traders identify key market patterns and trends based on volume and spread data. This indicator highlights significant VSA patterns and provides insights into market behavior through color-coded volume/spread bars and identification of bars indicating strength, weakness, and neutrality between buyers and sellers. It also includes powerful volume and spread forecasting capabilities.
█ Laws of Volume Spread Analysis (VSA):
The origin of VSA begins with Richard Wyckoff, a pivotal figure in its development. Wyckoff made significant contributions to trading theory, including the formulation of three basic laws:
The Law of Supply and Demand: This fundamental law states that supply and demand balance each other over time. High demand and low supply lead to rising prices until demand falls to a level where supply can meet it. Conversely, low demand and high supply cause prices to fall until demand increases enough to absorb the excess supply.
The Law of Cause and Effect: This law assumes that a 'cause' will result in an 'effect' proportional to the 'cause'. A strong 'cause' will lead to a strong trend (effect), while a weak 'cause' will lead to a weak trend.
The Law of Effort vs. Result: This law asserts that the result should reflect the effort exerted. In trading terms, a large volume should result in a significant price move (spread). If the spread is small, the volume should also be small. Any deviation from this pattern is considered an anomaly.
█ Volume and Spread Analysis Bars:
Display: Volume and spread bars that consist of color coded levels, with the spread bars scaled to match the volume bars. A displayable table (Legend) of bar colors and levels can give context and clarify to each volume/spread bar.
Calculation: Levels are calculated using multipliers applied to moving averages to represent key levels based on historical data: low, normal, high, ultra. This method smooths out short-term fluctuations and focuses on longer-term trends.
Low Level: Indicates reduced volatility and market interest.
Normal Level: Reflects typical market activity and volatility.
High Level: Indicates increased activity and volatility.
Ultra Level: Identifies extreme levels of activity and volatility.
This illustrates the appearance of Volume and Spread bars when scaled and plotted together:
█ Forecasting Capabilities:
Display: Forecasted volume and spread levels using predictive models.
Calculation: Volume and Spread prediction calculations differ as volume is linear and spread is non-linear.
Volume Forecast (Linear Forecasting): Predicts future volume based on current volume rate and bar time till close.
Spread Forecast (Non-Linear Dynamic Forecasting): Predicts future spread using a dynamic multiplier, less near midpoint (consolidation) and more near low or high (trending), reflecting non-linear expansion.
Moving Averages: In forecasting, moving averages utilize forecasted levels instead of actual levels to ensure the correct level is forecasted (low, normal, high, or ultra).
The following compares forecasted volume with actual resulting volume, highlighting the power of early identifying increased volume through forecasted levels:
█ VSA Patterns:
Criteria and descriptions for each VSA pattern are available as tooltips beside them within the indicator’s settings. These tooltips provide explanations of potential developments based on the volume and spread data.
Signs of Strength (🟢): Patterns indicating strong buying pressure and potential market upturns.
Down Thrust
Selling Climax
No Effort ➤ Bearish Result
Bearish Effort ➤ No Result
Inverse Down Thrust
Failed Selling Climax
Bull Outside Reversal
End of Falling Market (Bag Holder)
Pseudo Down Thrust
No Supply
Signs of Weakness (🔴): Patterns indicating strong selling pressure and potential market downturns.
Up Thrust
Buying Climax
No Effort ➤ Bullish Result
Bullish Effort ➤ No Result
Inverse Up Thrust
Failed Buying Climax
Bear Outside Reversal
End of Rising Market (Bag Seller)
Pseudo Up Thrust
No Demand
Neutral Patterns (🔵): Patterns indicating market indecision and potential for continuation or reversal.
Quiet Doji
Balanced Doji
Strong Doji
Quiet Spinning Top
Balanced Spinning Top
Strong Spinning Top
Quiet High Wave
Balanced High Wave
Strong High Wave
Consolidation
Bar Patterns (🟡): Common candlestick patterns that offer insights into market sentiment. These are required in some VSA patterns and can also be displayed independently.
Bull Pin Bar
Bear Pin Bar
Doji
Spinning Top
High Wave
Consolidation
This demonstrates the acronym and descriptive options for displaying bar patterns, with the ability to hover over text to reveal the descriptive text along with what type of pattern:
█ Alerts:
VSA Pattern Alerts: Notifications for identified VSA patterns at bar close.
Volume and Spread Alerts: Alerts for confirmed and forecasted volume/spread levels (Low, High, Ultra).
Forecasted Volume and Spread Alerts: Alerts for forecasted volume/spread levels (High, Ultra) include a minimum percent time elapsed input to reduce false early signals by ensuring sufficient bar time has passed.
█ Inputs and Settings:
Indicator Bar Color: Select color schemes for bars (Normal, Detail, Levels).
Indicator Moving Average Color: Select schemes for bars (Fill, Lines, None).
Price Bar Colors: Options to color price bars based on VSA patterns and volume levels.
Legend: Display a table of bar colors and levels for context and clarity of volume/spread bars.
Forecast: Configure forecast display and prediction details for volume and spread.
Average Multipliers: Define multipliers for different levels (Low, High, Ultra) to refine the analysis.
Moving Average: Set volume and spread moving average settings.
VSA: Select the VSA patterns to be calculated and displayed (Strength, Weakness, Neutral).
Bar Patterns: Criteria for bar patterns used in VSA (Doji, Bull Pin Bar, Bear Pin Bar, Spinning Top, Consolidation, High Wave).
Colors: Set exact colors used for indicator bars, indicator moving averages, and price bars.
More Display Options: Specify how VSA pattern text is displayed (Acronym, Descriptive), positioning, and sizes.
Alerts: Configure alerts for VSA patterns, volume, and spread levels, including forecasted levels.
█ Usage:
The Volume Spread Analysis indicator is a helpful tool for leveraging volume spread analysis to make informed trading decisions. It offers comprehensive visual and textual cues on the chart, making it easier to identify market conditions, potential reversals, and continuations. Whether analyzing historical data or forecasting future trends, this indicator provides insights into the underlying factors driving market movements.

Volume Spread Analysis [TANHEF]Volume Spread Analysis: Understanding Market Intentions through the Interpretation of Volume and Price Movements.
█ Simple Explanation:
The Volume Spread Analysis (VSA) indicator is a comprehensive tool that helps traders identify key market patterns and trends based on volume and spread data. This indicator highlights significant VSA patterns and provides insights into market behavior through color-coded volume/spread bars and identification of bars indicating strength, weakness, and neutrality between buyers and sellers. It also includes powerful volume and spread forecasting capabilities.
█ Laws of Volume Spread Analysis (VSA):
The origin of VSA begins with Richard Wyckoff, a pivotal figure in its development. Wyckoff made significant contributions to trading theory, including the formulation of three basic laws:
The Law of Supply and Demand: This fundamental law states that supply and demand balance each other over time. High demand and low supply lead to rising prices until demand falls to a level where supply can meet it. Conversely, low demand and high supply cause prices to fall until demand increases enough to absorb the excess supply.
The Law of Cause and Effect: This law assumes that a 'cause' will result in an 'effect' proportional to the 'cause'. A strong 'cause' will lead to a strong trend (effect), while a weak 'cause' will lead to a weak trend.
The Law of Effort vs. Result: This law asserts that the result should reflect the effort exerted. In trading terms, a large volume should result in a significant price move (spread). If the spread is small, the volume should also be small. Any deviation from this pattern is considered an anomaly.
█ Volume and Spread Analysis Bars:
Display: Volume and/or spread bars that consist of color coded levels. If both of these are displayed, the number of spread bars can be limited for visual appeal and understanding, with the spread bars scaled to match the volume bars. While automatic calculation of the number of visual bars for auto scaling is possible, it is avoided to prevent the indicator from reloading whenever the number of visual price bars on the chart is adjusted, ensuring uninterrupted analysis. A displayable table (Legend) of bar colors and levels can give context and clarify to each volume/spread bar.
Calculation: Levels are calculated using multipliers applied to moving averages to represent key levels based on historical data: low, normal, high, ultra. This method smooths out short-term fluctuations and focuses on longer-term trends.
Low Level: Indicates reduced volatility and market interest.
Normal Level: Reflects typical market activity and volatility.
High Level: Indicates increased activity and volatility.
Ultra Level: Identifies extreme levels of activity and volatility.
This illustrates the appearance of Volume and Spread bars when scaled and plotted together:
█ Forecasting Capabilities:
Display: Forecasted volume and spread levels using predictive models.
Calculation: Volume and Spread prediction calculations differ as volume is linear and spread is non-linear.
Volume Forecast (Linear Forecasting): Predicts future volume based on current volume rate and bar time till close.
Spread Forecast (Non-Linear Dynamic Forecasting): Predicts future spread using a dynamic multiplier, less near midpoint (consolidation) and more near low or high (trending), reflecting non-linear expansion.
Moving Averages: In forecasting, moving averages utilize forecasted levels instead of actual levels to ensure the correct level is forecasted (low, normal, high, or ultra).
The following compares forecasted volume with actual resulting volume, highlighting the power of early identifying increased volume through forecasted levels:
█ VSA Patterns:
Criteria and descriptions for each VSA pattern are available as tooltips beside them within the indicator’s settings. These tooltips provide explanations of potential developments based on the volume and spread data.
Signs of Strength (🟢): Patterns indicating strong buying pressure and potential market upturns.
Down Thrust
Selling Climax
No Effort → Bearish Result
Bearish Effort → No Result
Inverse Down Thrust
Failed Selling Climax
Bull Outside Reversal
End of Falling Market (Bag Holder)
Pseudo Down Thrust
No Supply
Signs of Weakness (🔴): Patterns indicating strong selling pressure and potential market downturns.
Up Thrust
Buying Climax
No Effort → Bullish Result
Bullish Effort → No Result
Inverse Up Thrust
Failed Buying Climax
Bear Outside Reversal
End of Rising Market (Bag Seller)
Pseudo Up Thrust
No Demand
Neutral Patterns (🔵): Patterns indicating market indecision and potential for continuation or reversal.
Quiet Doji
Balanced Doji
Strong Doji
Quiet Spinning Top
Balanced Spinning Top
Strong Spinning Top
Quiet High Wave
Balanced High Wave
Strong High Wave
Consolidation
Bar Patterns (🟡): Common candlestick patterns that offer insights into market sentiment. These are required in some VSA patterns and can also be displayed independently.
Bull Pin Bar
Bear Pin Bar
Doji
Spinning Top
High Wave
Consolidation
This demonstrates the acronym and descriptive options for displaying bar patterns, with the ability to hover over text to reveal the descriptive text along with what type of pattern:
█ Alerts:
VSA Pattern Alerts: Notifications for identified VSA patterns at bar close.
Volume and Spread Alerts: Alerts for confirmed and forecasted volume/spread levels (Low, High, Ultra).
Forecasted Volume and Spread Alerts: Alerts for forecasted volume/spread levels (High, Ultra) include a minimum percent time elapsed input to reduce false early signals by ensuring sufficient bar time has passed.
█ Inputs and Settings:
Display Volume and/or Spread: Choose between displaying volume bars, spread bars, or both with different lookback periods.
Indicator Bar Color: Select color schemes for bars (Normal, Detail, Levels).
Indicator Moving Average Color: Select schemes for bars (Fill, Lines, None).
Price Bar Colors: Options to color price bars based on VSA patterns and volume levels.
Legend: Display a table of bar colors and levels for context and clarity of volume/spread bars.
Forecast: Configure forecast display and prediction details for volume and spread.
Average Multipliers: Define multipliers for different levels (Low, High, Ultra) to refine the analysis.
Moving Average: Set volume and spread moving average settings.
VSA: Select the VSA patterns to be calculated and displayed (Strength, Weakness, Neutral).
Bar Patterns: Criteria for bar patterns used in VSA (Doji, Bull Pin Bar, Bear Pin Bar, Spinning Top, Consolidation, High Wave).
Colors: Set exact colors used for indicator bars, indicator moving averages, and price bars.
More Display Options: Specify how VSA pattern text is displayed (Acronym, Descriptive), positioning, and sizes.
Alerts: Configure alerts for VSA patterns, volume, and spread levels, including forecasted levels.
█ Usage:
The Volume Spread Analysis indicator is a helpful tool for leveraging volume spread analysis to make informed trading decisions. It offers comprehensive visual and textual cues on the chart, making it easier to identify market conditions, potential reversals, and continuations. Whether analyzing historical data or forecasting future trends, this indicator provides insights into the underlying factors driving market movements.

Delta ZigZag [LuxAlgo]The Delta ZigZag indicator is focused on volume analysis during the development of ZigZag lines. Volume data can be retrieved from a Lower timeframe (LTF) or real-time Tick data.
Our Delta ZigZag publication can be helpful in detecting indications of a trend reversal or potential weakening/strengthening of the trend.
This indicator by its very nature backpaints, meaning that the displayed components are offset in the past.
🔶 USAGE
The ZigZag line is formed by connecting Swings , which can be set by adjusting the Left and Right settings.
Left is the number of bars for evaluation at the left of the evaluated point.
Right is the number of bars for evaluation at the right of the evaluated point.
A valid Swing is a value higher or lower than the bars at the left/right .
A higher Left or Right set number will generally create broader ZigZag ( ZZ ) lines, while the drawing of the ZZ line will be delayed (especially when Right is set higher). On the other hand, when Right is set at 0, ZZ line are drawn quickly. However, this results in a hyperactive switching of the ZZ direction.
To ensure maximum visibility of values, we recommend using " Bars " from the " Bar's style " menu.
🔹 Volume examination
The script provides two options for Volume examination :
Examination per ZigZag line
Examination per bar
Bullish Volume is volume associated with a green bar ( close > open )
Bearish Volume is volume associated with a red bar ( close < open )
Neutral Volume (volume on a " close == open" bar) is not included in this publication.
🔹 Examination per ZigZag line
As long as the price moves in the same direction, the present ZZ line will continue. When the direction of the price changes, the bull/bear volume of the previous ZZ line is evaluated and drawn on the chart.
The ZZ line is divided into two parts: a bullish green line and a bearish red line.
The intercept of these two lines will depend on the ratio of bullish/bearish volume
This ratio is displayed at the intercept as % bullish volume (Settings -> Show % Bullish Volume)
* Note that we cannot draw between 2 bars. Therefore, if a ZZ line is only 1 bar long, the intercept will be at one of those 2 bars and not in between. The percentage can be helpful in interpreting bull/bear volume.
In the example above (2 most right labels), you can see that an overlap of 2 labels is prevented, ensuring the ability to evaluate the bullish % volume of the ZZ line .
The percentage will be colored green when more than 50%, red otherwise. The color will fade when the direction is contradictory; for example, 40% when the ZZ line goes up or 70% when the ZZ line falls.
More details can be visualized by enabling " Show " and choosing 1 of 3 options:
Average Volume Delta/bar
Average Volume/bar
Normalised Volume Delta
For both 'averages', the sum of " Volume "/" Volume Delta " of every bar on the ZZ line is divided by the number of bars (per ZZ line ).
The " Normalised Volume Delta " is calculated by dividing the sum of " Delta Volume " by the sum of " Volume " (neutral volume not included), which is displayed as a percentage.
All three options will display a label at the last point of the ZZ line and be coloured similarly: green when the ratio bullish/bearish volume of the ZZ line is bullish and red otherwise. Here, the colour also fades when it is bullish, but the ZZ line falls or when it is bearish with a rising ZZ line .
A tooltip at each label hints at the chosen option.
You can pick one of the options or combine them together.
🔹 Examination per bar
Besides information about what's happening during the ZZ line , information per bar can be visualized by enabling " Show Details " in Settings .
Split Volume per bar : show the sum of bullish (upV) and bearish (dnV) volume per bar
Volume (bar) : Total Volume per bar (bullish + bearish volume, neutral volume not included)
Δ Volume (bar) : Show Delta Volume (bullish - bearish volume)
🔹 Using Lower Timeframe Data
The ZigZag lines using LTF data are colored brighter. Also note the vertical line where the LTF data starts and the gap between ZZ lines with LTF data and without.
When " LTF " is chosen for the " Data from: " option in Settings , data is retrieved from Lower Timeframe bars (default 1 minute). When the LTF setting is higher than the current chart timeframe, the LTF period will automatically be adjusted to the current timeframe to prevent errors.
As there is a 100K limit to the number of LTF intrabars that can be analyzed by a script, this implies the higher the difference between LTF and current TF; the fewer ZZ lines will be seen.
🔹 Using real-time tick data
The principles are mostly the same as those of LTF data. However, in contrast with LTF data, where you already have LTF ZZ lines when loading the script, real-time tick data-based ZZ lines will only start after loading the chart.
Changing the settings of a ticker will reset everything. However, returning to the same settings/ticker would show the cached data again.
Here, you can see that changing settings reset everything, but returning after 2 minutes to the initial settings shows the cached data. Don't expect it to be cached for hours or days, though.
🔶 DETAILS
The timeframe used for LTF data should always be the same or lower than the current TF; otherwise, an error occurs. This snippet prevents the error and adjusts the LTF to the current TF when LTF is too high:
res = input.timeframe('1')
res := timeframe.from_seconds( math.min( timeframe.in_seconds(timeframe.period), timeframe.in_seconds(res) ) )
🔶 SETTINGS
Data from: LTF (Lower TimeFrame) or Ticks (Real-time ticks)
Res: Lower TimeFrame (only applicable when choosing LTF )
Option: choose " high/low " or " close " for Swing detection
🔹 ZigZag
Left: Lookback period for Swings
Right: Confirmation period after potential Swing
🔹 ZigZag Delta
Show % Bullish Volume : % bullish volume against total volume during the ZZ line
Show:
Average Volume Delta/bar
Average Volume/bar
Normalised Volume Delta
See USAGE for more information
🔹 Bar Data
Split Volume per bar: shows the sum of bullish ( upV ) and bearish ( dnV ) volume per bar
Volume (bar): Total Volume per bar (bullish + bearish volume, neutral volume not included)
Δ Volume (bar): Show Volume Delta (bullish - bearish volume)

PoC Migration Map [BackQuant]PoC Migration Map
A volume structure tool that builds a side volume profile, extracts rolling Points of Control (PoCs), and maps how those PoCs migrate through time so you can see where value is moving, how volume clusters shift, and how that aligns with trend regime.
What this is
This indicator combines a classic volume profile with a segmented PoC trail. It looks back over a configurable window, splits that window into bins by price, and shows you where volume has concentrated. On top of that, it slices the lookback into fixed bar segments, finds the local PoC in each segment, and plots those PoCs as a chain of nodes across the chart.
The result is a "migration map" of value:
A side volume profile that shows how volume is distributed over the recent price range.
A sequence of PoC nodes that show where local value has been accepted over time.
Lines that connect those PoCs to reveal the path of value migration.
Optional trend coloring based on EMA 12 and EMA 21, so each PoC also encodes trend regime.
Used together, this gives you a structural read on where the market has actually traded size, how "value" is moving, and whether that movement is aligned or fighting the current trend.
Core components
Lookback volume profile - a side histogram built from all closes and volumes in the chosen lookback window.
Segmented PoC trail - rolling PoCs computed over fixed bar segments, plotted as nodes in time.
Trend heatmap - optional color mapping of PoC nodes using EMA 12 versus EMA 21.
PoC labels - optional labels on every Nth PoC for easier reading and referencing.
How it works
1) Global lookback and binning
You choose:
Lookback Bars - how far back to collect data.
Number of Bins - how finely to split the price range.
The script:
Finds the highest high and lowest low in the lookback.
Computes the total price range and divides it into equal binCount slices.
Assigns each bar's close and volume into the appropriate price bin.
This creates a discretized volume distribution across the entire lookback.
2) Side volume profile
If "Show Side Profile" is enabled, a right-hand volume profile is drawn:
Each bin becomes a horizontal bar anchored at a configurable "Right Offset" from the current bar.
The horizontal width of each bar is proportional to that bin's volume relative to the maximum volume bin.
Optionally, volume values and percentages are printed inside the profile bars.
Color and transparency are controlled by:
Base Profile Color and its transparency.
A gradient that uses relative volume to modulate opacity between lower volume and higher volume bins.
Profile Width (%) - how wide the maximum bin can extend in bars.
This gives you an at-a-glance view of the volume landscape for the chosen lookback window.
3) Segmenting for PoC migration
To build the PoC trail, the lookback is divided into segments:
Bars per Segment - bars in each local cluster.
Number of Segments - how many segments you want to see back in time.
For each segment:
The script uses the same price bins and accumulates volume only from bars in that segment.
It finds the bin with the highest volume in that segment, which is the local PoC for that segment.
It sets the PoC price to the center of that bin.
It finds the "mid bar" of the segment and places the PoC node at that time on the chart.
This is repeated for each segment from older to newer, so you get a chain of PoCs that shows how local value has migrated over time.
4) Trend regime and color coding
The indicator precomputes:
EMA 12 (Fast).
EMA 21 (Slow).
For each PoC:
It samples EMA 12 and EMA 21 at the mid bar of that segment.
It computes a simple trend score as fast EMA minus slow EMA.
If trend heatmap is enabled, PoC nodes (and the lines between them) are colored by:
Trend Up Color if EMA 12 is above EMA 21.
Trend Down Color if EMA 12 is below EMA 21.
Trend Flat Color if they are roughly equal.
If the trend heatmap is disabled, PoC color is instead based on PoC migration:
If the current PoC is above the previous PoC, use the Up PoC Color.
If the current PoC is below the previous PoC, use the Down PoC Color.
If unchanged, use the Flat PoC Color.
5) Connecting PoCs and labels
Once PoC prices and times are known:
Each PoC is connected to the previous one with a dotted line, using the PoC's color.
Optional labels are placed next to every Nth PoC:
Label text uses a simple "PoC N" scheme.
Label background uses a configurable label background color.
Label border is colored by the PoC's own color for visual consistency.
This turns the PoCs into a visual path that can be read like a "value trajectory" across the chart.
What it plots
When fully enabled, you will see:
A right-sided volume profile for the chosen lookback window, built from volume by price.
Colored horizontal bars representing each price bin's relative volume.
Optional volume text showing each bin's volume and its percentage of the profile maximum.
A series of PoC nodes spaced across the chart at the mid point of each segment.
Dotted lines connecting those PoCs to show the migration path of value.
Optional PoC labels at each Nth node for easier reference.
Color-coding of PoCs and lines either by EMA 12 / 21 trend regime or by up/down PoC drift.
Reading PoC migration and market pressure
Side profile as a pressure map
The side profile shows where trading has been most active:
Thick, opaque bars represent high volume zones and possible high interest or acceptance areas.
Thin, faint bars represent low volume zones, potential rejection or transition areas.
When price trades near a high volume bin, the market is sitting on an area of prior acceptance and size.
When price moves quickly through low volume bins, it often does so with less friction.
This gives you a static map of where the market has been willing to do business within your lookback.
PoC trail as a value migration map
The PoC chain represents "where value has lived" over time:
An upward sloping PoC trail indicates value migrating higher. Buyers have been willing to transact at increasingly higher prices.
A downward sloping trail indicates value migrating lower and sellers pushing the center of mass down.
A flat or oscillating trail indicates balance or rotational behaviour, with no clear directional acceptance.
Taken together, you can interpret:
Side profile as "where the volume mass sits", a static pressure field.
PoC trail as "how that mass has moved", the dynamic path of value.
Trend heatmap as a regime overlay
When PoCs are colored by the EMA 12 / 21 spread:
Green PoCs mark segments where the faster EMA is above the slower EMA, that is, a local uptrend regime.
Red PoCs mark segments where the faster EMA is below the slower EMA, that is, a local downtrend regime.
Gray PoCs mark flat or ambiguous trend segments.
This lets you answer questions like:
"Is value migrating higher while the trend regime is also up?" (trend confirming value).
"Is value migrating higher but most PoCs are red?" (value against the prevailing trend).
"Has value started to roll over just as PoCs flip from green to red?" (early regime transition).
Key settings
General Settings
Lookback Bars - how many bars back to use for both the global volume profile and segment profiles.
Number of Bins - how many price bins to split the high to low range into.
Profile Settings
Show Side Profile - toggle the right-hand volume profile on or off.
Profile Width (%) - how wide the largest volume bar is allowed to be in terms of bars.
Base Profile Color - the starting color for profile bars, with transparency.
Show Volume Values - if enabled, print volume and percent for each non-zero bin.
Profile Text Color - color for volume text inside the profile.
PoC Migration Settings
Show PoC Migration - toggle the PoC trail plotting.
Bars per Segment - the number of bars contained in each segment.
Number of Segments - how many segments to build backwards from the current bar.
Horizontal Spacing (bars) - spacing between PoC nodes when drawn. (Used to separate PoCs horizontally.)
Label Every Nth PoC - draw labels at every Nth PoC (0 or 1 to suppress labels).
Right Offset (bars) - horizontal offset to anchor the side profile on the right.
Up PoC Color - color used when a PoC is higher than the previous one, if trend heatmap is off.
Down PoC Color - color used when a PoC is lower than the previous one, if trend heatmap is off.
Flat PoC Color - color used when the PoC is unchanged, if trend heatmap is off.
PoC Label Background - background color for PoC labels.
Trend Heatmap Settings
Color PoCs By Trend (EMA 12 / 21) - when enabled, overrides simple up/down coloring and uses EMA-based trend colors.
Fast EMA - length for the fast EMA.
Slow EMA - length for the slow EMA.
Trend Up Color - color for PoCs in a bullish EMA regime.
Trend Down Color - color for PoCs in a bearish EMA regime.
Trend Flat Color - color for neutral or flat EMA regimes.
Trading applications
1) Value migration and trend confirmation
Use the PoC path to see if value is following price or lagging it:
In a healthy uptrend, price, PoCs, and trend regime should all lean higher.
In a weakening trend, price may still move up, but PoCs flatten or start drifting lower, suggesting fewer participants are accepting the new highs.
In a downtrend, persistent downward PoC migration confirms that sellers are winning the value battle.
2) Identifying acceptance and rejection zones
Combine the side profile with PoC locations:
High volume bins near clustered PoCs mark strong acceptance zones, good areas to watch for re-tests and decision points.
PoCs that quickly jump across low volume areas can indicate rejection and fast repricing between value zones.
High volume zones with mixed PoC colors may signal balance or prolonged negotiation.
3) Structuring entries and exits
Use the map to refine trade location:
Fade trades against value migration are higher risk unless you see clear signs of exhaustion or regime change.
Pullbacks into prior PoC zones in the direction of the current PoC slope can offer higher quality entries.
Stops placed beyond major accepted zones (clusters of PoCs and high volume bins) are less likely to be hit by random noise.
4) Regime transitions
Watch how PoCs behave as the EMA regime changes:
A flip in EMA 12 versus EMA 21, coupled with a turn in PoC slope, is a strong signal that value is beginning to move with the new trend.
If EMAs flip but PoC migration does not follow, the trend signal may be early or false.
A weakening PoC path (lower highs in PoCs) while trend colors are still green can warn of a late-stage trend.
Best practices
Start with a moderate lookback such as 200 to 300 bars and a moderate bin count such as 20 to 40. Too many bins can make the profile overly granular and sparse.
Align "Bars per Segment" with your trading horizon. For example, 5 to 10 bars for intraday, 10 to 20 bars for swing.
Use the profile and PoC trail as structural context rather than as a direct buy or sell signal. Combine with your existing setups for timing.
Pay attention to clusters of PoCs at similar prices. Those are areas where the market has repeatedly accepted value, and they often matter on future tests.
Notes
This is a structural volume tool, not a complete trading system. It does not manage execution, position sizing or risk management. Use it to understand:
Where the bulk of trading has occurred in your chosen window.
How the center of volume has migrated over time.
Whether that migration is aligned with or fighting the current trend regime.
By turning PoC evolution into a visible path and adding a trend-aware heatmap, the PoC Migration Map makes it easier to see how value has been moving, where the market is likely to feel "heavy" or "light", and how that structure fits into your trading decisions.

Algorithm Predator - ML-liteAlgorithm Predator - ML-lite
This indicator combines four specialized trading agents with an adaptive multi-armed bandit selection system to identify high-probability trade setups. It is designed for swing and intraday traders who want systematic signal generation based on institutional order flow patterns , momentum exhaustion , liquidity dynamics , and statistical mean reversion .
Core Architecture
Why These Components Are Combined:
The script addresses a fundamental challenge in algorithmic trading: no single detection method works consistently across all market conditions. By deploying four independent agents and using reinforcement learning algorithms to select or blend their outputs, the system adapts to changing market regimes without manual intervention.
The Four Trading Agents
1. Spoofing Detector Agent 🎭
Detects iceberg orders through persistent volume at similar price levels over 5 bars
Identifies spoofing patterns via asymmetric wick analysis (wicks exceeding 60% of bar range with volume >1.8× average)
Monitors order clustering using simplified Hawkes process intensity tracking (exponential decay model)
Signal Logic: Contrarian—fades false breakouts caused by institutional manipulation
Best Markets: Consolidations, institutional trading windows, low-liquidity hours
2. Exhaustion Detector Agent ⚡
Calculates RSI divergence between price movement and momentum indicator over 5-bar window
Detects VWAP exhaustion (price at 2σ bands with declining volume)
Uses VPIN reversals (volume-based toxic flow dissipation) to identify momentum failure
Signal Logic: Counter-trend—enters when momentum extreme shows weakness
Best Markets: Trending markets reaching climax points, over-extended moves
3. Liquidity Void Detector Agent 💧
Measures Bollinger Band squeeze (width <60% of 50-period average)
Identifies stop hunts via 20-bar high/low penetration with immediate reversal and volume spike
Detects hidden liquidity absorption (volume >2× average with range <0.3× ATR)
Signal Logic: Breakout anticipation—enters after liquidity grab but before main move
Best Markets: Range-bound pre-breakout, volatility compression zones
4. Mean Reversion Agent 📊
Calculates price z-scores relative to 50-period SMA and standard deviation (triggers at ±2σ)
Implements Ornstein-Uhlenbeck process scoring (mean-reverting stochastic model)
Uses entropy analysis to detect algorithmic trading patterns (low entropy <0.25 = high predictability)
Signal Logic: Statistical reversion—enters when price deviates significantly from statistical equilibrium
Best Markets: Range-bound, low-volatility, algorithmically-dominated instruments
Adaptive Selection: Multi-Armed Bandit System
The script implements four reinforcement learning algorithms to dynamically select or blend agents based on performance:
Thompson Sampling (Default - Recommended):
Uses Bayesian inference with beta distributions (tracks alpha/beta parameters per agent)
Balances exploration (trying underused agents) vs. exploitation (using proven winners)
Each agent's win/loss history informs its selection probability
Lite Approximation: Uses pseudo-random sampling from price/volume noise instead of true random number generation
UCB1 (Upper Confidence Bound):
Calculates confidence intervals using: average_reward + sqrt(2 × ln(total_pulls) / agent_pulls)
Deterministic algorithm favoring agents with high uncertainty (potential upside)
More conservative than Thompson Sampling
Epsilon-Greedy:
Exploits best-performing agent (1-ε)% of the time
Explores randomly ε% of the time (default 10%, configurable 1-50%)
Simple, transparent, easily tuned via epsilon parameter
Gradient Bandit:
Uses softmax probability distribution over agent preference weights
Updates weights via gradient ascent based on rewards
Best for Blend mode where all agents contribute
Selection Modes:
Switch Mode: Uses only the selected agent's signal (clean, decisive)
Blend Mode: Combines all agents using exponentially weighted confidence scores controlled by temperature parameter (smooth, diversified)
Lock Agent Feature:
Optional manual override to force one specific agent
Useful after identifying which agent dominates your specific instrument
Only applies in Switch mode
Four choices: Spoofing Detector, Exhaustion Detector, Liquidity Void, Mean Reversion
Memory System
Dual-Layer Architecture:
Short-Term Memory: Stores last 20 trade outcomes per agent (configurable 10-50)
Long-Term Memory: Stores episode averages when short-term reaches transfer threshold (configurable 5-20 bars)
Memory Boost Mechanism: Recent performance modulates agent scores by up to ±20%
Episode Transfer: When an agent accumulates sufficient results, averages are condensed into long-term storage
Persistence: Manual restoration of learned parameters via input fields (alpha, beta, weights, microstructure thresholds)
How Memory Works:
Agent generates signal → outcome tracked after 8 bars (performance horizon)
Result stored in short-term memory (win = 1.0, loss = 0.0)
Short-term average influences agent's future scores (positive feedback loop)
After threshold met (default 10 results), episode averaged into long-term storage
Long-term patterns (weighted 30%) + short-term patterns (weighted 70%) = total memory boost
Market Microstructure Analysis
These advanced metrics quantify institutional order flow dynamics:
Order Flow Toxicity (Simplified VPIN):
Measures buy/sell volume imbalance over 20 bars: |buy_vol - sell_vol| / (buy_vol + sell_vol)
Detects informed trading activity (institutional players with non-public information)
Values >0.4 indicate "toxic flow" (informed traders active)
Lite Approximation: Uses simple open/close heuristic instead of tick-by-tick trade classification
Price Impact Analysis (Simplified Kyle's Lambda):
Measures market impact efficiency: |price_change_10| / sqrt(volume_sum_10)
Low values = large orders with minimal price impact ( stealth accumulation )
High values = retail-dominated moves with high slippage
Lite Approximation: Uses simplified denominator instead of regression-based signed order flow
Market Randomness (Entropy Analysis):
Counts unique price changes over 20 bars / 20
Measures market predictability
High entropy (>0.6) = human-driven, chaotic price action
Low entropy (<0.25) = algorithmic trading dominance (predictable patterns)
Lite Approximation: Simple ratio instead of true Shannon entropy H(X) = -Σ p(x)·log₂(p(x))
Order Clustering (Simplified Hawkes Process):
Tracks self-exciting event intensity (coordinated order activity)
Decays at 0.9× per bar, spikes +1.0 when volume >1.5× average
High intensity (>0.7) indicates clustering (potential spoofing/accumulation)
Lite Approximation: Simple exponential decay instead of full λ(t) = μ + Σ α·exp(-β(t-tᵢ)) with MLE
Signal Generation Process
Multi-Stage Validation:
Stage 1: Agent Scoring
Each agent calculates internal score based on its detection criteria
Scores must exceed agent-specific threshold (adjusted by sensitivity multiplier)
Agent outputs: Signal direction (+1/-1/0) and Confidence level (0.0-1.0)
Stage 2: Memory Boost
Agent scores multiplied by memory boost factor (0.8-1.2 based on recent performance)
Successful agents get amplified, failing agents get dampened
Stage 3: Bandit Selection/Blending
If Adaptive Mode ON:
Switch: Bandit selects single best agent, uses only its signal
Blend: All agents combined using softmax-weighted confidence scores
If Adaptive Mode OFF:
Traditional consensus voting with confidence-squared weighting
Signal fires when consensus exceeds threshold (default 70%)
Stage 4: Confirmation Filter
Raw signal must repeat for consecutive bars (default 3, configurable 2-4)
Minimum confidence threshold: 0.25 (25%) enforced regardless of mode
Trend alignment check: Long signals require trend_score ≥ -2, Short signals require trend_score ≤ 2
Stage 5: Cooldown Enforcement
Minimum bars between signals (default 10, configurable 5-15)
Prevents over-trading during choppy conditions
Stage 6: Performance Tracking
After 8 bars (performance horizon), signal outcome evaluated
Win = price moved in signal direction, Loss = price moved against
Results fed back into memory and bandit statistics
Trading Modes (Presets)
Pre-configured parameter sets:
Conservative: 85% consensus, 4 confirmations, 15-bar cooldown
Expected: 60-70% win rate, 3-8 signals/week
Best for: Swing trading, capital preservation, beginners
Balanced: 70% consensus, 3 confirmations, 10-bar cooldown
Expected: 55-65% win rate, 8-15 signals/week
Best for: Day trading, most traders, general use
Aggressive: 60% consensus, 2 confirmations, 5-bar cooldown
Expected: 50-58% win rate, 15-30 signals/week
Best for: Scalping, high-frequency trading, active management
Elite: 75% consensus, 3 confirmations, 12-bar cooldown
Expected: 58-68% win rate, 5-12 signals/week
Best for: Selective trading, high-conviction setups
Adaptive: 65% consensus, 2 confirmations, 8-bar cooldown
Expected: Varies based on learning
Best for: Experienced users leveraging bandit system
How to Use
1. Initial Setup (5 Minutes):
Select Trading Mode matching your style (start with Balanced)
Enable Adaptive Learning (recommended for automatic agent selection)
Choose Thompson Sampling algorithm (best all-around performance)
Keep Microstructure Metrics enabled for liquid instruments (>100k daily volume)
2. Agent Tuning (Optional):
Adjust Agent Sensitivity multipliers (0.5-2.0):
<0.8 = Highly selective (fewer signals, higher quality)
0.9-1.2 = Balanced (recommended starting point)
1.3 = Aggressive (more signals, lower individual quality)
Monitor dashboard for 20-30 signals to identify dominant agent
If one agent consistently outperforms, consider using Lock Agent feature
3. Bandit Configuration (Advanced):
Blend Temperature (0.1-2.0):
0.3 = Sharp decisions (best agent dominates)
0.5 = Balanced (default)
1.0+ = Smooth (equal weighting, democratic)
Memory Decay (0.8-0.99):
0.90 = Fast adaptation (volatile markets)
0.95 = Balanced (most instruments)
0.97+ = Long memory (stable trends)
4. Signal Interpretation:
Green triangle (▲): Long signal confirmed
Red triangle (▼): Short signal confirmed
Dashboard shows:
Active agent (highlighted row with ► marker)
Win rate per agent (green >60%, yellow 40-60%, red <40%)
Confidence bars (█████ = maximum confidence)
Memory size (short-term buffer count)
Colored zones display:
Entry level (current close)
Stop-loss (1.5× ATR)
Take-profit 1 (2.0× ATR)
Take-profit 2 (3.5× ATR)
5. Risk Management:
Never risk >1-2% per signal (use ATR-based stops)
Signals are entry triggers, not complete strategies
Combine with your own market context analysis
Consider fundamental catalysts and news events
Use "Confirming" status to prepare entries (not to enter early)
6. Memory Persistence (Optional):
After 50-100 trades, check Memory Export Panel
Record displayed alpha/beta/weight values for each agent
Record VPIN and Kyle threshold values
Enable "Restore From Memory" and input saved values to continue learning
Useful when switching timeframes or restarting indicator
Visual Components
On-Chart Elements:
Spectral Layers: EMA8 ± 0.5 ATR bands (dynamic support/resistance, colored by trend)
Energy Radiance: Multi-layer glow boxes at signal points (intensity scales with confidence, configurable 1-5 layers)
Probability Cones: Projected price paths with uncertainty wedges (15-bar projection, width = confidence × ATR)
Connection Lines: Links sequential signals (solid = same direction continuation, dotted = reversal)
Kill Zones: Risk/reward boxes showing entry, stop-loss, and dual take-profit targets
Signal Markers: Triangle up/down at validated entry points
Dashboard (Configurable Position & Size):
Regime Indicator: 4-level trend classification (Strong Bull/Bear, Weak Bull/Bear)
Mode Status: Shows active system (Adaptive Blend, Locked Agent, or Consensus)
Agent Performance Table: Real-time win%, confidence, and memory stats
Order Flow Metrics: Toxicity and impact indicators (when microstructure enabled)
Signal Status: Current state (Long/Short/Confirming/Waiting) with confirmation progress
Memory Panel (Configurable Position & Size):
Live Parameter Export: Alpha, beta, and weight values per agent
Adaptive Thresholds: Current VPIN sensitivity and Kyle threshold
Save Reminder: Visual indicator if parameters should be recorded
What Makes This Original
This script's originality lies in three key innovations:
1. Genuine Meta-Learning Framework:
Unlike traditional indicator mashups that simply display multiple signals, this implements authentic reinforcement learning (multi-armed bandits) to learn which detection method works best in current conditions. The Thompson Sampling implementation with beta distribution tracking (alpha for successes, beta for failures) is statistically rigorous and adapts continuously. This is not post-hoc optimization—it's real-time learning.
2. Episodic Memory Architecture with Transfer Learning:
The dual-layer memory system mimics human learning patterns:
Short-term memory captures recent performance (recency bias)
Long-term memory preserves historical patterns (experience)
Automatic transfer mechanism consolidates knowledge
Memory boost creates positive feedback loops (successful strategies become stronger)
This architecture allows the system to adapt without retraining , unlike static ML models that require batch updates.
3. Institutional Microstructure Integration:
Combines retail-focused technical analysis (RSI, Bollinger Bands, VWAP) with institutional-grade microstructure metrics (VPIN, Kyle's Lambda, Hawkes processes) typically found in academic finance literature and professional trading systems, not standard retail platforms. While simplified for Pine Script constraints, these metrics provide insight into informed vs. uninformed trading , a dimension entirely absent from traditional technical analysis.
Mashup Justification:
The four agents are combined specifically for risk diversification across failure modes:
Spoofing Detector: Prevents false breakout losses from manipulation
Exhaustion Detector: Prevents chasing extended trends into reversals
Liquidity Void: Exploits volatility compression (different regime than trending)
Mean Reversion: Provides mathematical anchoring when patterns fail
The bandit system ensures the optimal tool is automatically selected for each market situation, rather than requiring manual interpretation of conflicting signals.
Why "ML-lite"? Simplifications and Approximations
This is the "lite" version due to necessary simplifications for Pine Script execution:
1. Simplified VPIN Calculation:
Academic Implementation: True VPIN uses volume bucketing (fixed-volume bars) and tick-by-tick buy/sell classification via Lee-Ready algorithm or exchange-provided trade direction flags
This Implementation: 20-bar rolling window with simple open/close heuristic (close > open = buy volume)
Impact: May misclassify volume during ranging/choppy markets; works best in directional moves
2. Pseudo-Random Sampling:
Academic Implementation: Thompson Sampling requires true random number generation from beta distributions using inverse transform sampling or acceptance-rejection methods
This Implementation: Deterministic pseudo-randomness derived from price and volume decimal digits: (close × 100 - floor(close × 100)) + (volume % 100) / 100
Impact: Not cryptographically random; may have subtle biases in specific price ranges; provides sufficient variation for agent selection
3. Hawkes Process Approximation:
Academic Implementation: Full Hawkes process uses maximum likelihood estimation with exponential kernels: λ(t) = μ + Σ α·exp(-β(t-tᵢ)) fitted via iterative optimization
This Implementation: Simple exponential decay (0.9 multiplier) with binary event triggers (volume spike = event)
Impact: Captures self-exciting property but lacks parameter optimization; fixed decay rate may not suit all instruments
4. Kyle's Lambda Simplification:
Academic Implementation: Estimated via regression of price impact on signed order flow over multiple time intervals: Δp = λ × Δv + ε
This Implementation: Simplified ratio: price_change / sqrt(volume_sum) without proper signed order flow or regression
Impact: Provides directional indicator of impact but not true market depth measurement; no statistical confidence intervals
5. Entropy Calculation:
Academic Implementation: True Shannon entropy requires probability distribution: H(X) = -Σ p(x)·log₂(p(x)) where p(x) is probability of each price change magnitude
This Implementation: Simple ratio of unique price changes to total observations (variety measure)
Impact: Measures diversity but not true information entropy with probability weighting; less sensitive to distribution shape
6. Memory System Constraints:
Full ML Implementation: Neural networks with backpropagation, experience replay buffers (storing state-action-reward tuples), gradient descent optimization, and eligibility traces
This Implementation: Fixed-size array queues with simple averaging; no gradient-based learning, no state representation beyond raw scores
Impact: Cannot learn complex non-linear patterns; limited to linear performance tracking
7. Limited Feature Engineering:
Advanced Implementation: Dozens of engineered features, polynomial interactions (x², x³), dimensionality reduction (PCA, autoencoders), feature selection algorithms
This Implementation: Raw agent scores and basic market metrics (RSI, ATR, volume ratio); minimal transformation
Impact: May miss subtle cross-feature interactions; relies on agent-level intelligence rather than feature combinations
8. Single-Instrument Data:
Full Implementation: Multi-asset correlation analysis (sector ETFs, currency pairs, volatility indices like VIX), lead-lag relationships, risk-on/risk-off regimes
This Implementation: Only OHLCV data from displayed instrument
Impact: Cannot incorporate broader market context; vulnerable to correlated moves across assets
9. Fixed Performance Horizon:
Full Implementation: Adaptive horizon based on trade duration, volatility regime, or profit target achievement
This Implementation: Fixed 8-bar evaluation window
Impact: May evaluate too early in slow markets or too late in fast markets; one-size-fits-all approach
Performance Impact Summary:
These simplifications make the script:
✅ Faster: Executes in milliseconds vs. seconds (or minutes) for full academic implementations
✅ More Accessible: Runs on any TradingView plan without external data feeds, APIs, or compute servers
✅ More Transparent: All calculations visible in Pine Script (no black-box compiled models)
✅ Lower Resource Usage: <500 bars lookback, minimal memory footprint
⚠️ Less Precise: Approximations may reduce statistical edge by 5-15% vs. academic implementations
⚠️ Limited Scope: Cannot capture tick-level dynamics, multi-order-book interactions, or cross-asset flows
⚠️ Fixed Parameters: Some thresholds hardcoded rather than dynamically optimized
When to Upgrade to Full Implementation:
Consider professional Python/C++ versions with institutional data feeds if:
Trading with >$100K capital where precision differences materially impact returns
Operating in microsecond-competitive environments (HFT, market making)
Requiring regulatory-grade audit trails and reproducibility
Backtesting with tick-level precision for strategy validation
Need true real-time adaptation with neural network-based learning
For retail swing/day trading and position management, these approximations provide sufficient signal quality while maintaining usability, transparency, and accessibility. The core logic—multi-agent detection with adaptive selection—remains intact.
Technical Notes
All calculations use standard Pine Script built-in functions ( ta.ema, ta.atr, ta.rsi, ta.bb, ta.sma, ta.stdev, ta.vwap )
VPIN and Kyle's Lambda use simplified formulas optimized for OHLCV data (see "Lite" section above)
Thompson Sampling uses pseudo-random noise from price/volume decimal digits for beta distribution sampling
No repainting: All calculations use confirmed bar data (no forward-looking)
Maximum lookback: 500 bars (set via max_bars_back parameter)
Performance evaluation: 8-bar forward-looking window for reward calculation (clearly disclosed)
Confidence threshold: Minimum 0.25 (25%) enforced on all signals
Memory arrays: Dynamic sizing with FIFO queue management
Limitations and Disclaimers
Not Predictive: This indicator identifies patterns in historical data. It cannot predict future price movements with certainty.
Requires Human Judgment: Signals are entry triggers, not complete trading strategies. Must be confirmed with your own analysis, risk management rules, and market context.
Learning Period Required: The adaptive system requires 50-100 bars minimum to build statistically meaningful performance data for bandit algorithms.
Overfitting Risk: Restoring memory parameters from one market regime to a drastically different regime (e.g., low volatility to high volatility) may cause poor initial performance until system re-adapts.
Approximation Limitations: Simplified calculations (see "Lite" section) may underperform academic implementations by 5-15% in highly efficient markets.
No Guarantee of Profit: Past performance, whether backtested or live-traded, does not guarantee future performance. All trading involves risk of loss.
Forward-Looking Bias: Performance evaluation uses 8-bar forward window—this creates slight look-ahead for learning (though not for signals). Real-time performance may differ from indicator's internal statistics.
Single-Instrument Limitation: Does not account for correlations with related assets or broader market regime changes.
Recommended Settings
Timeframe: 15-minute to 4-hour charts (sufficient volatility for ATR-based stops; adequate bar volume for learning)
Assets: Liquid instruments with >100k daily volume (forex majors, large-cap stocks, BTC/ETH, major indices)
Not Recommended: Illiquid small-caps, penny stocks, low-volume altcoins (microstructure metrics unreliable)
Complementary Tools: Volume profile, order book depth, market breadth indicators, fundamental catalysts
Position Sizing: Risk no more than 1-2% of capital per signal using ATR-based stop-loss
Signal Filtering: Consider external confluence (support/resistance, trendlines, round numbers, session opens)
Start With: Balanced mode, Thompson Sampling, Blend mode, default agent sensitivities (1.0)
After 30+ Signals: Review agent win rates, consider increasing sensitivity of top performers or locking to dominant agent
Alert Configuration
The script includes built-in alert conditions:
Long Signal: Fires when validated long entry confirmed
Short Signal: Fires when validated short entry confirmed
Alerts fire once per bar (after confirmation requirements met)
Set alert to "Once Per Bar Close" for reliability
Taking you to school. — Dskyz, Trade with insight. Trade with anticipation.

Magic Volume - Projected [MW]Magic Volume – Projected
This lower-pane volume tool estimates the full-bar volume before the bar closes by measuring the current bar’s elapsed time and the rate of incoming volume. It then contrasts that “expected volume” against typical activity and recent momentum to spotlight potential burst conditions (breakout/acceleration), color-codes the live volume stream, and annotates when the projected surge is likely bullish or bearish based on bar structure and recent highs/lows.
Settings
Projected / Expected Volume
Moving Average: EMA length used for volume baseline comparisons. (Default: 14)
Minimum Volume: Hard floor the bar’s raw volume must exceed to qualify as notable. (Default: 10,000)
Consecutive Volume Above 14 EMA: Count required for “sustained” high-volume context. (Default: 3)
Stochastic Volume Burst
Stochastic Length: Window for the Stochastic calculation on volume. (Default: 8)
Smoothing: Smoothing applied to Stochastic volume and its signal. (Default: 3)
Stochastic Volume Breakout Threshold: Level above which Stochastic volume is considered a breakout. (Default: 20)
Volume Bar Increase Amount: Multiplier the current bar’s volume must exceed vs. prior bar to be considered a “burst.” (Default: 1.618)
Plotted Items
Expected Volume (columns): Magenta columns projecting the full-bar volume from intrabar rate. Turns lime when a high expected-volume condition aligns with bullish bar structure; turns red under analogous bearish conditions.
Actual Volume (columns): Live volume columns, color-coded by state:
• Blue = baseline;
• Orange = “burst” (volume rising fast above prior × factor and above baseline);
• Yellow = “burst at breakout” (burst + Stochastic volume breakout);
• Light Blue = Stochastic breakout only.
Volume EMA (line): Yellow EMA for baseline comparison (default 14).
Calculations
Compute elapsed time in the current bar (ms → seconds) and convert the current bar’s accumulated volume into a rate (volume per second).
Project full-bar Expected Volume = (volume so far / seconds elapsed) × bar-seconds.
Compute Volume EMA (default 14) for baseline; derive Stochastic(volume, length) and smoothed signal for momentum.
Define “Burst” conditions:
• Volume > prior volume × Volume Bar Increase Amount;
• Volume > Minimum Volume;
• Volume > Volume EMA;
• Stochastic(volume) rising and/or above threshold.
Classify “Burst at Breakout” when Burst aligns with Stochastic crossover above the Breakout Threshold.
Classify Bullish/Bearish Expected Volume: if Expected Volume is ≥ 1.618 × prior bar volume and prior volume > Volume EMA, then:
• Bullish if bar is green with a rising low;
• Bearish if bar is red with a falling high.
Color-map actual volume columns by state; overlay Expected Volume columns (magenta) and paint conditional overlays (lime/red) when directional context is detected.
How to Use
Spot the Surge Early
When Expected Volume spikes well above typical (and especially above ~1.618× the prior bar) before the bar closes, it often precedes a volatile move. Use this to prepare entries with tight, structure-based risk (e.g., just beyond the current bar’s wick) and asymmetric targets.
Confirm with Momentum
Yellow/orange volume columns indicate burst/breakout behavior in the live tape. When this aligns with a lime (bullish) or red (bearish) Expected Volume column, the probability of follow-through improves—particularly if aligned with prevailing trend or key levels.
Context Matters
Combine with your preferred S/R or structure tools (e.g., order blocks, channels, VWAP) to avoid chasing into obvious supply/demand. The projected surge can mark both continuations and sharp reversals depending on location and broader context.
Alerts
High Expected Volume – Bullish: When projected volume surges and the price action meets bullish conditions (green body with rising low).
High Expected Volume – Bearish: When projected volume surges and the price action meets bearish conditions (red body with falling high).
Other Usage Notes and Limitations
Projected volume depends on intrabar pace; abrupt pauses/flushes can change the projection quickly, especially on very small timeframes.
Minimum Volume and EMA baselines help filter thin markets; adjust upward on illiquid symbols to reduce noise.
A rising projection does not pick direction on its own—directional coloring (lime/red) requires price-action confirmation; otherwise treat magenta projections as “heads-up” only.
As with any single indicator, use within a broader plan (risk management, structure, confluence) to mitigate false positives and improve selectivity.
Inputs (Quick Reference)
Moving Average (int, default 14)
Stochastic Length (int, default 8)
Smoothing (int, default 3)
Stochastic Volume Breakout Threshold (int, default 20)
Volume Bar Increase Amount (float, default 1.618)
Minimum Volume (int, default 10,000)
Consecutive Volume Above 14 EMA (int, default 3)

Volume Delta Trailing Stop [LuxAlgo]The ' Volume Delta Trailing Stop ' indicator uses Lower Time Frame (LTF) volume delta data which can provide potential entries together with a Volume-Delta based Trailing Stop-line .
🔶 USAGE
Our 'Volume Delta Trailing Stop' script can show potential entries/Stop Loss lines
A trigger line needs to be broken before a position is taken, after which a Volume Delta-controlled Trailing Stop-line is created:
🔶 DETAILS
🔹 Volume rises when bought or sold
🔹 When the opening price appears on the chart, a buy/sell order has been executed.
If that order is less than the available supply of that particular price, volume will rise, without moving the price.
🔹 When the opening price is the same as the closing price, the volume of that bar can be seen as "neutral volume" (nV); nor "up", nor "down" volume.
Example
A buy order doesn't fill the first available supply in the order book. This price will be the opening price with a certain volume.
When at closing time, price still hasn't moved (the first available supply in the order book isn't filled, or no movement downwards),
the closing price will be equal to the opening price, but with volume. This can be seen as "neutral volume (nV)".
🔹 Delta Volume (ΔV): this is "up volume" minus "down volume"
🔹 Standard volume is colored red when closing price is lower than opening price ( = "down volume").
🔹 Standard volume is colored green when closing price is higher OR equal (nV) than opening price ( = "up volume").
🔹 Neutral Volume
The "Neutral-Volume" is considered "Up-Volume" - setting will dictate whether nV is considered as green 'buy' volume or not.
🔶 EXAMPLE
29 July 10:00 -> 10:05, chart timeframe 5 minutes, open 29311.28, close 29313.89
close > open, so the volume (39.55) is colored green ("up volume").
(The Volume script used in the following examples is the open-source publication Volume Columns w. Alerts (V) from LucF )
Let's zoom to the 1-minute TF:
The same period is now divided into more bars, volume direction (color) is dependable on the difference between open and close.
Counting up and down volume gives a more detailed result, it remains in an upward direction though):
(ΔV = +15.51)
Let's further zoom in to the 1-second TF:
The same period is now divided into even more bars (more possibility for changing direction on each bar)
Here we see several bars that haven't moved in price, but they have volume ("neutral" volume).
(neutral volume is coloured light green here, while up volume is coloured darker green)
When we count all green and red volume bars, the result is quite different:
(ΔV = -0.35)
In total more volume is found when price went downwards, yet price went up in these 5 minutes.
-> This is the heart of our publication, when this divergence occurs, you can see a barcolor changement:
• orange: when price went up, but LTF Volume was mainly in a downward direction.
• blue: when price went down, but LTF Volume was mainly in an upwards direction.
When we split the green "up volume" into "up" and "neutral", the difference is even higher
(here "neutral volume" is colored grey):
(ΔV = -12.76; "up" - "down")
🔶 CONCEPTS
bullishBear = current bar is red but LTF volume is in upward direction -> blue bar
bearishBull = current bar is green but LTF volume is in downward direction -> orange bar
🔹 Potential positioning - forming of Trigger-line
When not in position, the script will wait for a divergence between price and volume direction. When found, a Trigger-line will appear:
• at high when a blue bar appears ( bullishBear ).
• at low when an orange bar appears ( bearishBull ).
Next step is when the Trigger-line is broken by close or high/low (settings: Trigger )
Here, the closing price went under the grey Trigger-line -> bearish position:
🔹 Trailing Stop-line
When the Trigger-line is broken, the Trailing Stop-line (TS-line) will start:
• low when bullish position
• high when bearish position
You can choose (settings -> Trigger -> Close or H/L ) whether close price or high/low should break the Trigger-line
When alerts are enabled ("Any alert() function call"), you'll get the following message:
• ' signal up ' when bullish position
• ' signal down' when bearish position
After that, the TS-line will be adjusted when:
• a blue bullishBear bar appears when in bullish position -> lowest of {low , previous blue bar's high or orange bar's low}
• an orange bearishBull bar appears when in bearish position -> highest of {high, previous blue bar's high or orange bar's low}
When alerts are enabled ("Any alert() function call"), and the TS-line is broken, you'll get the following message:
• ' TS-line broken down ' when out bullish position
• ' TS-line broken up ' when out bearish position
🔹 Reference Point
Default the direction of price will be evaluated by comparing closing price with opening price.
When open and close are the same, you'll get "neutral volume".
You can use "previous close" instead (as in built-in volume indicator) to include gaps.
If close equals open , but close is lower than previous close , it will be regarded as " down volume ",
similar, when close is higher than previous close , it will be regarded as " up volume "
Note, the setting applies for the current timeframe AND Lower timeframe:
Based on: " open " (close - open)
Based on: " previous close " (close - previous close)
🔹 Adjustment
When the TS-line changes, this can be adjusted with a percentage of price , or a multiple of " True Range "
Default (Δ line -> Adjustment - 0)
Δ line -> Adjustment 0.03% (of price)
Δ line -> Mult of TR (10)
🔶 SETTINGS
🔹 LTF: choose your Lower TimeFrame: 1S (seconds), 5S, 10S, 15S, 30S, 1 minute)
🔹 Trigger: Choose the trigger for breaking the Trigger-line ; close or H/L (high when bullish position, low when bearish position)
🔹 Δ line ( Trailing Stop-line ): add/subtract an adjustment when the TS-line changes ( default: Adjustment ):
• Adjustment ( default: 0 ): add/subtract an extra % of price
• Mult of TR : add/subtract a multiple of True Range
🔹 Based on: compare closing price against:
• open
• previous close
🔹 "Neutral-Volume" is considered "Up-Volume" : this setting will dictate whether nV is considered as green 'buy' volume or not.
🔶 CONSIDERATIONS
🔹 The lowest LTF (1S) will give you more detail and will get data close to tick data.
However, a maximum of 100,000 intrabars can be used in calculations .
This means on the daily chart you won't see anything since 1 day ~ 86400 seconds. (just over 1 bar)
-> choose a lower chart timeframe, or choose a higher LTF (5S, 10S, ... 1 minute)
🔹 Always choose a LTF lower than the current chart timeframe.
🔹 Pine Script™ code using this request.security_lower_tf() may calculate differently on historical and real-time bars, leading to repainting .

Volume Profile VisionVolume Profile Vision - Complete Description
Overview
Volume Profile Vision (VPV) is an advanced volume profile indicator that visualizes where trading activity has occurred at different price levels over a specified time period. Unlike traditional volume indicators that show volume over time, this indicator displays volume distribution across price levels, helping traders identify key support/resistance zones, fair value areas, and potential reversal points.
What Makes This Indicator Original
Volume Profile Vision introduces several unique features not found in standard volume profile tools:
Dual-Direction Histogram Display:
Unlike conventional volume profiles that only show bars extending in one direction, VPV displays volume bars extending both left (into historical candles) and right (as a traditional histogram). This bi-directional approach allows traders to see exactly where historical price action intersected with high-volume nodes.
Real-Time Candle Highlighting: The indicator dynamically highlights volume bars that intersect with the current candle's price range, making it immediately obvious which volume levels are currently in play.
Four Professional Color Schemes: Each color scheme uses distinct gradient algorithms and visual encoding systems:
Traffic Light: Uses red (POC), green (VA boundaries), yellow (HVN), with grayscale gradients outside the value area
Aurora Glass: Modern cyan-to-magenta gradient with hot magenta POC highlighting
Obsidian Precision: Professional dark theme with white POC and electric cyan accents
Black Ice: Monochromatic cyan family with graduated intensity
Adaptive Transparency System: Automatically adjusts bar transparency based on position relative to value area, with special handling for each color scheme to maintain visual clarity.
Core Concepts & Calculations
Volume Distribution Analysis
The indicator divides the visible price range into user-defined price levels (default: 80 levels) and calculates the total volume traded at each level by:
Scanning back through the specified lookback period (customizable or visible range)
For each historical bar, determining which price levels the bar's high/low range intersects
Accumulating volume for each intersected price level
Optionally filtering by bullish/bearish volume only
Point of Control (POC)
The POC is the price level with the highest traded volume during the analyzed period. This represents the "fairest" price where most traders agreed on value. The indicator marks this with distinct coloring (red in Traffic Light, magenta in Aurora Glass, white in Obsidian Precision, cyan in Black Ice).
Trading Significance: POC acts as a strong magnet for price - markets tend to return to fair value. When price is away from POC, traders watch for:
Mean reversion opportunities when price is far from POC
Rejection signals when price tests POC from above/below
Breakout confirmation when price breaks through and holds beyond POC
Value Area (VA)
The Value Area encompasses the price range where a specified percentage (default: 68%) of all volume traded. This represents the range of "accepted value" by market participants.
Calculation Method:
Start at the POC (highest volume level)
Expand upward and downward, adding adjacent price levels
Always add the level with higher volume next
Continue until accumulated volume reaches the VA percentage threshold
Value Area High (VAH): Upper boundary of accepted value - acts as resistance
Value Area Low (VAL): Lower boundary of accepted value - acts as support
Trading Significance:
Price spending time inside VA indicates market equilibrium
Breakouts above VAH suggest bullish momentum shift
Breakdowns below VAL suggest bearish momentum shift
Returns to VA boundaries often provide high-probability entry zones
High Volume Nodes (HVN)
Price levels with volume exceeding a threshold percentage (default: 80%) of POC volume. These represent areas of strong agreement and consolidation.
Trading Significance:
HVNs act as strong support/resistance zones
Price tends to consolidate at HVNs before making directional moves
Breaking through an HVN often signals strong momentum
Low Volume Nodes (LVN)
Price levels within the Value Area with volume ≤30% of POC volume. These are zones price moved through quickly with minimal consolidation.
Trading Significance:
LVNs represent areas of rejection - price finds little acceptance
Price tends to move rapidly through LVN zones
Useful for setting stop-losses (below LVN for longs, above for shorts)
Can identify potential gaps or "air pockets" in the market structure
Grayscale POC Detection
A secondary POC detection system identifies the highest volume level outside the Value Area (with a 2-level buffer to avoid confusion). This helps identify significant volume accumulation zones that exist beyond the main value area.
How to Use This Indicator
Setup
Choose Lookback Period:
Enable "Use Visible Range" to analyze only what's on your chart
Or set "Fixed Range Lookback Depth" (default: 200 bars) for consistent analysis
Adjust Profile Resolution:
"Number of Price Levels" (default: 80) - higher = more granular analysis, lower = broader zones
Select Color Scheme:
Traffic Light: Best for clear POC/VA/HVN identification
Aurora Glass: Modern aesthetic for dark charts
Obsidian Precision: Professional trader preference
Black Ice: Minimalist single-color family
Visual Customization
Left Extension: How far back the left-side histogram extends into historical candles (default: 490 bars)
Right Extension: Width of the traditional histogram bars on the right (default: 50 bars)
Right Margin: Space between current price bar and histogram (default: 0 for flush alignment)
Left Profile Gap: Space between left-side histogram and candles (default: 0)
Trading Strategies
Strategy 1: Value Area Mean Reversion
Wait for price to move outside the Value Area (above VAH or below VAL)
Look for rejection signals (wicks, bearish/bullish candles)
Enter trades toward the POC
Take profits as price returns to POC or opposite VA boundary
Strategy 2: Breakout Confirmation
Identify when price is consolidating within the Value Area
Wait for a strong close above VAH (bullish) or below VAL (bearish)
Enter on the breakout or on first pullback to the VA boundary
Target previous HVNs or swing highs/lows outside the VA
Strategy 3: POC Support/Resistance
Watch for price approaching the POC level
If approaching from below, look for bullish reversal patterns at POC (support)
If approaching from above, look for bearish reversal patterns at POC (resistance)
Trade in the direction of the bounce with stops beyond the POC
Strategy 4: LVN Fast Movement Zones
Identify LVN zones within the Value Area (marked with "LVN" label)
When price enters an LVN, expect rapid movement through the zone
Avoid entering trades within LVNs
Use LVNs as confirmation of directional momentum
Alert System
The indicator includes 7 customizable alert conditions:
POC Touch: Alerts when price comes within 0.5 ATR of POC
VAH/VAL Touch: Alerts at Value Area boundaries
VA Breakout: Alerts on breakouts above VAH or below VAL
HVN Touch: Alerts when price contacts High Volume Nodes
LVN Entry: Alerts when entering Low Volume zones
POC Shift: Alerts when POC moves to a new price level
Reading the Profile
Price Labels (shown on the right side):
POC: Point of Control - highest volume price level
VAH: Value Area High - upper boundary of accepted value
VAL: Value Area Low - lower boundary of accepted value
LVN: Low Volume Node - expect fast movement through this zone
Color Intensity Interpretation:
Brighter colors = higher volume concentration
Dimmer colors = lower volume
Abrupt color changes = transition between volume zones
Gaps in the histogram = price levels with no trading activity
Technical Details
Volume Accumulation Logic:
For each bar in lookback period:
For each price level:
If bar's high/low range intersects price level:
Add bar's volume to that price level's total
Gradient Algorithm:
Traffic Light: Dual-range piecewise gradient (0-50% and 50-100% volume intensity)
Aurora Glass: Linear cyan-to-magenta interpolation
Obsidian Precision: Dark blue gradient with cyan highlights
Black Ice: Three-stage cyan intensity progression
Real-Time Updates:
The profile recalculates on every bar, including real-time tick data, ensuring the volume distribution always reflects current market structure.
Best Practices
Timeframe Selection: Use higher timeframes (4H, Daily) for swing trading, lower timeframes (5min, 15min) for day trading
Combine with Price Action: Volume profile shows WHERE, price action shows WHEN
Multiple Timeframe Analysis: Check daily VP for major levels, then drill down to intraday for entries
Volume Type Selection: Use "Bullish" volume in uptrends, "Bearish" in downtrends, or "Both" for complete picture
Adjust VA Percentage: 68% (default) captures one standard deviation; try 70% for tighter or 60% for broader value areas
Performance Notes
Maximum bars back: 5000 (handles deep historical analysis)
Maximum boxes: 500 (handles complex profiles)
Optimized calculation: Only recalculates on last bar for efficiency
Real-time capable: Updates as new ticks arrive

Dobrusky Pressure CoreWhat it does & who it’s for
Dobrusky Pressure Core is a volume by time replacement for traders who care about which side actually controls each bar. Instead of just plotting total volume, it splits each bar into estimated buy vs sell pressure and overlays a custom, session-aware volume baseline. It’s built for discretionary traders who want more nuanced volume context for entries, breakouts, and pullbacks.
Core ideas
Buy/sell pressure split: Each bar’s volume is broken into estimated buying and selling pressure.
Dominant side highlighting: The dominant side (buy or sell) is always displayed starting from the bottom of the bar, so you can quickly see who “owned” that bar.
Median-based baseline: Uses the median of the last N bars (50 by default) to build a robust volume baseline that’s less sensitive to one-off spikes.
Session-aware behavior: Baseline is calculated from Regular Trading Hours (RTH) by default, with an option to include Extended Hours (ETH) and a control to force Regular data on higher timeframes.
Volume regimes: Three multipliers (1x, 1.5x, 2x by default) show normal, high, and extreme volume regions.
Flexible display: Baseline can be shown as lines or as columns behind the volume, with full color customization.
How the pressure logic works
For each bar, the script:
Adjusts the range for gaps relative to the prior close so the “true” traded range is more consistent.
Computes buy pressure as a proportion of the adjusted range from low to close.
Defines sell pressure as: total volume minus buy pressure.
Marks the bar as buy-dominant if buy pressure ≥ sell pressure, otherwise sell-dominant, and colors the dominant side from the bottom to at least the midpoint using the selected buy/sell colors.
In practice, this turns basic volume columns into bars where the internal split and dominant side are clearly visible, helping you judge whether aggressive buyers or sellers truly controlled the bar instead of just looking at the price action.
Volume baseline & session logic
The script builds a session-aware baseline from recent volume:
Baseline length: A rolling window (default 50 bars) is used to compute a median volume value instead of a simple moving average.
RTH-only by default: By default, the baseline is built from Regular Trading Hours bars only. During extended hours, the baseline effectively “freezes” at the last RTH-derived value unless you choose to include extended session data.
Extended mode: If you select Extended mode, the script builds separate rolling baselines for RTH and ETH trading, using the appropriate one depending on the current session.
Force Regular Above Timeframe: On timeframes equal to or higher than your chosen threshold, the baseline automatically uses Regular session data, even if Extended is selected.
Multipliers: Three adjustable multipliers (1x, 1.5x, 2x by default) create normal, high, and extreme volume bands for quick identification.
This lets you choose whether you want a pure RTH reference or a baseline that adapts to extended-session activity.
Example ways to use it
1. Replace standard volume bars
Add Dobrusky Pressure Core to your volume pane and hide the default volume if you prefer a clean look.
Use the colors and split to see at a glance whether buyers or sellers were dominant on each bar.
2. Pressure confirmation for entries
For longs (example concept; adapt to your own rules):
Require that the entry bar’s buy pressure is greater than the previous bar’s sell pressure , or
If the entry and prior bar are both buy-dominant, require that the entry bar has more buy pressure than the prior bar.
This helps avoid taking a long when buying pressure is clearly fading relative to what sellers recently showed. A mirrored idea can be used for short setups with sell pressure.
3. Context from baseline multipliers
Use ~1x baseline as “normal” volume.
Watch for bars at or above 1.5x baseline when you want to see increased participation.
Treat 2x baseline and above as “extreme” volume zones that may mark climactic or especially important bars.
In practice, the baseline and multipliers are best used as context and filters, not as rigid rules.
Settings overview
Display
- Show Volume Baseline: toggle the baseline and its levels on or off.
- Baseline Display: choose between Line or Bars for the baseline visualization.
Baseline Calculation
- Length: lookback for the median baseline (default 50, configurable).
- Baseline Session Data: choose Regular or Extended to control which session data feeds the baseline.
Session Controls
- Regular Session (Local to TZ): define your RTH window (e.g., 0930-1600).
- Session Time Zone: choose the time zone used for that window.
- Force Regular Above Timeframe: on higher timeframes, force the baseline to use Regular session data only.
Baseline Levels
- Show Level x Multiplier 1/2/3: toggle each volume regime level.
- Multiplier 1/2/3: define what you consider normal, high, and extreme volume (defaults: 1.0, 1.5, 2.0).
Colors
- Buy Volume / Sell Volume: choose colors for buy and sell pressure.
- Baseline Bars (Base / x2 / x3): colors when the baseline is drawn as columns.
- Baseline Line (Base / x2 / x3): colors when the baseline is drawn as lines.
Limitations & best practices
This is a decision-support and visualization tool, not a buy/sell signal generator.
Best suited to markets where volume data is meaningful (e.g., index futures, liquid equities, liquid crypto).
The usefulness of any volume-based metric depends on the underlying data feed and instrument structure.
Always combine pressure and baseline context with your own strategy, risk management, and testing.
Originality
Most volume tools either show total volume only or compare it to a simple moving average. Dobrusky Pressure Core combines:
An intrabar buy/sell pressure split based on a gap-adjusted price range.
A median-based, configurable baseline built from session-specific data.
Session-aware behavior that keeps the baseline focused on Regular hours by default, with the option to incorporate Extended hours and force Regular data on higher timeframes.
The goal is to give traders a richer, session-aware view of participation and pressure that standard volume bars and simple SMA overlays don’t provide, while keeping everything transparent and open-source so users can review and adapt the logic.

Smart MACD Volume Trader# Smart MACD Volume Trader
## Overview
Smart MACD Volume Trader is an enhanced momentum indicator that combines the classic MACD (Moving Average Convergence Divergence) oscillator with an intelligent high-volume filter. This combination significantly reduces false signals by ensuring that trading signals are only generated when price momentum is confirmed by substantial volume activity.
The indicator supports over 24 different instruments including major and exotic forex pairs, precious metals (gold and silver), energy commodities (crude oil, natural gas), and industrial metals (copper). For forex and commodity traders, the indicator automatically maps to CME and COMEX futures contracts to provide accurate institutional-grade volume data.
## Originality and Core Concept
Traditional MACD indicators generate signals based solely on price momentum, which can result in numerous false signals during low-activity periods or ranging markets. This indicator addresses this critical weakness by introducing a volume confirmation layer with automatic institutional volume integration.
**What makes this approach original:**
- Signals are triggered only when MACD crossovers coincide with elevated volume activity
- Implements a lookback mechanism to detect volume spikes within recent bars
- Automatically detects and maps 24+ forex pairs and commodities to their corresponding CME and COMEX futures contracts
- Provides real institutional volume data for forex pairs where spot volume is unreliable
- Combines two independent market dimensions (price momentum and volume) into a single, actionable signal
- Includes intelligent asset detection that works across multiple exchanges and ticker formats
**The underlying principle:** Volume validates price movement. When institutional money enters the market, it creates volume signatures. By requiring high volume confirmation and using actual institutional volume data from futures markets, this indicator filters out weak price movements and focuses on trades backed by genuine market participation. The automatic futures mapping ensures that forex and commodity traders always have access to the most accurate volume data available, without manual configuration.
## How It Works
### MACD Component
The indicator calculates MACD using standard methodology:
1. **Fast EMA (default: 12 periods)** - Tracks short-term price momentum
2. **Slow EMA (default: 26 periods)** - Tracks longer-term price momentum
3. **MACD Line** - Difference between Fast EMA and Slow EMA
4. **Signal Line (default: 9-period SMA)** - Smoothed average of MACD line
**Crossover signals:**
- **Bullish:** MACD line crosses above Signal line (momentum turning positive)
- **Bearish:** MACD line crosses below Signal line (momentum turning negative)
### Volume Filter Component
The volume filter adds an essential confirmation layer:
1. **Volume Moving Average** - Calculates exponential MA of volume (default: 20 periods)
2. **High Volume Threshold** - Multiplies MA by ratio (default: 2.0x or 200%)
3. **Volume Detection** - Identifies bars where current volume exceeds threshold
4. **Lookback Period** - Checks if high volume occurred in recent bars (default: 5 bars)
**Signal logic:**
- Buy/Sell signals only trigger when BOTH conditions are met:
- MACD crossover/crossunder occurs
- High volume detected within lookback period
### Automatic CME Futures Integration
For forex traders, spot FX volume data can be unreliable or non-existent. This indicator solves this problem by automatically detecting forex pairs and mapping them to corresponding CME futures contracts with real institutional volume data.
**Supported Major Forex Pairs (7):**
- EURUSD → CME:6E1! (Euro FX Futures)
- GBPUSD → CME:6B1! (British Pound Futures)
- AUDUSD → CME:6A1! (Australian Dollar Futures)
- USDJPY → CME:6J1! (Japanese Yen Futures)
- USDCAD → CME:6C1! (Canadian Dollar Futures)
- USDCHF → CME:6S1! (Swiss Franc Futures)
- NZDUSD → CME:6N1! (New Zealand Dollar Futures)
**Supported Exotic Forex Pairs (4):**
- USDMXN → CME:6M1! (Mexican Peso Futures)
- USDRUB → CME:6R1! (Russian Ruble Futures)
- USDBRL → CME:6L1! (Brazilian Real Futures)
- USDZAR → CME:6Z1! (South African Rand Futures)
**Supported Cross Pairs (6):**
- EURJPY → CME:6E1! (Uses Euro Futures)
- GBPJPY → CME:6B1! (Uses British Pound Futures)
- EURGBP → CME:6E1! (Uses Euro Futures)
- AUDJPY → CME:6A1! (Uses Australian Dollar Futures)
- EURAUD → CME:6E1! (Uses Euro Futures)
- GBPAUD → CME:6B1! (Uses British Pound Futures)
**Supported Precious Metals (2):**
- Gold (XAUUSD, GOLD) → COMEX:GC1! (Gold Futures)
- Silver (XAGUSD, SILVER) → COMEX:SI1! (Silver Futures)
**Supported Energy Commodities (3):**
- WTI Crude Oil (USOIL, WTIUSD) → NYMEX:CL1! (Crude Oil Futures)
- Brent Oil (UKOIL) → NYMEX:BZ1! (Brent Crude Futures)
- Natural Gas (NATGAS) → NYMEX:NG1! (Natural Gas Futures)
**Supported Industrial Metals (1):**
- Copper (COPPER) → COMEX:HG1! (Copper Futures)
**How the automatic detection works:**
The indicator intelligently identifies the asset type by analyzing:
1. Exchange name (FX, OANDA, TVC, COMEX, NYMEX, etc.)
2. Currency pair pattern (6-letter codes like EURUSD, GBPUSD)
3. Commodity identifiers (XAU for gold, XAG for silver, OIL for crude)
When a supported instrument is detected, the indicator automatically switches to the corresponding futures contract for volume analysis. For stocks, cryptocurrencies, and other assets, the indicator uses the native volume data from the current chart.
**Visual feedback:**
An information table appears in the top-right corner of the MACD pane showing:
- Current chart symbol
- Exchange name
- Currency pair or asset name
- Volume source being used (highlighted in orange for futures, yellow for native volume)
- Current high volume status
This provides complete transparency about which data source the indicator is using for its volume analysis.
## How to Use
### Basic Setup
1. Add the indicator to your chart
2. The indicator displays in a separate pane (MACD) and overlay (signals/volume bars)
3. Default settings work well for most assets, but can be customized
### Signal Interpretation
### Visual Signals
**Visual Signals:**
- **Green "BUY" label** - Bullish MACD crossover confirmed by high volume
- **Red "SELL" label** - Bearish MACD crossunder confirmed by high volume
- **Green/Red candles** - Highlight bars with volume exceeding the threshold
- **Light green/red background** - Emphasizes signal bars on the chart
**Information Table:**
A detailed information table appears in the top-right corner of the MACD pane, providing real-time transparency about the indicator's operation:
- **Chart:** Current symbol being analyzed
- **Exchange:** The exchange or data feed being used
- **Pair:** The currency pair or asset name extracted from the ticker
- **Volume From:** The actual symbol used for volume analysis
- Orange color indicates CME or COMEX futures are being used (automatic institutional volume)
- Yellow color indicates native volume from the chart symbol is being used
- Hover tooltip shows whether automatic futures mapping is active
- **High Volume:** Current status showing YES (green) when volume exceeds threshold, NO (gray) otherwise
This table ensures complete transparency and allows you to verify that the correct volume source is being used for your analysis.
**Volume Analysis:**
- Gray histogram bars = Normal volume
- Red histogram bars = High volume (exceeds threshold)
- Green line = Volume moving average baseline
**MACD Analysis:**
- Blue line = MACD line (momentum indicator)
- Orange line = Signal line (trend confirmation)
- Gray dotted line = Zero line (bullish above, bearish below)
### Parameter Customization
**MACD Parameters:**
- Adjust Fast/Slow EMA lengths for different sensitivities
- Shorter periods = More signals, faster response
- Longer periods = Fewer signals, less noise
**Volume Parameters:**
- **Volume MA Period:** Higher values smooth volume analysis
- **High Volume Ratio:** Lower values (1.5x) = More signals; Higher values (3.0x) = Fewer, stronger signals
- **Volume Lookback Bars:** Controls how recent the volume spike must be
**Direction Filters:**
- **Only Buy Signals:** Enables long-only strategy mode
- **Only Sell Signals:** Enables short-only strategy mode
### Alert Configuration
The indicator includes three alert types:
1. **Buy Signal Alert** - Triggers when bullish signal appears
2. **Sell Signal Alert** - Triggers when bearish signal appears
3. **High Volume Alert** - Triggers when volume exceeds threshold
To set up alerts:
1. Click the indicator name → "Add alert on Smart MACD Volume Trader"
2. Select desired alert condition
3. Configure notification method (popup, email, webhook, etc.)
## Trading Strategy Guidelines
### Best Practices
**Recommended markets:**
- Liquid stocks (large-cap, high daily volume)
- Major forex pairs (EURUSD, GBPUSD, USDJPY, AUDUSD, USDCAD, USDCHF, NZDUSD)
- Exotic forex pairs (USDMXN, USDRUB, USDBRL, USDZAR)
- Cross pairs (EURJPY, GBPJPY, EURGBP, AUDJPY, EURAUD, GBPAUD)
- Precious metals (Gold, Silver with automatic COMEX futures mapping)
- Energy commodities (Crude Oil, Natural Gas with automatic NYMEX futures mapping)
- Industrial metals (Copper with automatic COMEX futures mapping)
- Major cryptocurrency pairs
- Index futures and ETFs
**Timeframe recommendations:**
- **Day trading:** 5-minute to 15-minute charts
- **Swing trading:** 1-hour to 4-hour charts
- **Position trading:** Daily charts
**Risk management:**
- Use signals as entry confirmation, not standalone strategy
- Combine with support/resistance levels
- Consider overall market trend direction
- Always use stop-loss orders
### Strategy Examples
**Trend Following Strategy:**
1. Identify overall trend using higher timeframe (e.g., daily chart)
2. Trade only in trend direction
3. Use "Only Buy" filter in uptrends, "Only Sell" in downtrends
4. Enter on signal, exit on opposite signal or at resistance/support
**Volume Breakout Strategy:**
1. Wait for consolidation period (low volume, tight MACD range)
2. Enter when signal appears with high volume (confirms breakout)
3. Target previous swing highs/lows
4. Stop loss below/above recent consolidation
**Forex Scalping Strategy (with automatic CME futures):**
1. The indicator automatically detects forex pairs and uses CME futures volume
2. Trade during active sessions only (use session filter)
3. Focus on quick profits (10-20 pips)
4. Exit at opposite signal or profit target
**Commodities Trading Strategy (Gold, Silver, Oil):**
1. The indicator automatically maps to COMEX and NYMEX futures contracts
2. Trade during high-liquidity sessions (overlap of major markets)
3. Use the high volume confirmation to identify institutional entry points
4. Combine with key support and resistance levels for entries
5. Monitor the information table to confirm futures volume is being used (orange color)
6. Exit on opposite MACD signal or at predefined profit targets
## Why This Combination Works
### The Volume Advantage
Studies consistently show that price movements accompanied by high volume are more likely to continue, while low-volume movements often reverse. This indicator leverages this principle by requiring volume confirmation.
**Key benefits:**
1. **Reduced False Signals:** Eliminates MACD whipsaws during low-volume consolidation
2. **Confirmation Bias:** Two independent indicators (price momentum + volume) agreeing
3. **Institutional Alignment:** High volume often indicates institutional participation
4. **Trend Validation:** Volume confirms that price momentum has "conviction"
### Statistical Edge
By combining two uncorrelated signals (MACD crossovers and volume spikes), the indicator creates a higher-probability setup than either signal alone. The lookback mechanism ensures signals aren't missed if volume spike slightly precedes the MACD cross.
## Supported Exchanges and Automatic Detection
The indicator includes intelligent asset detection that works across multiple exchanges and ticker formats:
**Forex Exchanges (Automatic CME Mapping):**
- FX (TradingView forex feed)
- OANDA
- FXCM
- SAXO
- FOREXCOM
- PEPPERSTONE
- EASYMARKETS
- FX_IDC
**Commodity Exchanges (Automatic COMEX/NYMEX Mapping):**
- TVC (TradingView commodity feed)
- COMEX (directly)
- NYMEX (directly)
- ICEUS
**Other Asset Classes (Native Volume):**
- Stock exchanges (NASDAQ, NYSE, AMEX, etc.)
- Cryptocurrency exchanges (BINANCE, COINBASE, KRAKEN, etc.)
- Index providers (SP, DJ, etc.)
The detection algorithm analyzes three factors:
1. Exchange prefix in the ticker symbol
2. Pattern matching for currency pairs (6-letter codes)
3. Commodity identifiers in the symbol name
This ensures accurate automatic detection regardless of which data feed or exchange you use for charting. The information table in the top-right corner always displays which volume source is being used, providing complete transparency.
## Technical Details
**Calculations:**
- MACD Fast MA: EMA(close, fastLength)
- MACD Slow MA: EMA(close, slowLength)
- MACD Line: Fast MA - Slow MA
- Signal Line: SMA(MACD Line, signalLength)
- Volume MA: Exponential MA of volume
- High Volume: Current volume >= Volume MA × Ratio
**Signal logic:**
```
Buy Signal = (MACD crosses above Signal) AND (High volume in last N bars)
Sell Signal = (MACD crosses below Signal) AND (High volume in last N bars)
```
## Parameters Reference
| Parameter | Default | Description |
|-----------|---------|-------------|
| Volume Symbol | Blank | Manual override for volume source (leave blank for automatic detection) |
| Use CME Futures | False | Legacy option (automatic detection is now built-in) |
| Alert Session | 1530-2200 | Active session time range for alerts |
| Timezone | UTC+1 | Timezone for alert sessions |
| Volume MA Period | 20 | Number of periods for volume moving average |
| High Volume Ratio | 2.0 | Volume threshold multiplier (2.0 = 200% of average) |
| Volume Lookback | 5 | Number of bars to check for high volume confirmation |
| MACD Fast Length | 12 | Fast EMA period for MACD calculation |
| MACD Slow Length | 26 | Slow EMA period for MACD calculation |
| MACD Signal Length | 9 | Signal line SMA period |
| Only Buy | False | Filter to show only bullish signals |
| Only Sell | False | Filter to show only bearish signals |
| Show Signals | True | Display buy and sell labels on chart |
## Optimization Tips
**For volatile markets (crypto, small caps):**
- Increase High Volume Ratio to 2.5-3.0
- Reduce Volume Lookback to 3-4 bars
- Consider faster MACD settings (8, 17, 9)
**For stable markets (large-cap stocks, bonds):**
- Decrease High Volume Ratio to 1.5-1.8
- Increase Volume MA Period to 30-50
- Use standard MACD settings
**For forex (with automatic CME futures):**
- The indicator automatically uses CME futures when forex pairs are detected
- Set appropriate trading session based on your timezone
- Use Volume Lookback of 5-7 bars
- Consider session-based alerts only
- Monitor the information table to verify correct futures mapping
**For commodities (Gold, Silver, Oil, Copper):**
- The indicator automatically maps to COMEX and NYMEX futures
- Increase High Volume Ratio to 2.0-2.5 for metals
- Use slightly higher Volume MA Period (25-30) for smoother analysis
- Trade during active market hours for best volume data
- The information table will show the futures contract being used (orange highlight)
## Limitations and Considerations
**What this indicator does NOT do:**
- Does not predict future price direction
- Does not guarantee profitable trades
- Does not replace proper risk management
- Does not work well in extremely low-volume conditions
**Market conditions to avoid:**
- Pre-market and after-hours sessions (low volume)
- Major news events (volatile, unpredictable volume)
- Holidays and low-liquidity periods
- Extremely low float stocks
## Conclusion
Smart MACD Volume Trader represents a significant evolution of the traditional MACD indicator by combining volume confirmation with automatic institutional volume integration. This dual-confirmation approach significantly improves signal quality by filtering out low-conviction price movements and ensuring traders work with accurate volume data.
The indicator's automatic detection and mapping system supports over 24 instruments across forex, commodities, and metals markets. By intelligently switching to CME and COMEX futures contracts when appropriate, the indicator provides forex and commodity traders with the same quality of volume data that stock traders naturally have access to.
This indicator is particularly valuable for traders who want to:
- Align their entries with institutional money flow
- Avoid getting trapped in false breakouts
- Trade forex pairs with reliable volume data
- Access accurate volume information for gold, silver, and energy commodities
- Combine momentum and volume analysis in a single, streamlined tool
Whether you are day trading stocks, swing trading forex pairs, or positioning in commodities markets, this indicator provides a robust framework for identifying high-probability momentum trades backed by genuine institutional participation. The automatic futures mapping works seamlessly across all supported instruments, requiring no manual configuration or expertise in futures markets.
---
## Support and Updates
This indicator is actively maintained and updated based on user feedback and market conditions. For questions about implementation or custom modifications, please use the comments section below.
**Disclaimer:** This indicator is for educational and informational purposes only. Past performance does not guarantee future results. Always conduct your own analysis and risk management before trading.

Volume Sampled Supertrend [BackQuant]Volume Sampled Supertrend
A Supertrend that runs on a volume sampled price series instead of fixed time. New synthetic bars are only created after sufficient traded activity, which filters out low participation noise and makes the trend much easier to read and model.
Original Script Link
This indicator is built on top of my volume sampling engine. See the base implementation here:
Why Volume Sampling
Traditional charts print a bar every N minutes regardless of how active the tape is. During quiet periods you accumulate many small, low information bars that add noise and whipsaws to downstream signals.
Volume sampling replaces the clock with participation. A new synthetic bar is created only when a pre-set amount of volume accumulates (or, in Dollar Bars mode, when pricevolume reaches a dollar threshold). The result is a non-uniform time series that stretches in busy regimes and compresses in quiet regimes. This naturally:
filters dead time by skipping low volume chop;
standardizes the information content per bar, improving comparability across regimes;
stabilizes volatility estimates used inside banded indicators;
gives trend and breakout logic cleaner state transitions with fewer micro flips.
What this tool does
It builds a synthetic OHLCV stream from volume based buckets and then applies a Supertrend to that synthetic price. You are effectively running Supertrend on a participation clock rather than a wall clock.
Core Features
Sampling Engine - Choose Volume buckets or Dollar Bars . Thresholds can be dynamic from a rolling mean or median, or fixed by the user.
Synthetic Candles - Plots the volume sampled OHLC candles so you can visually compare against regular time candles.
Supertrend on Synthetic Price - ATR bands and direction are computed on the sampled series, not on time bars.
Adaptive Coloring - Candle colors can reflect side, intensity by volume, or a neutral scheme.
Research Panels - Table shows total samples, current bucket fill, threshold, bars-per-sample, and synthetic return stats.
Alerts - Long and Short triggers on Supertrend direction flips for the synthetic series.
How it works
Sampling
Pick Sampling Method = Volume or Dollar Bars.
Set the dynamic threshold via Rolling Lookback and Filter (Mean or Median), or enable Use Fixed and type a constant.
The script accumulates volume (or pricevolume) each time bar. When the bucket reaches the threshold, it finalizes one or more synthetic candles and resets accumulation.
Each synthetic candle stores its own OHLCV and is appended to the synthetic series used for all downstream logic.
Supertrend on the sampled stream
Choose Supertrend Source (Open, High, Low, Close, HLC3, HL2, OHLC4, HLCC4) derived from the synthetic candle.
Compute ATR over the synthetic series with ATR Period , then form upperBand = src + factorATR and lowerBand = src - factorATR .
Apply classic trailing band and direction rules to produce Supertrend and trend state.
Because bars only come when there is sufficient participation, band touches and flips tend to align with meaningful pushes, not idle prints.
Reading the display
Synthetic Volume Bars - The non-uniform candles that represent equal information buckets. Expect more candles during active sessions and fewer during lulls.
Volume Sampled Supertrend - The main line. Green when Trend is 1, red when Trend is -1.
Markers - Small dots appear when a new synthetic sample is created, useful for aligning activity cycles.
Time Bars Overlay (optional) - Plot regular time candles to compare how the synthetic stream compresses quiet chop.
Settings you will use most
Data Settings
Sampling Method - Volume or Dollar Bars.
Rolling Lookback and Filter - Controls the dynamic threshold. Median is robust to outliers, Mean is smoother.
Use Fixed and Fixed Threshold - Force a constant bucket size for consistent sampling across regimes.
Max Stored Samples - Ring buffer limit for performance.
Indicator Settings
SMA over last N samples - A moving average computed on the synthetic close series. Can be hidden for a cleaner layout.
Supertrend Source - Price field from the synthetic candle.
ATR Period and Factor - Standard Supertrend controls applied on the synthetic series.
Visuals and UI
Show Synthetic Bars - Turn synthetic candles on or off.
Candle Color Mode - Green/Red, Volume Intensity, Neutral, or Adaptive.
Mark new samples - Puts a dot when a bucket closes.
Show Time Bars - Overlay regular candles for comparison.
Paint candles according to Trend - Colors chart candles using current synthetic Supertrend direction.
Line Width , Colors , and Stats Table toggles.
Some workflow notes:
Trend Following
Set Sampling Method = Volume, Filter = Median, and a reasonable Rolling Lookback so busy regimes produce more samples.
Trade in the direction of the Volume Sampled Supertrend. Because flips require real participation, you tend to avoid micro whipsaws seen on time bars.
Use the synthetic SMA as a bias rail and trailing reference for partials or re-entries.
Breakout and Continuation
Watch for rapid clustering of new sample markers and a clean flip of the synthetic Supertrend.
The compression of quiet time and expansion in busy bursts often makes breakouts more legible than on uniform time charts.
Mean Reversion
In instruments that oscillate, faded moves against the synthetic Supertrend are easier to time when the bucket cadence slows and Supertrend flattens.
Combine with the synthetic SMA and return statistics in the table for sizing and expectation setting.
Stats table (top right)
Method and Total Samples - Sampling regime and current synthetic history length.
Current Vol or Dollar and Threshold - Live bucket fill versus the trigger.
Bars in Bucket and Avg Bars per Sample - How much time data each synthetic bar tends to compress.
Avg Return and Return StdDev - Simple research metrics over synthetic close-to-close changes.
Why this reduces noise
Time based bars treat a 5 minute print with 1 percent of average participation the same as one with 300 percent. Volume sampling equalizes bar information content. By advancing the bar only when sufficient activity occurs, you skip low quality intervals that add variance but little signal. For banded systems like Supertrend, this often means fewer false flips and cleaner runs.
Notes and tips
Use Dollar Bars on assets where nominal price varies widely over time or across symbols.
Median filter can resist single burst outliers when setting dynamic thresholds.
If you need a stable research baseline, set Use Fixed and keep the threshold constant across tests.
Enable Show Time Bars occasionally to sanity check what the synthetic stream is compressing or stretching.
Link again for reference
Original Volume Based Sampling engine:
Bottom line
When you let participation set the clock, your Supertrend reacts to meaningful flow instead of idle prints. The result is a cleaner state machine, fewer micro whipsaws, and a trend read that respects when the market is actually trading.

Advanced Volume Profile Pro Delta + POC + VAH/VAL# Advanced Volume Profile Pro - Delta + POC + VAH/VAL Analysis System
## WHAT THIS SCRIPT DOES
This script creates a comprehensive volume profile analysis system that combines traditional volume-at-price distribution with delta volume calculations, Point of Control (POC) identification, and Value Area (VAH/VAL) analysis. Unlike standard volume indicators that show only total volume over time, this script analyzes volume distribution across price levels and estimates buying vs selling pressure using multiple calculation methods to provide deeper market structure insights.
## WHY THIS COMBINATION IS ORIGINAL AND USEFUL
**The Problem Solved:** Traditional volume indicators show when volume occurs but not where price finds acceptance or rejection. Standalone volume profiles lack directional bias information, while basic delta calculations don't provide structural context. Traders need to understand both volume distribution AND directional sentiment at key price levels.
**The Solution:** This script implements an integrated approach that:
- Maps volume distribution across price levels using configurable row density
- Estimates delta (buying vs selling pressure) using three different methodologies
- Identifies Point of Control (highest volume price level) for key support/resistance
- Calculates Value Area boundaries where 70% of volume traded
- Provides real-time alerts for key level interactions and volume imbalances
**Unique Features:**
1. **Developing POC Visualization**: Real-time tracking of Point of Control migration throughout the session via blue dotted trail, revealing institutional accumulation/distribution patterns before they complete
2. **Multi-Method Delta Calculation**: Price Action-based, Bid/Ask estimation, and Cumulative methods for different market conditions
3. **Adaptive Timeframe System**: Auto-adjusts calculation parameters based on chart timeframe for optimal performance
4. **Flexible Profile Types**: N Bars Back (precise control), Days Back (calendar-based), and Session-based analysis modes
5. **Advanced Imbalance Detection**: Identifies and highlights significant buying/selling imbalances with configurable thresholds
6. **Comprehensive Alert System**: Monitors POC touches, Value Area entry/exit, and major volume imbalances
## HOW THE SCRIPT WORKS TECHNICALLY
### Core Volume Profile Methodology:
**1. Price Level Distribution:**
- Divides price range into user-defined rows (10-50 configurable)
- Calculates row height: `(Highest Price - Lowest Price) / Number of Rows`
- Distributes each bar's volume across price levels it touched proportionally
**2. Delta Volume Calculation Methods:**
**Price Action Method:**
```
Price Range = High - Low
Buy Pressure = (Close - Low) / Price Range
Sell Pressure = (High - Close) / Price Range
Buy Volume = Total Volume × Buy Pressure
Sell Volume = Total Volume × Sell Pressure
Delta = Buy Volume - Sell Volume
```
**Bid/Ask Estimation Method:**
```
Average Price = (High + Low + Close) / 3
Buy Volume = Close > Average ? Volume × 0.6 : Volume × 0.4
Sell Volume = Total Volume - Buy Volume
```
**Cumulative Method:**
```
Buy Volume = Close > Open ? Volume : Volume × 0.3
Sell Volume = Close ≤ Open ? Volume : Volume × 0.3
```
**3. Point of Control (POC) Identification:**
- Scans all price levels to find maximum volume concentration
- POC represents the price level with highest trading activity
- Acts as significant support/resistance level
- **Developing POC Feature**: Tracks POC evolution in real-time via blue dotted trail, showing how institutional interest migrates throughout the session. Upward POC migration indicates accumulation patterns, downward migration suggests distribution, providing early trend signals before price confirmation.
**4. Value Area Calculation:**
- Starts from POC and expands up/down to encompass 70% of total volume
- VAH (Value Area High): Upper boundary of value area
- VAL (Value Area Low): Lower boundary of value area
- Expansion algorithm prioritizes direction with higher volume
**5. Adaptive Range Selection:**
Based on profile type and timeframe optimization:
- **N Bars Back**: Fixed lookback period with performance optimization (20-500 bars)
- **Days Back**: Calendar-based analysis with automatic timeframe adjustment (1-365 days)
- **Session**: Current trading session or custom session times
### Performance Optimization Features:
- **Sampling Algorithm**: Reduces calculation load on large datasets while maintaining accuracy
- **Memory Management**: Clears previous drawings to prevent performance degradation
- **Safety Constraints**: Prevents excessive memory usage with configurable limits
## HOW TO USE THIS SCRIPT
### Initial Setup:
1. **Profile Configuration**: Select profile type based on trading style:
- N Bars Back: Precise control over data range
- Days Back: Intuitive calendar-based analysis
- Session: Real-time session development
2. **Row Density**: Set number of rows (30 default) - more rows = higher resolution, slower performance
3. **Delta Method**: Choose calculation method based on market type:
- Price Action: Best for trending markets
- Bid/Ask Estimate: Good for ranging markets
- Cumulative: Smoothed approach for volatile markets
4. **Visual Settings**: Configure colors, position (left/right), and display options
### Reading the Profile:
**Volume Bars:**
- **Length**: Represents relative volume at that price level
- **Color**: Green = net buying pressure, Red = net selling pressure
- **Intensity**: Darker colors indicate volume imbalances above threshold
**Key Levels:**
- **POC (Blue Line)**: Highest volume price - major support/resistance
- **VAH (Purple Dashed)**: Value Area High - upper boundary of fair value
- **VAL (Orange Dashed)**: Value Area Low - lower boundary of fair value
- **Value Area Fill**: Shaded region showing main trading range
**Developing POC Trail:**
- **Blue Dotted Lines**: Show real-time POC evolution throughout the session
- **Migration Patterns**: Upward trail indicates bullish accumulation, downward trail suggests bearish distribution
- **Early Signals**: POC movement often precedes price movement, providing advance warning of institutional activity
- **Institutional Footprints**: Reveals where smart money concentrated volume before final POC establishment
### Trading Applications:
**Support/Resistance Analysis:**
- POC acts as magnetic price level - expect reactions
- VAH/VAL provide intermediate support/resistance levels
- Profile edges show areas of low volume acceptance
**Developing POC Analysis:**
- **Upward Migration**: POC moving higher = institutional accumulation, bullish bias
- **Downward Migration**: POC moving lower = institutional distribution, bearish bias
- **Stable POC**: Tight clustering = balanced market, range-bound conditions
- **Early Trend Detection**: POC direction change often precedes price breakouts
**Entry Strategies:**
- Buy at VAL with POC as target (in uptrends)
- Sell at VAH with POC as target (in downtrends)
- Breakout plays above/below profile extremes
**Volume Imbalance Trading:**
- Strong buying imbalance (>60% threshold) suggests continued upward pressure
- Strong selling imbalance suggests continued downward pressure
- Imbalances near key levels provide high-probability setups
**Multi-Timeframe Context:**
- Use higher timeframe profiles for major levels
- Lower timeframe profiles for precise entries
- Session profiles for intraday trading structure
## SCRIPT SETTINGS EXPLANATION
### Volume Profile Settings:
- **Profile Type**: Determines data range for calculation
- N Bars Back: Exact number of bars (20-500 range)
- Days Back: Calendar days with timeframe adaptation (1-365 days)
- Session: Trading session-based (intraday focus)
- **Number of Rows**: Profile resolution (10-50 range)
- **Profile Width**: Visual width as chart percentage (10-50%)
- **Value Area %**: Volume percentage for VA calculation (50-90%, 70% standard)
- **Auto-Adjust**: Automatically optimizes for different timeframes
### Delta Volume Settings:
- **Show Delta Volume**: Enable/disable delta calculations
- **Delta Calculation Method**: Choose methodology based on market conditions
- **Highlight Imbalances**: Visual emphasis for significant volume imbalances
- **Imbalance Threshold**: Percentage for imbalance detection (50-90%)
### Session Settings:
- **Session Type**: Daily, Weekly, Monthly, or Custom periods
- **Custom Session Time**: Define specific trading hours
- **Previous Sessions**: Number of historical sessions to display
### Days Back Settings:
- **Lookback Days**: Number of calendar days to analyze (1-365)
- **Automatic Calculation**: Script automatically converts days to bars based on timeframe:
- Intraday: Accounts for 6.5 trading hours per day
- Daily: 1 bar per day
- Weekly/Monthly: Proportional adjustment
### N Bars Back Settings:
- **Lookback Bars**: Exact number of bars to analyze (20-500)
- **Precise Control**: Best for systematic analysis and backtesting
### Visual Customization:
- **Colors**: Bullish (green), Bearish (red), and level colors
- **Profile Position**: Left or Right side of chart
- **Profile Offset**: Distance from current price action
- **Labels**: Show/hide level labels and values
- **Smooth Profile Bars**: Enhanced visual appearance
### Alert Configuration:
- **POC Touch**: Alerts when price interacts with Point of Control
- **VA Entry/Exit**: Alerts for Value Area boundary interactions
- **Major Imbalance**: Alerts for significant volume imbalances
## VISUAL FEATURES
### Profile Display:
- **Horizontal Bars**: Volume distribution across price levels
- **Color Coding**: Delta-based coloring for directional bias
- **Smooth Rendering**: Optional smoothing for cleaner appearance
- **Transparency**: Configurable opacity for chart readability
### Level Lines:
- **POC**: Solid blue line with optional label
- **VAH/VAL**: Dashed colored lines with value displays
- **Extension**: Lines extend across relevant time periods
- **Value Area Fill**: Optional shaded region between VAH/VAL
### Information Table:
- **Current Values**: Real-time POC, VAH, VAL prices
- **VA Range**: Value Area width calculation
- **Positioning**: Multiple table positions available
- **Text Sizing**: Adjustable for different screen sizes
## IMPORTANT USAGE NOTES
**Realistic Expectations:**
- Volume profile analysis provides structural context, not trading signals
- Delta calculations are estimations based on price action, not actual order flow
- Past volume distribution does not guarantee future price behavior
- Combine with other analysis methods for comprehensive market view
**Best Practices:**
- Use appropriate profile types for your trading style:
- Day Trading: Session or Days Back (1-5 days)
- Swing Trading: Days Back (10-30 days) or N Bars Back
- Position Trading: Days Back (60-180 days)
- Consider market context (trending vs ranging conditions)
- Verify key levels with additional technical analysis
- Monitor profile development for changing market structure
**Performance Considerations:**
- Higher row counts increase calculation complexity
- Large lookback periods may affect chart performance
- Auto-adjust feature optimizes for most use cases
- Consider using session profiles for intraday efficiency
**Limitations:**
- Delta calculations are estimations, not actual transaction data
- Profile accuracy depends on available price/volume history
- Effectiveness varies across different instruments and market conditions
- Requires understanding of volume profile concepts for optimal use
**Data Requirements:**
- Requires volume data for accurate calculations
- Works best on liquid instruments with consistent volume
- May be less effective on very low volume or exotic instruments
This script serves as a comprehensive volume analysis tool for traders who need detailed market structure information with integrated directional bias analysis and real-time POC development tracking for informed trading decisions.
