TDI Hedge Strategy
This is the incomplete version but upon multiple requests, I have released it early. All of the strategy and alert functions are yet to be written and I'll get around to it soon.
This indicator aims to be the best TDI indicator on TradingView. It is a strategy or study. It will have all of the filter, entry, and exit conditions for the strategies around the TDI.
What is implemented
MFI or RSI: the MFI is a much better TDI baseline than the RSI, in my opinion, and very effective
EMA or SMA used for the moving averages on fast, slow, and volatility band
Dynamic timeframe: set a factor of current timeframe and indicator will analyse higher timeframe automatically
Manual timeframe: set a higher timeframe to analyse different to currently viewed
Features for later
conditions for TDI filters/entries/exits
Strategy functions to use built-in strategy tester
BTE signal plot for Backtesting & Trading Engine
alerts
Enjoy!
"TDI" için komut dosyalarını ara


TDI - Traders Dynamic Index - Roshan [Mehdi]This method is based on Mr. Roshan's technique which use TDI with upper timeframe


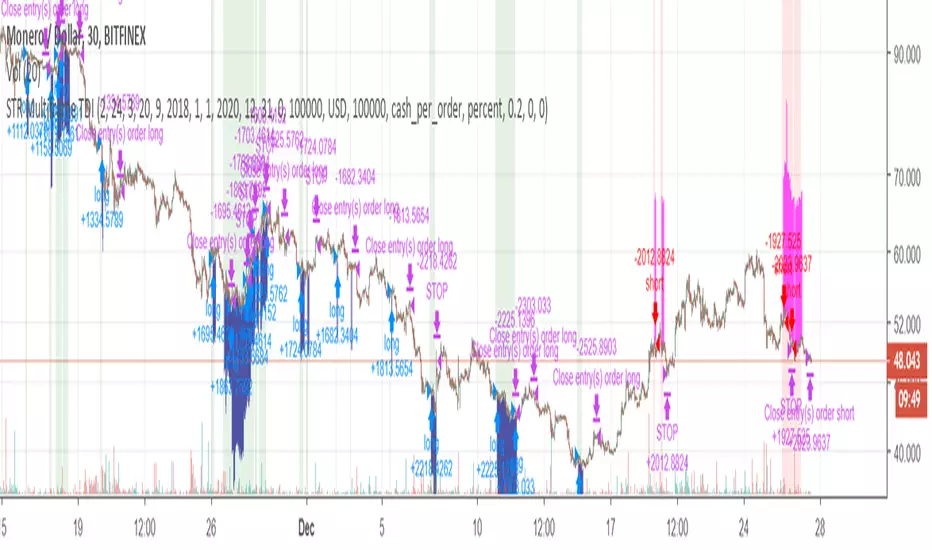
STR Multiframe TDIThis is a strategy (backtest) script which uses multitimeframe TDI (only the upper side of the indicator) to trade XMRUSD on 30 min.
TDI Strategy @Version=2 by SodewalaThis strategy will automatically find good big up trend and filte most choppy/sideways market. please like if you find useful. comment if you have some good suggestions. Thanks

TDI Pro's Analytic Tool by YardleyRosette
This tool simplifies the general rules of a strategy based on Traders Dynamic Index to my best ability.
The trader must only enter at the most reasonable place, such as when the signal says to buy or sell but it really means a retracement has formed in the view of the trader, for entry into opposite direction.
For example, using KK_TDI_BH, to see oversold or overbought conditions such as:
KK_TDI_BH: RSI/TSL crossing up from under 32 level for a good buy entry with MBL under 50.
Or, RSI/TSL crossing down from above 68 level for a good sell entry with MBL over 50.
Also, close entry orders are potential reversal entries if overlay MBL declines direction and/or KK_TDI_BH: V.B. squeezes on the time frame or a second time frame used.
HigherTF MAs, guide in seeing market conditions and support/resistance overall and combination of them with current time frame to especially help stay in longer-term trades.
By not entering and exiting blindly with this tool, the trader will be able to do on-the-job training. Will work best with traders using TradingView Pro and above (using multiple charts)
Strategy Results overview based on FOREX 0.3 lot size
Sistema de compraventas ( Trading ), usando mi herramienta de analítica y en base al Índice Dinámico de Comerciantes.
Se necesita entrenamiento para usarlo a mayor utilidad.
_______________________

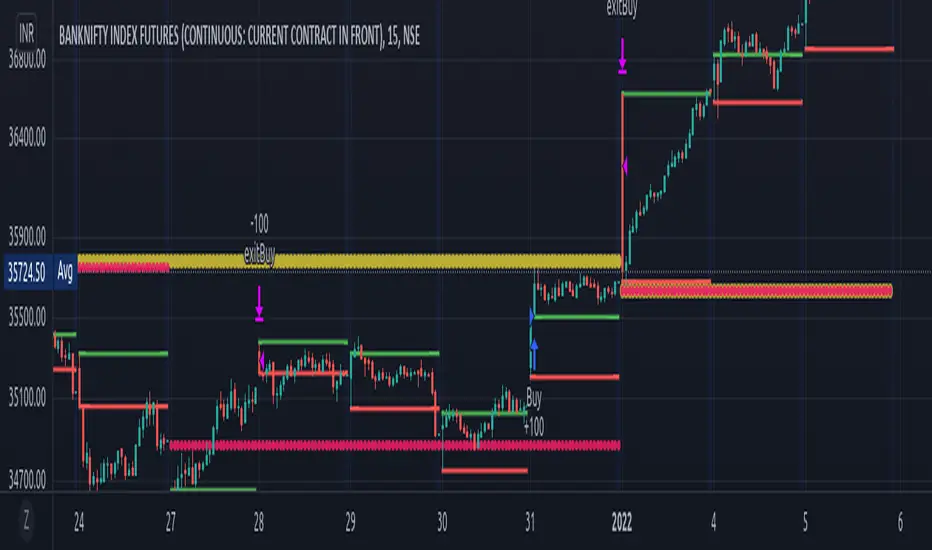
yuyutsu-banknifty-beta"yuyutsu-banknifty-beta" indicator is a strategy especially made for NSE/BSE Banknifty. Strategy has various sub strategies which can be selected to check back tested accuracy and profit factor. Strategies works best on 3m /15m for intraday. Sub strategy "Swing" can be applied on either nifty and banknifty.
I have also added checkboxes for 3m/15m which implictly selects best combination for desired results.
Below are the sub strategies which user can use and perform back testing.
HMA
Daily Weekly Closing
Daily Monthly Closing
Pivot
Previous day open close
Gap up/down
75m analysis
ORB
Swing
TDI
VMWA
VWAP
Ripster clouds
M.H Pee indicatorsHere is a collection of Trend Indicators as defined by M.H Pee and presented
in various articles of the "STOCKS & COMMODITIES Magazine"
The actual implementation of the indicators here are made by: everget
I thought they were rather cool, so I have gather them here so that they easily can be tested.
My own test was made using 15 companies from the OMXS30 list
during the time period of 2016-2018, and I only went LONG.
The result was as follows (Average Net Profit , StdDev):
TDI 3.04% 5.97
TTF 1.22%. 5.73
TII 1.07% 6.2
TCF 0.32% 2.68
Would be interesting to hear what other people get as test result from these indicators.
To do that just run this strategy, and chose the indicator from the setup menu.

[BACKTEST]Traders Dynamic Index Indicator Alert by JustUncleLBy request, this script is a "strategy" version of my "Traders Dynamic Index Indicator Alert" script, made available for backtesting to help find optimal trade settings for a particular asset.

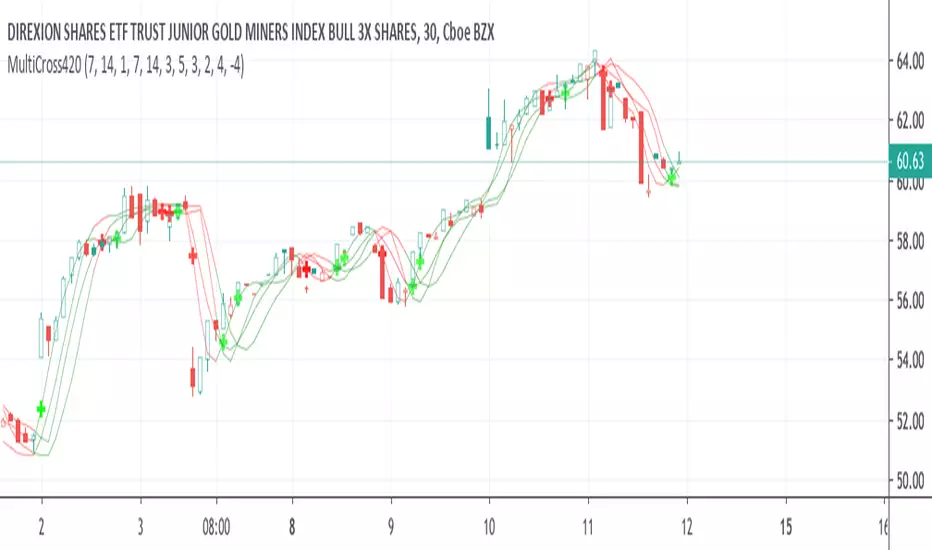
Slickwater Strategy [frac]This indicator is the culmination of various other indicators and attempts to help traders assess the actual current trend and filter out all the noise.
In reality, this indicator is extremely similar to the Traders Dynamic Index in concept and the overall results of the indicator across any time frame. The differences though are that while TDI uses just RSI, this uses RSI, CCI, MFI, and TSI, and also includes an assessment of the momentum associated with the move, to better enable traders to detect divergence.
The default settings generate the best returns across any time frame, however can be ultra sensitive and generate too many trade signals on high resolution time frames (i.e., the 15M or 30M). If one desires less sensitive results, one can use (14,12,9) for the first 3 inputs. This generates consistent signals, but is not as sensitive as the default.
In general:
GO LONG:
- Scalp: Wt1 crosses over Wt2
- Short Term: Wt1 crosses over Wt2 and the middle band. Wt2 is above the middle band as well
- Medium Term: Same as short term, but there are extended oversold trading signals (yellow dots)
- Long term: Same as medium term, but there is divergence in the momentum as well (i.e. it is increasing while price decreases)
GO SHORT:
- Scalp: Wt1 crosses under Wt2
- Short Term: Wt1 crosses under Wt2 and the middle band. Wt2 is below the middle band as well.
- Medium Term: Same as short term, but there are extended overbought trading signals (yellow dots)
- Long term: Same as medium term, but there is divergence in the momentum as well (i.e., it is decreasing while price increases)
