"Relative" için komut dosyalarını ara

relative strength to SPX500This is the indicators showing the stock relative strength comparing with SPX500.
positive means the stock is strong than spx500
negative means weak than spx500

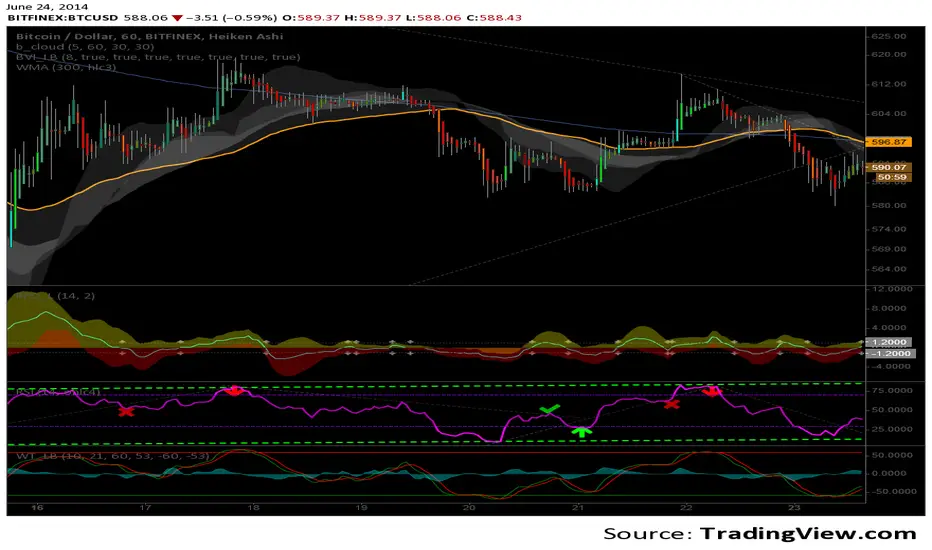
Relative Price Difference [LAVA]EDIT: Look below for updates to the script.
EDIT: After several updates to this script, I think it's safe to say it will work with all timelines. Using hand drawn trendlines, it can predict tops and bottoms with pretty good accuracy.
Shows a change in the relative price difference via percentage on a 0 horizontal. Added a bollinger band to help identify weak areas (orange). If orange starts showing, the current price direction is strong but can reverse harshly. If you are in a weak position, exit here. Otherwise, don't enter a trade after/during orange sessions until a full cycle (up/dn > 1% without orange) has completed. The main line indicator fluctuates according to the price difference. 1% horizontal lines are added to help identify profit taking spots or OTE zones. Ensure the 1% line is crossed completely before you decide to enter/exit. Cross points are identified with crosses if you missed your window, this is the last spot to exit, enter. This indicator doesn't work that well with small time intervals. As always, use more than one indicator to ensure your decision is right. (The colors are ugly so change them if you wish! :)
Daily Relative Strength (Daily Update)📊 Daily Relative Strength Rank Table (Crypto / Multi-Asset)
This indicator provides a daily relative strength ranking of multiple assets using normalized percentage returns (Z-Scores). It is designed to help traders quickly identify which tokens are outperforming or underperforming the group, both today (live) and yesterday (finalized).
🔍 How It Works
Each asset’s daily percentage return is calculated from the daily close.
Returns are then normalized (Z-score) across the selected group, showing how far each asset deviates from the group average.
Assets are ranked from strongest to weakest based on today’s normalized score.
📈 Table Columns
Rank – Relative position vs other assets (higher = stronger)
Token – Asset symbol
Today Z – Live, intraday relative strength (updates in real time)
Yday Z – Frozen relative strength from the previous daily close
The Yesterday score does not repaint and remains constant throughout the day, allowing for clear comparison between today’s performance and the prior session.
🎯 Why Use This Indicator?
Quickly spot leaders and laggards
Compare assets on a percent-based, normalized scale
Avoid price bias (low-price and high-price assets are treated equally)
Ideal for rotation strategies, momentum trading, and market strength analysis
⚙️ Customization
All symbols can be changed directly in the indicator settings
Works on any timeframe (daily logic is handled internally)
Designed for crypto, but works with stocks, forex, or indices
🧠 Best Use Cases
Identifying top outperformers
Confirming trend continuation
Comparing sector or basket strength
Improving timing and capital allocation decisions

Adapted RSI w/ Multi-Asset Regime Detection v1.1The relative strength index (RSI) is a momentum indicator used in technical analysis. RSI measures the speed and magnitude of an asset's recent price changes to detect overbought or oversold conditions in the price of said asset.
In addition to identifying overbought and oversold assets, the RSI can also indicate whether your desired asset may be primed for a trend reversal or a corrective pullback in price. It can signal when to buy and sell.
The RSI will oscillate between 0 and 100. Traditionally, an RSI reading of 70 or above indicates an overbought condition. A reading of 30 or below indicates an oversold condition.
The RSI is one of the most popular technical indicators. I intend to offer a fresh spin.
Adapted RSI w/ Multi-Asset Regime Detection
Our Adapted RSI makes necessary improvements to the original Relative Strength Index (RSI) by combining multi-timeframe analysis with multi-asset monitoring and providing traders with an efficient way to analyse market-wide conditions across different timeframes and assets simultaneously. The indicator automatically detects market regimes and generates clear signals based on RSI levels, presenting this data in an organised, easy-to-read format through two dynamic tables. Simplicity is key, and having access to more RSI data at any given time, allows traders to prepare more effectively, especially when trading markets that "move" together.
How we calculate the RSI
First, the RSI identifies price changes between periods, calculating gains and losses from one look-back period to the next. This look-back period averages gains and losses over 14 periods, which in this case would be 14 days, and those gains/losses are calculated based on the daily closing price. For example:
Average Gain = Sum of Gains over the past 14 days / 14
Average Loss = Sum of Losses over the past 14 days / 14
Then we calculate the Relative Strength (RS):
RS = Average Gain / Average Loss
Finally, this is converted to the RSI value:
RSI = 100 - (100 / (1 + RS))
Key Features
Our multi-timeframe RSI indicator enhances traditional technical analysis by offering synchronised Daily, Weekly, and Monthly RSI readings with automatic regime detection. The multi-asset monitoring system allows tracking of up to 10 different assets simultaneously, with pre-configured major pairs that can be customised to any asset selection. The signal generation system provides clear market guidance through automatic regime detection and a five-level signal system, all presented through a sophisticated visual interface with dynamic RSI line colouring and customisable display options.
Quick Guide to Use it
Begin by adding the indicator to your chart and configuring your preferred assets in the "Asset Comparison" settings.
Position the two information tables according to your preference.
The main table displays RSI analysis across three timeframes for your current asset, while the asset table shows a comparative analysis of all monitored assets.
Signals are colour-coded for instant recognition, with green indicating bullish conditions and red for bearish conditions. Pay special attention to regime changes and signal transitions, using multi-timeframe confluence to identify stronger signals.
How it Works (Regime Detection & Signals)
When we say 'Regime', a regime is determined by a persistent trend or in this case momentum and by leveraging this for RSI, which is a momentum oscillator, our indicator employs a relatively simple regime detection system that classifies market conditions as either Bullish (RSI > 50) or Bearish (RSI < 50). Our benchmark between a trending bullish or bearish market is equal to 50. By leveraging a simple classification system helps determine the probability of trend continuation and the weight given to various signals. Whilst we could determine a Neutral regime for consolidating markets, we have employed a 'neutral' signal generation which will be further discussed below...
Signal generation occurs across five distinct levels:
Strong Buy (RSI < 15)
Buy (RSI < 30)
Neutral (RSI 30-70)
Sell (RSI > 70)
Strong Sell (RSI > 85)
Each level represents different market conditions and probability scenarios. For instance, extreme readings (Strong Buy/Sell) indicate the highest probability of mean reversion, while neutral readings suggest equilibrium conditions where traders should focus on the overall regime bias (Bullish/Bearish momentum).
This approach offers traders a new and fresh spin on a popular and well-known tool in technical analysis, allowing traders to make better and more informed decisions from the well presented information across multiple assets and timeframes. Experienced and beginner traders alike, I hope you enjoy this adaptation.

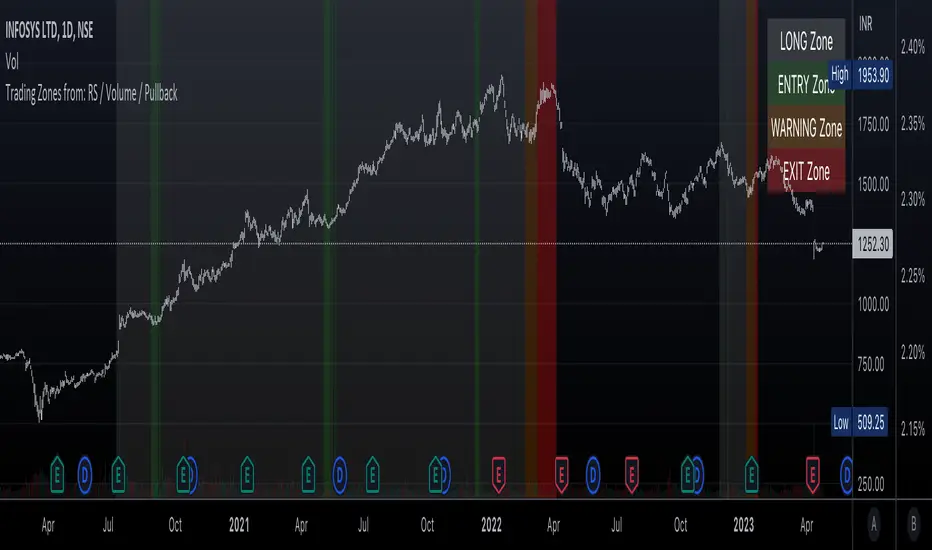
Trading Zones based on RS / Volume / PullbackThis is an Indicator which identifies different Trading Zones on the chart.
This should be Primarily used for Long Trades.
Trading Zones: and the Reasoning behind them
Long Zone -> One can do a Potential Entry (Buy) when this Zone is identified, but one could also wait for 'Entry Zone' (explained next) for a better Risk/Reward Trade.
Long Zones are identified with the help of Relative Strength and by an Intermediate Top in price.
Entry Zone -> This can be a better Risk/Reward zone to enter positions within the Long Zone.
Entry Zone is identified by a Pullback in Price & Volume contraction after the Long Zone is activated
Warning Zone -> One needs to be careful in this zone, no need to panic, Script will now try to find an Exit when Price Retraces towards Highs.
Warning Zone identifies weakness in the Price using Relative Strength of the current Stock (w.r.t. the Reference Symbol configured) and the severity of Pullback in Price.
Exit Zone -> are found only after transitioning to Warning Zone, this is a Zone which helps in minimising losses after a trade has gone into losses. Exit Zone is identified by making sure a local peak forms in Warning Zone. However, there are instances when Exit Zone detection can get prolonged when a local price peak is not formed soon enough. So one needs to be careful and use other strategies for exit.
------------------------------------------------------------------------------------
What is different in this Script:
The Script uses Relative Strength in combination with Pullback in Price from Highs in a Novel way.
Over-trading is avoided by ignoring Sideways price movements, using Relative Strength.
Only Trending Upward movement is detected and traded.
How to use this Indicator:
Use these 'Trading Zones' only as a reference so it can minimise your time in screening stocks.
Preferred Settings for using the Indicator:
Stick to 1-Day candles
Keep Relative Symbol as "Nifty" for Indian Stocks.
For US stocks, we can use "SPX" as the Relative Symbol.
//----------------
FEW EXAMPLES:
//----------------
ASIANPAINT
TATAMOTORS
TITAN
ITC
DIVISLAB
MARUTI
---------------------------------------------
Feedback is welcome.
RSI Mansfield +RSI Mansfield+ – Adaptive Relative Strength Indicator with Divergences
Overview
RSI Mansfield+ is an advanced relative strength indicator that compares your instrument’s performance against a configurable benchmark index or asset (e.g., Bitcoin Dominance, S&P 500). It combines Mansfield normalization, adaptive smoothing techniques, and automatic detection of bullish and bearish divergences (regular and hidden), delivering a comprehensive tool for assessing relative strength across any market and timeframe.
Originality and Motivation
Unlike traditional relative strength scripts, this indicator introduces several distinctive improvements:
Mansfield Normalization: Scales the ratio between the asset and the benchmark relative to its moving average, transforming it into a normalized oscillator that fluctuates around zero, making it easier to spot outperformance or underperformance.
Adaptive Smoothing: Automatically selects whether to use EMA or SMA based on the market type (crypto or stocks) and timeframe (intraday, daily, weekly, monthly), avoiding manual configuration and providing more robust results under varying volatility conditions.
Divergence Detection: Identifies four types of divergences in the Mansfield oscillator to help anticipate potential reversal points or trend confirmations.
Multi-Market Support: Offers benchmark selection among major crypto and global stock indices from a single input.
These enhancements make RSI Mansfield+ more practical and powerful than conventional relative strength scripts with static benchmarks or without divergence capabilities.
Core Concepts
Relative Strength (RS): Compares price evolution between your asset and the selected benchmark.
Mansfield Normalization: Measures how much the RS deviates from its historical moving average, expressed as a scaled oscillator.
Divergences: Detects regular and hidden bullish or bearish divergences within the Mansfield oscillator.
Timeframe Adaptation: Dynamically adjusts moving average lengths based on timeframe and market type.
How It Works
Benchmark Selection
Choose among over 10 indices or market domains (BTC Dominance, ETH Dominance, S&P 500, European indices, etc.).
Ratio Calculation
Computes the price-to-benchmark ratio and smooths it with the adaptive moving average.
Normalization and Scaling
Transforms deviations into a Mansfield oscillator centered around zero.
Dynamic Coloring
Green indicates relative outperformance, red signals underperformance.
Divergence Detection
Automatically identifies bullish and bearish (regular and hidden) divergences by comparing oscillator pivots against price pivots.
Baseline Reference
A clear zero line helps interpret relative strength trends.
Usage Guidelines
Benchmark Comparison
Ideal for traders analyzing whether an asset is outperforming or lagging its sector or market.
Divergence Analysis
Helps detect potential reversal or continuation signals in relative strength.
Multi-Timeframe Compatibility
Can be applied to intraday, daily, weekly, or monthly charts.
Interpretation
Oscillator >0 and green: outperforming the benchmark.
Oscillator <0 and red: underperforming.
Bullish divergences: potential relative strength reversal to the upside.
Bearish divergences: possible loss of momentum or reversal to the downside.
Credits
The concept of Mansfield Relative Strength is based on Stan Weinstein’s original work on relative performance analysis. This script was built entirely from scratch in TradingView Pine Script v6, incorporating original logic for adaptive smoothing, normalized scaling, and divergence detection, without reusing any external open-source code.

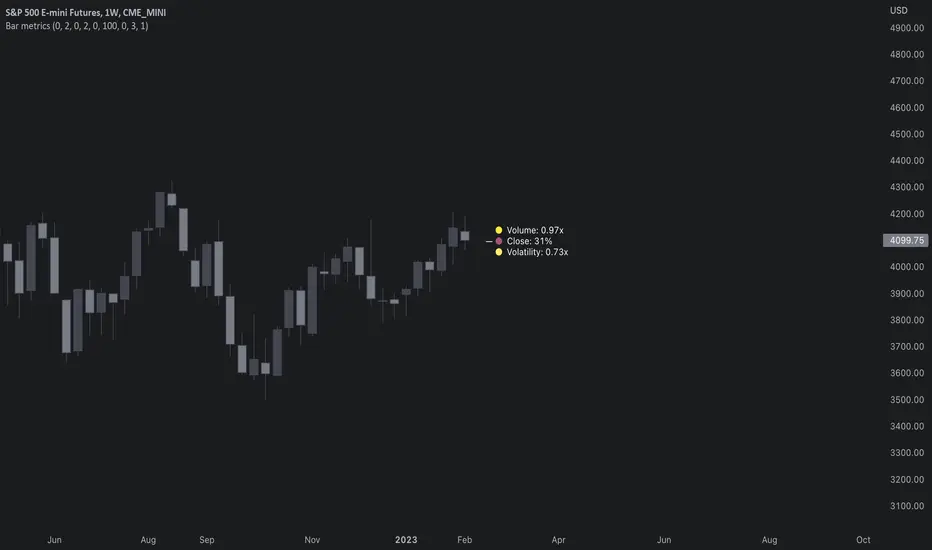
Bar metrics / quantifytools— Overview
Rather than eyeball evaluating bullishness/bearishness in any given bar, bar metrics allow a quantified approach using three basic fundamental data points: relative close, relative volatility and relative volume. These data points are visualized in a discreet data dashboard form, next to all real-time bars. Each value also has a dot in front, representing color coded extremes in the values.
Relative close represents position of bar's close relative to high and low, high of bar being 100% and low of bar being 0%. Relative close indicates strength of bulls/bears in a given bar, the higher the better for bulls, the lower the better for bears. Relative volatility (bar range, high - low) and relative volume are presented in a form of a multiplier, relative to their respective moving averages (SMA 20). A value of 1x indicates volume/volatility being on par with moving average, 2x indicates volume/volatility being twice as much as moving average and so on. Relative volume and volatility can be used for measuring general market participant interest, the "weight of the bar" as it were.
— Features
Users can gauge past bar metrics using lookback via input menu. Past bars, especially recent ones, are helpful for giving context for current bar metrics. Lookback bars are highlighted on the chart using a yellow box and metrics presented on the data dashboard with lookback symbols:
To inspect bar metric data and its implications, users can highlight bars with specified bracket values for each metric:
When bar highlighter is toggled on and desired bar metric values set, alert for the specified combination can be toggled on via alert menu. Note that bar highlighter must be enabled in order for alerts to function.
— Visuals
Bar metric dots are gradient colored the following way:
Relative volatility & volume
0x -> 1x / Neutral (white) -> Light (yellow)
1x -> 1.7x / Light (yellow) -> Medium (orange)
1.7x -> 2.4x / Medium (orange) -> Heavy (red)
Relative close
0% -> 25% / Heavy bearish (red) -> Light bearish (dark red)
25% -> 45% / Light bearish (dark red) -> Neutral (white)
45% - 55% / Neutral (white)
55% -> 75% / Neutral (white) -> Light bullish (dark green)
75% -> 100% / Light bullish (dark green) -> Heavy bullish (green)
All colors can be adjusted via input menu. Label size, label distance from bar (offset) and text format (regular/stealth) can be adjusted via input menu as well:
— Practical guide
As interpretation of bar metrics is highly contextual, it is especially important to use other means in conjunction with the metrics. Levels, oscillators, moving averages, whatever you have found useful for your process. In short, relative close indicates directional bias and relative volume/volatility indicates "weight" of directional bias.
General interpretation
High relative close, low relative volume/volatility = mildly bullish, bias up/consolidation
High relative close, medium relative volume/volatility = bullish, bias up
High relative close, high relative volume/volatility = exuberantly bullish, bias up/down depending on context
Medium relative close, low relative volume/volatility = noise, no bias
Medium relative close, medium to high relative volume/volatility = indecision, further evidence needed to evaluate bias
Low relative close, low relative volume/volatility = mildly bearish, bias down/consolidation
Low relative close, medium relative volume/volatility = bearish, bias down
Low relative close, high relative volume/volatility = exuberantly bearish, bias down/up depending on context
Nuances & considerations
As to relative close, it's important to note that each bar is a trading range when viewed on a lower timeframe, ES 1W vs. ES 4H:
When relative close is high, bulls were able to push price to range high by the time of close. When relative close is low, bears were able to push price to range low by the time of close. In other words, bulls/bears were able to gain the upper hand over a given trading range, hinting strength for the side that made the final push. When relative close is around middle range (40-60%), it can be said neither side is clearly dominating the range, hinting neutral/indecision bias from a relative close perspective.
As to relative volume/volatility, low values (less than ~0.7x) imply bar has low market participant interest and therefore is likely insignificant, as it is "lacking weight". Values close to or above 1x imply meaningful market participant interest, whereas values well above 1x (greater than ~1.3x) imply exuberance. This exuberance can manifest as initiation (beginning of a trend) or as exhaustion (end of a trend):
RSI Exponential Smoothing (Expo)█ Background information
The Relative Strength Index (RSI) and the Exponential Moving Average (EMA) are two popular indicators. Traders use these indicators to understand market trends and predict future price changes. However, traders often wonder which indicator is better: RSI or EMA.
What if these indicators give similar results? To find out, we wanted to study the relationship between RSI and EMA. We focused on a hypothesis: when the RSI goes above 50, it might be similar to the price crossing above a certain length of EMA. Similarly, when the RSI goes below 50, it might be similar to the price crossing below a certain length of EMA.
Our goal was simple: to figure out if there is any connection between RSI and EMA.
Conclusion: Yes, it seems that there is a correlation between RSI and EMA, and this indicator clearly displays that relationship. Read more about the study here:
█ Overview of the indicator
The RSI Exponential Smoothing indicator displays RSI levels with clear overbought and oversold zones, shown as easy-to-understand moving averages, and the RSI 50 line as an EMA. Another excellent feature is the added FIB levels. To activate, open the settings and click on "FIB Bands." These levels act as short-term support and resistance levels which can be used for scalping.
█ Benefits of using this indicator instead of regular RSI
The findings about the Relative Strength Index (RSI) and the Exponential Moving Average (EMA) highlight that both indicators are equally accurate (when it comes to crossings), meaning traders can choose either one without compromising accuracy. This empowers traders to pick the indicator that suits their personal preferences and trading style.
█ How it works
Crossings over/under the value of 50
The EMA line in the indicator acts as the corresponding 50 line in the RSI. When the RSI crosses the value 50 equals when Close crosses the EMA line.
Bouncess from the value 50
In this example, we can see that the EMA line on the chart acts as support/resistance equals when RSI rejects the 50 level.
Overbought and Oversold
The indicator comes with overbought and oversold bands equal when RSI becomes overbought or oversold.
█ How to use
This visual representation helps traders to apply RSI strategies directly on the price chart, potentially making RSI trading easier for traders.
-----------------
Disclaimer
The information contained in my Scripts/Indicators/Ideas/Algos/Systems does not constitute financial advice or a solicitation to buy or sell any securities of any type. I will not accept liability for any loss or damage, including without limitation any loss of profit, which may arise directly or indirectly from the use of or reliance on such information.
All investments involve risk, and the past performance of a security, industry, sector, market, financial product, trading strategy, backtest, or individual's trading does not guarantee future results or returns. Investors are fully responsible for any investment decisions they make. Such decisions should be based solely on an evaluation of their financial circumstances, investment objectives, risk tolerance, and liquidity needs.
My Scripts/Indicators/Ideas/Algos/Systems are only for educational purposes!

Volume Breakout [Afnan]Introducing the Relative Volume / Volume Breakout Multiplier (RVI) , RVI is specifically designed for traders who incorporate volume breakout analysis into their trading strategies, particularly breakout traders.
This indicator provides a unique perspective on volume dynamics by quantifying the extent of volume breakouts in relation to the Simple Moving Average (SMA). It offers an upgraded version of the default volume indicator on TradingView, with the added feature of Relative Volume.
For example, if the volume SMA is 100M and the current volume is 200M, the indicator will return a breakout number of 2.0, indicating that the current volume is twice that of the volume SMA. Conversely, if the volume SMA is 100M and the current volume is 50M, the indicator will return a value of 0.50, indicating that the current volume is half of the volume SMA.
This tool can be a very helpful for breakout traders, helping them identify potential trading opportunities and assess volume strength more effectively. this indicator is a must-have in the toolkit of any trader who focuses on volume breakout analysis.
Remember, every tool we use, every analysis we perform, is a step towards becoming better traders. So, let’s embrace this journey of continuous learning and improvement together. As the saying goes, “The only limit to our realization of tomorrow will be our doubts of today." Let’s step into the future with confidence, armed with the right tools and the right mindset.
Lastly, a big thank you for your support, your likes, and your comments. They mean a lot! If you have any questions, feel free to ask. Together, let’s make trading a rewarding experience!

Oversold RSI with tight SL Strategy (by Coinrule)This is one of the best strategies that can be used to get familiar with technical indicators and start to include them in your trading bot rules.
ENTRY
1. This trading system uses the RSI ( Relative Strength Index ) to anticipate good points to enter positions. RSI is a technical indicator frequently used in trading. It works by measuring the speed and change of price movements to determine whether a coin is oversold (indicating a good entry point) or overbought (indicating a point of exit/entry for a short position). The RSI oscillates between 0 and 100 and is traditionally considered overbought when over 70 and oversold when below 30.
2. To pick the right moment to buy, the strategy enters a trade when the RSI falls below 30 indicating the coin is oversold and primed for a trend reversal.
EXIT
The strategy then exits the position when the price appreciates 7% from the point of entry. The position also maintains a tight stop-loss and closes the position if the price depreciates 1% from the entry price. The idea behind this is to cut your losing trades fast and let your winners ride.
The best time frame for this strategy based on our backtesting data is the daily. Shorter time frames can also work well on certain coins, however in our experience, the daily works best. Feel free to experiment with this script and test it on a variety of your coins! With our backtesting data a trading fee of 0.1% is taken into account. The fee is aligned to the base fee applied on Binance, which is the largest cryptocurrency exchange by volume. In the example shown, this strategy made a handsome net profit of 39.31% on Chainlink with 61.54% of trades being profitable.

Market Smith IndicatorsMarket Smith has a collection of tools that are useful for identifying stocks. On their charts they have a 21/50/200 day moving averages, high and low pivot points, a relative strength line, and a relative strength rating. This script contains indicators for the following:
21/50/200 Day Moving Averages
High and Low pivot points
A Relative Strength line
A Relative Strength rating
21/50/200 Day Moving Averages
The 21/50/200 Day moving averages are simple moving averages. They are visible in any chart increment but to use them properly you need to set you charts to be by day. Labels will appear on the right of the lines to show that they are representative of 21/50/200 day moving averages.
High and Low pivot points
The High and Low pivot points are green for high pivot points and red for low points. They are show in the Market Smith style with the numbers simply above the pivot points.
Relative Strength line
The Relative Strength line is a line that shows the strength of the stock compared to the S&P 500. In this case we utilize the SPX ticker to compare the stock to. This line is almost identical to the Market Smith tool and is an excellent tool to determine how a stock is doing compared to the market. When movements in the stock and shown with sideways trending of the RS line that means that the stock is following the market. When a stock is outperforming the market the RS line will follow.
Relative Strength rating
Thank you to ©Fred6724 for the RS Rating inspiration. They wrote excellent open source code for a RS Rating comparable to Market Smith. As the RS Rating in Market Smith is not open source it is difficult to know exactly how it is being calculated. After simplifying Fred's code and building upon a few ideas I had I compared the RS Rating to multiple Market Smith Ratings. The rating is close but often off by multiple points. If there is anyone who has a better idea on how to get this rating or how to improve on the code please send me a PM or fork this project. This rating is a good indicator to see how a certain stock compares to other stocks in the market. In Market Smith they are able to utilize their database to compare it to all other stocks. Since we do not have access to the same tools we are only able to compare it to the percentage of stocks above the 200, 150, 100, 50, and 20 day moving average.
Using these tools together are a small fraction what make people like Bill O'neill and Jim Roppel so successful. I plan on updating the RS Rating as I continue to work on this project so if there is anyone who has ideas then please send me a PM. Ultimately the goal of this project is to have a solution that is identical to Market Smith.

Industry Group Strength - IndiaPresenting the Industry Group Strength Indicator for India market, designed to help traders identify top-performing stocks within specific industry groups that are predefined.
⦿ Identifies Leading Stocks in Industry Groups
⦿ Analyses the following metrics
YTD Return : Measures stock performance from the start of the year.
RS Rating : Relative Strength rating for user-selected periods.
% Return : Percentage return over a user-selected lookback period.
Features
This indicator dynamically recognises the industry group of the current stock on the chart and ranks stocks within that group based on predefined data points. Traders can add this indicator to focus on top-performing stocks relative to their industry.
⦿ Color-coded for Easy Visualisation
You can choose from the following key metrics to rank stocks:
YTD Return
RS Rating
% Return
⦿ Table Format with Performance Metrics Compact mode
Vertical View
Horizontal View
All of the three metrics are shown in the compact mode and the current stock that is viewed is highlighted!
Vertical view
Horizontal view
Stock Ranking
Stocks are ranked based on their performance within industry groups, enabling traders to easily spot leaders and laggards in each sector. Color-coded gradients visually represent the stocks’ performance rankings, with higher percentile rankings indicating better performance.
Relative Strength (RS)
Relative Strength (RS) compares a stock’s performance against the benchmark index. The RS value is normalized from 1 to 99, making it easier to compare across different stocks. A rising RS value indicates that the stock is outperforming the market, helping traders quickly gauge relative performance within industry groups.
Limitations
At the time of developing this indicator, Pine requests are limited to 40 per script so the predefined symbols had to be filtered to 40 per Industry group
Stocks Filters
Filters that are used to filter the stocks in an Industry group to have maximum of 40 stocks
⦿ Auto, Chemical, Engineering, Finance, Pharma
Market Cap >= 1000 Crores and Market Cap <= 60000 Crores
Price >= 30 and Price <= 6000
50 Days Average ( Price * Volume ) >= 6 Crores
⦿ For rest of the Industry groups
Market Cap >= 1000 Crores and Market Cap <= 100000 Crores
Price >= 20 and Price <= 10000
50 Days Average ( Price * Volume ) >= 3 Crores
Credits
This indicator is forked from the Script for US market by @Amphibiantrading Thanks Brandon for the beginning of this indicator.
This indicator is built on TradingView’s new dynamic requests feature, thanks to @PineCoders for making this possible!

Advanced Volume-Driven Breakout SignalsThe "Advanced Volume-Driven Breakout Signals" indicator is a cutting-edge tool designed to help traders identify high-potential trading opportunities through sophisticated volume analysis techniques. This indicator integrates volume flow analysis, moving averages, and Relative Volume (RVOL) to provide a comprehensive view of market conditions, going beyond traditional Volume Spread Analysis (VSA) methods.
Key Features:
Volume Flow Analysis: Distinguishes bullish and bearish volume flows with distinct colors, making it easier to visualize market sentiment and potential breakout points.
Volume Flow Moving Averages: Calculates moving averages for volume using various methods (SMA, EMA, WMA, HMA, VWMA), accommodating different trading strategies. This includes settings for adjusting the type of moving average and its period, as well as thresholds for high, medium, and low volume levels.
Volume Spikes Detection: Identifies significant volume spikes based on user-defined multipliers and moving averages, highlighting unusual trading activity.
Volume MA Cloud Settings: Computes general moving averages of volume to track trends and detect deviations. This feature includes options to select different moving average types and adjust thresholds for detecting high volume activity.
Relative Volume (RVOL): Measures current volume relative to historical averages, triggering signals when RVOL exceeds predefined thresholds, indicating notable changes in trading activity.
Entry Conditions: Provides clear long and short entry signals based on combined volume flow conditions and RVOL, offering actionable trading opportunities.
Volume Visualization:
— Bullish Volume Flow: Light and dark green bars indicate bullish volume flow.
— Bearish Volume Flow: Light and dark red bars denote bearish volume flow.
— High Volume Bars: Highlighted in yellow, and extreme volume bars in orange for additional context. These bars are plotted for visual aid and do not directly influence trade signals, focusing instead on the quality and strength of the volume flow.
Alerts: Allows users to create alert notifications for long and short entry signals when the criteria are met, enabling traders to respond promptly to trading opportunities.
Usage:
Overlay: Apply the indicator directly to your price chart to visualise real-time signals and volume conditions.
Customisable: Adjust settings for moving averages, RVOL, and other parameters to match your trading strategy and preferences.
Comparison to VSA Scripts: The "Advanced Volume-Driven Breakout Signals" indicator extends beyond traditional VSA scripts by incorporating a wider range of analytical features. While VSA primarily focuses on volume spread patterns and price action, this indicator offers enhanced functionality with advanced RVOL metrics, customizable moving averages, and detailed volume spike detection, making it a more versatile tool for identifying breakout opportunities and managing trades. It is particularly effective when used alongside key levels and order blocks.
Acknowledgements: Special thanks to @oh92 and @goofoffgoose for their invaluable scripts, which served as inspiration in the development of this advanced trading indicator.
Notes: The script is continually evolving, with ongoing refinements aimed at enhancing accuracy and performance.

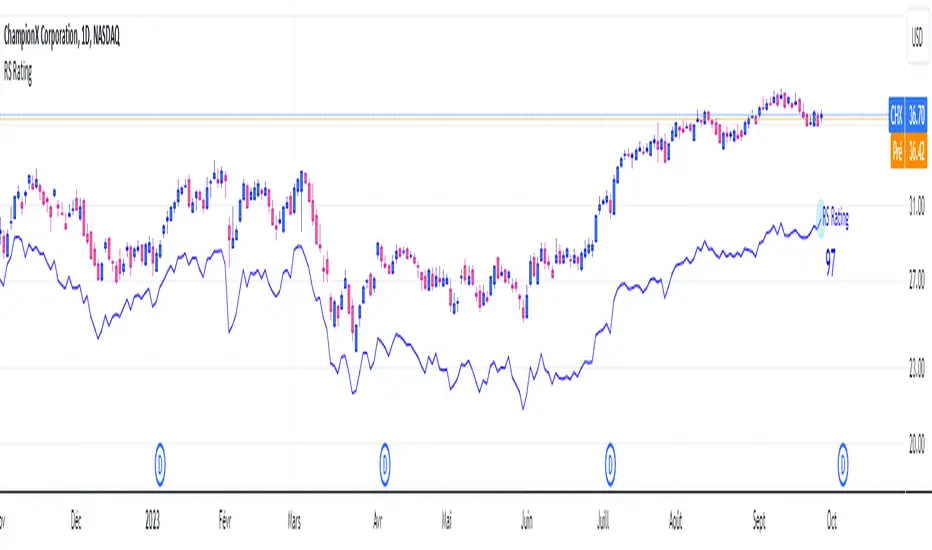
RS RatingHello everyone.
The RS Rating (or Relative Strenght Rating) is a metric that tracks a stock's price performance relative to the rest of the market. Specifically, it looks at a stock's relative strength over the last 52 weeks.
It allows you to identify at a glance stocks that are outperforming the market and may be poised for further gains.
Designed for break-out traders, trend follower, value investors, the RS Rating can help you identify promising opportunities and make informed investment decisions.
The Rating stands as follow:
- From 1 (worst) to 99 (best)
- 99 rating means the stock is outperforming 99% of all stocks in terms of relative share price performance over the last 52 weeks.
The RS Rating is accompanied by the RS line which is a representation of the progress of the asset against the comparative symbol. (Here SP500)
Of course this script is inspired by the IBD rating system.
The results may be equivalent but it is not guaranteed.
This indicator proposes a scoring system in the style of the one proposed by IBD.
Indeed for an optimal result, it would be necessary to compare the relative performance of all actions, which is not yet possible on PineScript.
Here is the formula for calculating the score:
RS Score = 40% * P3 + 20% * P6 + 20% * P9 + 20% * P12
With
P3 = Performance over the last 3 months
P6 = Performance over the last 6 months
P9 = Performance over the last 9 months
P12 = Performance over the last 12 months
There is no equivalent solution for the moment on TradingView.
The rating score will only appear on the daily timeframe.
For now it's my pleasure to share!
RedK EVEREX - Effort Versus Results ExplorerRedK EVEREX is an experimental indicator that explores "Volume Price Analysis" basic concepts and Wyckoff law "Effort versus Result" - by inspecting the relative volume (effort) and the associated (relative) price action (result) for each bar - showing the analysis as an easy to read "stacked bands" visual. From that analysis, we calculate a "Relative Rate of Flow" - an easy to use +100/-100 oscilator that can be used to trigger a signal when a bullish or bearish mode is detected for a certain user-selected length of bars.
Basic Concepts of VPA
-------------------------------
(The topics of VPA & Wyckoff Effort vs Results law are too comprehensive to cover here - So here's just a very basic summary - please review these topics in detail in various sources available here in TradingView or on the web)
* Volume Price Analysis (VPA) is the examination of the number of shares or contracts of a security that have been traded in a given period, and the associated price movement. By analyzing trends in volume in conjunction with price movements, traders can determine the significance of changes in price and what may unfold in the near future.
* Oftentimes, high volumes of trading can infer a lot about investors’ outlook on a market or security. A significant price increase along with a significant volume increase, for example, could be a credible sign of a continued bullish trend or a bullish reversal. Adversely, a significant price decrease with a significant volume increase can point to a continued bearish trend or a bearish trend reversal.
* Incorporating volume into a trading decision can help an investor to have a more balanced view of all the broad market factors that could be influencing a security’s price, which helps an investor to make a more informed decision.
* Wyckoff's law "Effort versus results" dictates that large effort is expected to be accompanied with big results - which means that we should expect to see a big price move (result) associated with a large relative volume (effort) for a certain trading period (bar).
* The way traders use this concept in chart analysis is to mainly look for imbalances or invalidation. for example, when we observe a large relative volume that is associated with very limited price change - that should trigger an early flag/warning sign that the current price trend is facing challenges and may be an early sign of "reversal" - this applies in both bearish and bullish conditions. on the other hand, when price starts to trend in a certain direction and that's associated with increasing volume, that can act as kind of validation, or a confirmation that the market supports that move.
How does EVEREX work
---------------------------------
* EVEREX inspects each bar and calculates a relative value for volume (effort) and "strength of price movement" (result) compared to a specified lookback period. The results are then visualized as stacked bands - the lower band represents the relative volume, the upper band represents the relative price strength - with clear color coding for easier analysis.
* The scale of the band is initially set to 100 (each band can occupy up to 50) - and that can be changed in the settings to 200 or 400 - mainly to allow a "zoom in" on the bands.
* Reading the resulting stacked bands makes it easier to see "balanced" volume/price action (where both bands are either equally strong, or equally weak), or when there's imbalance between volume and price (for example, a compression bar will show with high volume band and very small/tiny price action band) - another favorite pattern in VPA is the "Ease of Move", which will show as a relatively small volume band associated with a large "price action band" (either bullish or bearish) .. and so on.
* a bit of a techie piece: why the use of a custom "Normalize()" function to calculate "relative" values in EVEREX?
When we evaluate a certain value against an average (for example, volume) we need a mechanism to deal with "super high" values that largely exceed that average - I also needed a mechanism that mimics how a trader looks at a volume bar and decides that this volume value is super low, low, average, above average, high or super high -- the issue with using a stoch() function, which is the usual technique for comparing a data point against a lookback average, is that this function will produce a "zero" for low values, and cause a large distortion of the next few "ratios" when super large values occur in the data series - i researched multiple techniques here and decided to use the custom Normalize() function - and what i found is, as long as we're applying the same formula consistently to the data series, since it's all relative to itself, we can confidently use the result. Please feel free to play around with this part further if you like - the code is commented for those who would like to research this further.
* Overall, the hope is to make the bar-by-bar analysis easier and faster for traders who apply VPA concepts in their trading
What is RROF?
--------------------------
* Once we have the values of relative volume and relative price strength, it's easy from there to combine these values into a moving index that can be used to track overall strength and detect reversals in market direction - if you think about it this a very similar concept to a volume-weighted RSI. I call that index the "Relative Rate of Flow" - or RROF (cause we're not using the direct volume and price values in the calculation, but rather relative values that we calculated with the proprietary "Normalize" function in the script.
* You can show RROF as a single or double-period - and you can customize it in terms of smoothing, and signal line - and also utilize the basic alerts to get notified when a change in strength from one side to the other (bullish vs bearish) is detected
* In the chart above, you can see how the RROF was able to detect change in market condition from Bearsh to Bullish - then from Bullish to Bearish for TSLA with good accuracy.
Other Usage Options in EVEREX
------------------------------------
* I wrote EVEREX with a lot of flexibility and utilization in mind, while focusing on a clean and easy to use visual - EVEREX should work with any time frame and any instrument - in instruments with no volume data, only price data will be used.
* You can completely hide the "EVEREX bands" and use EVEREX as a single or dual period strength indicator (by exposing the Bias/Sentiment plot which is hidden by default) -
here's how this setup would look like - in this mode, you will basically be using EVEREX the same way you're using a volume-weighted RSI
* or you can hide the bias/sentiment, and expose the Bulls & Bears plots (using the indicator's "Style" tab), and trade it like a Bull/Bear Pressure Index like this
* you can choose Moving Average type for most plot elements in EVEREX, including how to deal with the Lookback averaging
* you can set EVEREX to a different time frame than the chart
* did i mention basic alerts in this v1.0 ?? There's room to add more VPA-specific alerts in future version (for example, when Ease-of-Move or Compression bars are detected...etc) - let me know if the comments what you want to see
Final Thoughts
--------------------
* EVEREX can be used for bar-by-bar VPA analysis - There are so much literature out there about VPA and it's highly recommended that traders read more about what VPA is and how it works - as it adds an interesting (and critical) dimension to technical analysis and will improve decision making
* RROF is a "strength indicator" - it does not track price values (levels) or momentum - as you will see when you use it, the price can be moving up, while the RROF signal line starts moving down, reflecting decreasing strength (or otherwise, increasing bear strength) - So if you incorporate EVEREX in your trading you will need to use it alongside other momentum and price value indicators (like MACD, MA's, Trend Channels, Support & Resistance Lines, Fib / Donchian..etc) - to use for trade confirmation

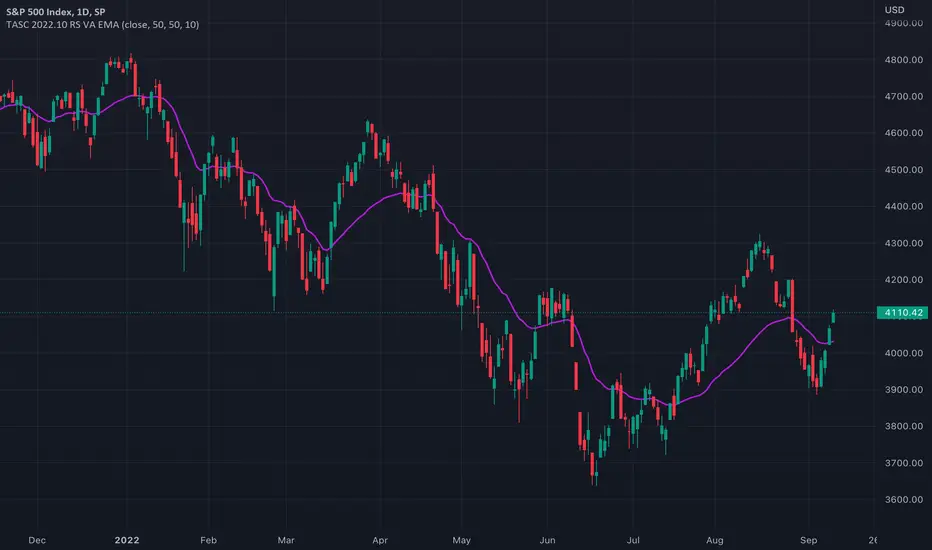
TASC 2022.10 RS VA EMA█ OVERVIEW
TASC's October 2022 edition Traders' Tips includes the second part of the "Relative Strength Moving Averages" article series authored by Vitali Apirine. This is the code that implements the Relative Strength Volume-Adjusted Exponential Moving Average (RS VA EMA) presented in this publication.
█ CONCEPTS
In his article series, the author argues that the relative strength of price, volume, and volatility can potentially be used to filter price movements and define turning points. In particular, the RS VA EMA indicator is designed to account for the relative strength of volume. Like the traditional exponential moving average (EMA) , it is a lagging trend-following indicator. The difference is that it responds more quickly.
In a trading strategy, RS VA EMA is suggested to be used in combination with EMA of the same length to determine the overall trend or in combination with RS VA EMA of a different length to identify turning points and filter price movements.
█ CALCULATIONS
The calculation of RS VA EMA is based on the concept of volume strength (VS). By definition, VS measures the difference between "positive" and "negative" volume flow. Volume is indicated as "positive" when the close is higher than the previous close and "negative" when the close is below the previous close.
The following steps are used in the calculation process:
• Calculate the volume strength (VS) of a given length.
• Multiply VS by a predefined multiplier and calculate the EMA of the resulting time series.
The values of 10,10,10 are the typical input settings for RS VA EMA, where the first parameter is the length of the moving average, the second is the length of VS, and the third is the volume strength multiplier.
VWAP Adaptive (RelVol-Adjusted)This indicator provides an Adaptive VWAP that adjusts volume weighting using RelVol (Relative Volume at Time), offering a more accurate and context-aware price reference during sessions with irregular volume behavior.
Classic VWAP calculates the average price weighted by raw volume, without considering the time of day. This becomes a serious limitation during major market events such as CPI releases, FOMC announcements, NFP, or large-cap earnings. These events often trigger massive volume spikes within one or two candles. As a result, the classic VWAP gets pulled toward those extreme prices and becomes permanently skewed for the rest of the session.
In such conditions, classic VWAP becomes unreliable. It no longer reflects fair value and often misleads traders relying on it for dynamic support, resistance, or reversion signals.
This Adaptive VWAP improves on that by using RelVol, which compares the current volume to the average volume seen at the same time over previous sessions. It gives more weight to price when volume is typical for that moment, and adjusts the influence when volume is statistically abnormal. This reduces the impact of isolated volume spikes and stabilizes the VWAP path, even in high-volatility environments.
For example, on SPY 1-minute or 5-minute charts during a CPI release, a massive spike in volume and price can occur within a single candle. Classic VWAP will immediately anchor itself to that spike. Adaptive VWAP using RelVol softens that effect and maintains a more realistic trajectory.
Key features:
- Adaptive VWAP weighted by time-adjusted Relative Volume (RelVol)
- Designed to maintain VWAP reliability during macroeconomic events
- Flexible anchoring: Session, Week, Month, Quarter, Earnings, etc.
- Optional display of Classic VWAP for comparison
- Up to 3 customizable deviation bands (standard deviation or percentage)
This tool is ideal for intraday traders who need a VWAP that remains usable and unbiased, even in volatile sessions. It adds robustness to VWAP-based strategies by incorporating time-sensitive volume normalization.

Money Flow ExtendedMoney Flow Extended (MF)
Definition
The Money Flow Extended (MF) indicator brings together the functionality of the Money Flow Index indicator (MFI) , a tool created by Gene Quong and Avrum Soudack and used in technical analysis for measuring buying and selling pressure, and The Relative Strength Index (RSI) , a well versed momentum based oscillator created by J.Welles Wilder Jr., which is used to measure the speed (velocity) as well as the change (magnitude) of directional price movements.
History
As the Money Flow Index (MFI) is quite similar to The Relative Strength Index (RSI), essentially the RSI with the added aspect of volume, adding a Moving Average, divergence calculation, oversold and overbought gradients, facilitates the transition from RSI, making the use of MFI pretty similar.
What to look for
Overbought/Oversold
When momentum and price rise fast enough, at a high enough level, eventual the security will be considered overbought. The opposite is also true. When price and momentum fall far enough, they can be considered oversold. Traditional overbought territory starts above 80 and oversold territory starts below 20. These values are subjective however, and a technical analyst can set whichever thresholds they choose.
Divergence
MF Divergence occurs when there is a difference between what the price action is indicating and what MF is indicating. These differences can be interpreted as an impending reversal. Specifically, there are two types of divergences, bearish and bullish.
Bullish MFI Divergence – When price makes a new low but MF makes a higher low.
Bearish MFI Divergence – When price makes a new high but MF makes a lower high.
Failure Swings
Failure swings are another occurrence which can lead to a price reversal. One thing to keep in mind about failure swings is that they are completely independent of price and rely solely on MF. Failure swings consist of four steps and are considered to be either Bullish (buying opportunity) or Bearish (selling opportunity).
Bullish Failure Swing
MF drops below 20 (considered oversold).
MF bounces back above 20.
MF pulls back but remains above 20 (remains above oversold)
MF breaks out above its previous high.
Bearish Failure Swing
MF rises above 80 (considered overbought)
MF drops back below 80
MF rises slightly but remains below 80 (remains below overbought)
MF drops lower than its previous low.
Summary
The Money Flow Extended (MF) can be a very valuable technical analysis tool. Of course, MF should not be used alone as the sole source for a trader’s signals or setups. MF can be combined with additional indicators or chart pattern analysis to increase its effectiveness.
Inputs
Length
The time period to be used in calculating the MF. 14 is the default.
Pivot Loopback
After how many bars you want the divergence to show, on the scale of 1-5. 5 is the default.
Calculate Divergence
Calculating divergences is needed in order for divergence alerts to fire.
Moving Average section
You can learn more about the inputs in the "Moving Average" section in this Help Center article .
Style
MF
Can toggle the visibility of the MF as well as the visibility of a price line showing the actual current value of the MF. Can also select the MF Line's color, line thickness and visual style.
MF-based MA
Can toggle the visibility of the MF-based MA as well as the visibility of a price line showing the actual current MA value. Can also select its color, line thickness and line style.
MF Upper Band
Can toggle the visibility of the Upper Band as well as sets the boundary, on the scale of 1-100, for the Upper Band (80 is the default). The color, line thickness and line style can also be determined.
MF Middle Band
Can toggle the visibility of the Middle Band as well as sets the boundary, on the scale of 1-100, for the Middle Band (50 is the default). The color, line thickness and line style can also be determined.
MF Lower Band
Can toggle the visibility of the Lower Band as well as sets the boundary, on the scale of 1-100, for the Lower Band (20 is the default). The color, line thickness and line style can also be determined.
MF Background Fill
Toggles the visibility of a Background color within the MF's boundaries. Can also change the Color itself as well as the opacity.
Overbought Gradient Fill
Can toggle the visibility of the Overbought Gradient Fill. Can also select its colors combination.
Oversold Gradient Fill
Can toggle the visibility of the Oversold Gradient Fill. Can also select its colors combination.
Precision
Sets the number of decimal places to be left on the indicator's value before rounding up. The higher this number, the more decimal points will be on the indicator's value.

RS Cycles [QuantVue]The RS Cycles indicator is a technical analysis tool that expands upon traditional relative strength (RS) by incorporating Beta-based adjustments to provide deeper insights into a stock's performance relative to a benchmark index. It identifies and visualizes positive and negative performance cycles, helping traders analyze trends and make informed decisions.
Key Concepts:
Traditional Relative Strength (RS):
Definition: A popular method to compare the performance of a stock against a benchmark index (e.g., S&P 500).
Calculation: The traditional RS line is derived as the ratio of the stock's closing price to the benchmark's closing price.
RS=Stock Price/Benchmark Price
Usage: This straightforward comparison helps traders spot periods of outperformance or underperformance relative to the market or a specific sector.
Beta-Adjusted Relative Strength (Beta RS):
Concept: Traditional RS assumes equal volatility between the stock and benchmark, but Beta RS accounts for the stock's sensitivity to market movements.
Calculation:
Beta measures the stock's return relative to the benchmark's return, adjusted by their respective volatilities.
Alpha is then computed to reflect the stock's performance above or below what Beta predicts:
Alpha=Stock Return−(Benchmark Return×β)
Significance: Beta RS highlights whether a stock outperforms the benchmark beyond what its Beta would suggest, providing a more nuanced view of relative strength.
RS Cycles:
The indicator identifies positive cycles when conditions suggest sustained outperformance:
Short-term EMA (3) > Mid-term EMA (10) > Long-term EMA (50).
The EMAs are rising, indicating positive momentum.
RS line shows upward movement over a 3-period window.
EMA(21) > 0 confirms a broader uptrend.
Negative cycles are marked when the opposite conditions are met:
Short-term EMA (3) < Mid-term EMA (10) < Long-term EMA (50).
The EMAs are falling, indicating negative momentum.
RS line shows downward movement over a 3-period window.
EMA(21) < 0 confirms a broader downtrend.
This indicator combines the simplicity of traditional RS with the analytical depth of Beta RS, making highlighting true relative strength and weakness cycles.

two_leg_spread_returns_zscoreThis script helps assess the relative returns of each leg in a two-legged spread. It shows the z-score of each period's returns, along with a moving average of the difference between the two returns. A negative moving average implies that the second leg is strengthening, on a relative return basis, against the first leg, and vice versa. The inputs are:
- timeframe: the timeframe for the calculations. the default is five minutes.
- leg1_sym: the symbol for the first leg
- leg2_sym: the symbol for the second leg
- ma_length: the length of the moving average. by default it is 48, or the previous four hours, given the default timeframe.
The default symbols are RB and HO, simply as an example of an intercommodity spread.

Poly Cycle [Loxx]This is an example of what can be done by combining Legendre polynomials and analytic signals. I get a way of determining a smooth period and relative adaptive strength indicator without adding time lag.
This indicator displays the following:
The Least Squares fit of a polynomial to a DC subtracted time series - a best fit to a cycle.
The normalized analytic signal of the cycle (signal and quadrature).
The Phase shift of the analytic signal per bar.
The Period and HalfPeriod lengths, in bars of the current cycle.
A relative strength indicator of the time series over the cycle length. That is, adaptive relative strength over the cycle length.
The Relative Strength Indicator, is adaptive to the time series, and it can be smoothed by increasing the length of decreasing the number of degrees of freedom.
Other adaptive indicators based upon the period and can be similarly constructed.
There is some new math here, so I have broken the story up into 5 Parts:
Part 1:
Any time series can be decomposed into a orthogonal set of polynomials .
This is just math and here are some good references:
Legendre polynomials - Wikipedia, the free encyclopedia
Peter Seffen, "On Digital Smoothing Filters: A Brief Review of Closed Form Solutions and Two New Filter Approaches", Circuits Systems Signal Process, Vol. 5, No 2, 1986
I gave some thought to what should be done with this and came to the conclusion that they can be used for basic smoothing of time series. For the analysis below, I decompose a time series into a low number of degrees of freedom and discard the zero mode to introduce smoothing.
That is:
time series => c_1 t + c_2 t^2 ... c_Max t^Max
This is the cycle. By construction, the cycle does not have a zero mode and more physically, I am defining the "Trend" to be the zero mode.
The data for the cycle and the fit of the cycle can be viewed by setting
ShowDataAndFit = TRUE;
There, you will see the fit of the last bar as well as the time series of the leading edge of the fits. If you don't know what I mean by the "leading edge", please see some of the postings in . The leading edges are in grayscale, and the fit of the last bar is in color.
I have chosen Length = 17 and Degree = 4 as the default. I am simply making sure by eye that the fit is reasonably good and degree 4 is the lowest polynomial that can represent a sine-like wave, and 17 is the smallest length that lets me calculate the Phase Shift (Part 3 below) using the Hilbert Transform of width=7 (Part 2 below).
Depending upon the fit you make, you will capture different cycles in the data. A fit that is too "smooth" will not see the smaller cycles, and a fit that is too "choppy" will not see the longer ones. The idea is to use the fit to try to suppress the smaller noise cycles while keeping larger signal cycles.
Part 2:
Every time series has an Analytic Signal, defined by applying the Hilbert Transform to it. You can think of the original time series as amplitude * cosine(theta) and the transformed series, called the quadrature, can be thought of as amplitude * sine(theta). By taking the ratio, you can get the angle theta, and this is exactly what was done by John Ehlers in . It lets you get a frequency out of the time series under consideration.
Amazon.com: Rocket Science for Traders: Digital Signal Processing Applications (9780471405672): John F. Ehlers: Books
It helps to have more references to understand this. There is a nice article on Wikipedia on it.
Read the part about the discrete Hilbert Transform:
en.wikipedia.org
If you really want to understand how to go from continuous to discrete, look up this article written by Richard Lyons:
www.dspguru.com
In the indicator below, I am calculating the normalized analytic signal, which can be written as:
s + i h where i is the imagery number, and s^2 + h^2 = 1;
s= signal = cosine(theta)
h = Hilbert transformed signal = quadrature = sine(theta)
The angle is therefore given by theta = arctan(h/s);
The analytic signal leading edge and the fit of the last bar of the cycle can be viewed by setting
ShowAnalyticSignal = TRUE;
The leading edges are in grayscale fit to the last bar is in color. Light (yellow) is the s term, and Dark (orange) is the quadrature (hilbert transform). Note that for every bar, s^2 + h^2 = 1 , by construction.
I am using a width = 7 Hilbert transform, just like Ehlers. (But you can adjust it if you want.) This transform has a 7 bar lag. I have put the lag into the plot statements, so the cycle info should be quite good at displaying minima and maxima (extrema).
Part 3:
The Phase shift is the amount of phase change from bar to bar.
It is a discrete unitary transformation that takes s + i h to s + i h
explicitly, T = (s+ih)*(s -ih ) , since s *s + h *h = 1.
writing it out, we find that T = T1 + iT2
where T1 = s*s + h*h and T2 = s*h -h*s
and the phase shift is given by PhaseShift = arctan(T2/T1);
Alas, I have no reference for this, all I doing is finding the rotation what takes the analytic signal at bar to the analytic signal at bar . T is the transfer matrix.
Of interest is the PhaseShift from the closest two bars to the present, given by the bar and bar since I am using a width=7 Hilbert transform, bar is the earliest bar with an analytic signal.
I store the phase shift from bar to bar as a time series called PhaseShift. It basically gives you the (7-bar delayed) leading edge the amount of phase angle change in the series.
You can see it by setting
ShowPhaseShift=TRUE
The green points are positive phase shifts and red points are negative phase shifts.
On most charts, I have looked at, the indicator is mostly green, but occasionally, the stock "retrogrades" and red appears. This happens when the cycle is "broken" and the cycle length starts to expand as a trend occurs.
Part 4:
The Period:
The Period is the number of bars required to generate a sum of PhaseShifts equal to 360 degrees.
The Half-period is the number of bars required to generate a sum of phase shifts equal to 180 degrees. It is usually not equal to 1/2 of the period.
You can see the Period and Half-period by setting
ShowPeriod=TRUE
The code is very simple here:
Value1=0;
Value2=0;
while Value1 < bar_index and math.abs(Value2) < 360 begin
Value2 = Value2 + PhaseShift ;
Value1 = Value1 + 1;
end;
Period = Value1;
The period is sensitive to the input length and degree values but not overly so. Any insight on this would be appreciated.
Part 5:
The Relative Strength indicator:
The Relative Strength is just the current value of the series minus the minimum over the last cycle divided by the maximum - minimum over the last cycle, normalized between +1 and -1.
RelativeStrength = -1 + 2*(Series-Min)/(Max-Min);
It therefore tells you where the current bar is relative to the cycle. If you want to smooth the indicator, then extend the period and/or reduce the polynomial degree.
In code:
NewLength = floor(Period + HilbertWidth+1);
Max = highest(Series,NewLength);
Min = lowest(Series,NewLength);
if Max>Min then
Note that the variable NewLength includes the lag that comes from the Hilbert transform, (HilbertWidth=7 by default).
Conclusion:
This is an example of what can be done by combining Legendre polynomials and analytic signals to determine a smooth period without adding time lag.
________________________________
Changes in this one : instead of using true/false options for every single way to display, use Type parameter as following :
1. The Least Squares fit of a polynomial to a DC subtracted time series - a best fit to a cycle.
2. The normalized analytic signal of the cycle (signal and quadrature).
3. The Phase shift of the analytic signal per bar.
4. The Period and HalfPeriod lengths, in bars of the current cycle.
5. A relative strength indicator of the time series over the cycle length. That is, adaptive relative strength over the cycle length.

Non-Rescaled RSI█ OVERVIEW
Relative Strength Index is a momentum oscillator developed by J. Wilder. The original version of RSI rescaled the relative strength measurement to range. While the rescaling is useful for readability, This non-rescaled version tells the exact average relative strength of the movement for the past period, and give another way to put the relative strength reading into context of current market condition.
█ Description & How To Use
1. The (+/-) in relative strength value indicates the direction
Example 1: Relative Strength of 2.33 means average gain is 2.33 bigger than average loss for the past period (Equivalent to RSI 70)
Example 2: Relative Strength of -2.33 means average loss is 2.33 bigger than average gain for the past period (Equivalent to RSI 30)
Example 3: Relative Strength of 0 means average gain is equal to average loss for the past period (Equivalent to RSI 50)
Look at comparison below:
2. You can use it exactly how you would use RSI: Overbought/Oversold state, Divergence, Trend identification, Failure Swings etc..
█ Features
- Overbought/Oversold line still maintainable as standard RSI level (70,30) in user input screen. The script will recalculate and plot the ob/os level accordingly
- Value Label to indicate the RSI and RS value
- Custom Gradient Color Scheme
█ Limitation
The Relative Strength absolute value is capped at 20 to avoid ratio value too big(or too small). This is enough to get accurate equivalent of RSI reading between 5-95
█ Disclaimer
Past performance is not an indicator of future results.
My opinions and research are my own and do not constitute financial advice in any way whatsoever.
Nothing published by me constitutes an investment/trading recommendation, nor should any data or Content published by me be relied upon for any investment/trading activities.
I strongly recommends that you perform your own independent research and/or speak with a qualified investment professional before making any financial decisions.
