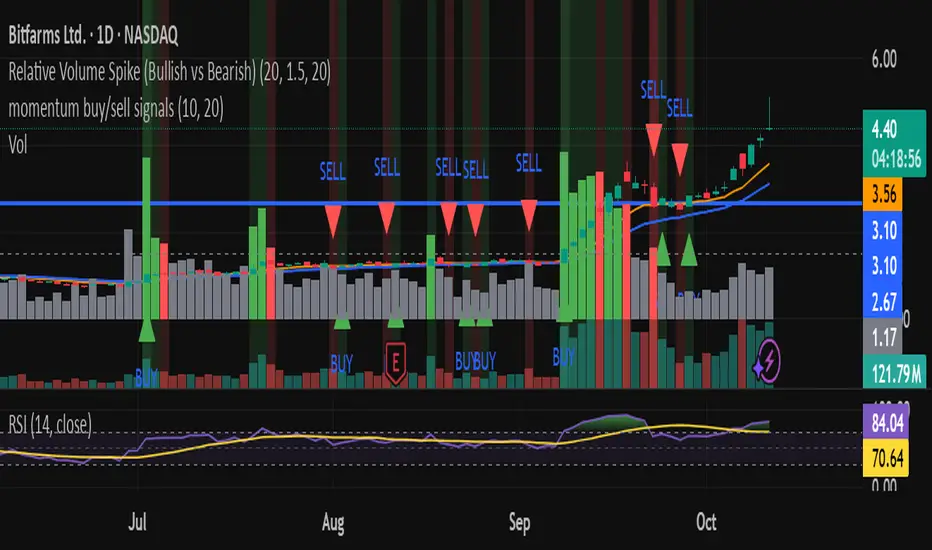
Relative Volume Spike (Bullish vs Bearish)relative volume compared to 20day averages
used to detect when big money is coming in.
"Relative" için komut dosyalarını ara
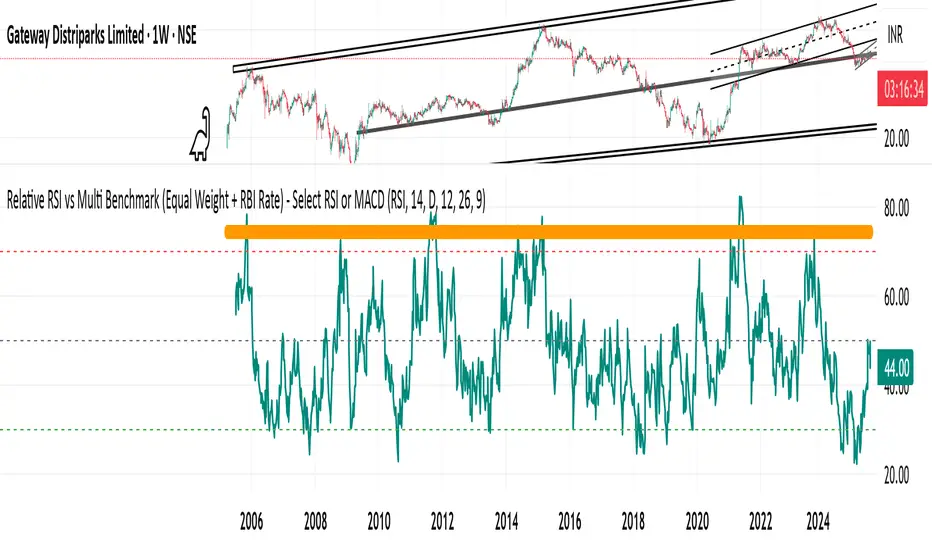
Relative RSI vs Multi Benchmark (Equal Weight + RBI Rate)Relative RSI vs Multi Benchmark (Equal Weight + RBI Rate) - Select RSI or MACD
Relative Weighted Rate of Change (WROC) vs Nifty 50Relative Weighted Rate of Change (WROC) vs Nifty 50


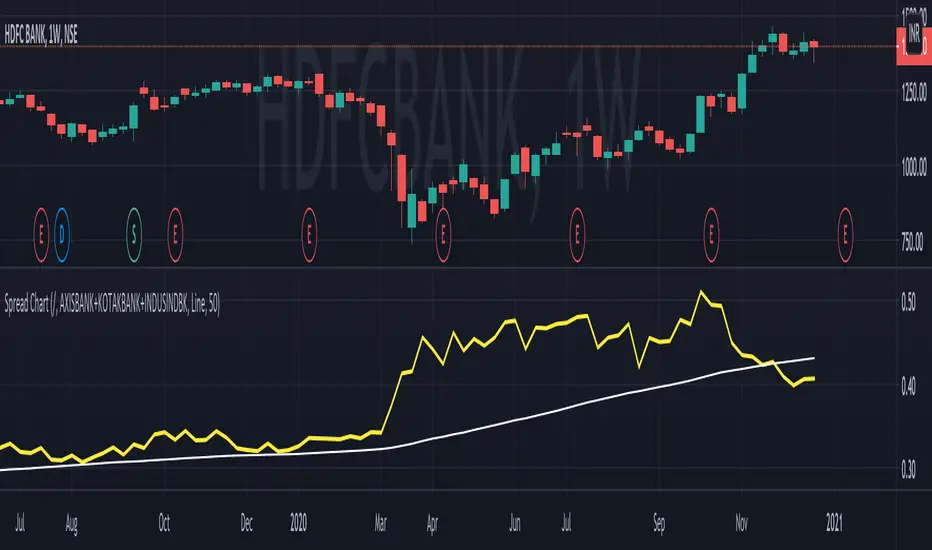
Relative chart analysis using arithmetic operatorsRelative chart analysis using arithmetic operators.
Relative Strength Index @ inflowjetRelative Strength Index 80/20 with extra 30/70 area and 50% dashed line


RelativeValue█ OVERVIEW
This library is a Pine Script™ programmer's tool offering the ability to compute relative values, which represent comparisons of current data points, such as volume, price, or custom indicators, with their analogous historical data points from corresponding time offsets. This approach can provide insightful perspectives into the intricate dynamics of relative market behavior over time.
█ CONCEPTS
Relative values
In this library, a relative value is a metric that compares a current data point in a time interval to an average of data points with corresponding time offsets across historical periods. Its purpose is to assess the significance of a value by considering the historical context within past time intervals.
For instance, suppose we wanted to calculate relative volume on an hourly chart over five daily periods, and the last chart bar is two hours into the current trading day. In this case, we would compare the current volume to the average of volume in the second hour of trading across five days. We obtain the relative volume value by dividing the current volume by this average.
This form of analysis rests on the hypothesis that substantial discrepancies or aberrations in present market activity relative to historical time intervals might help indicate upcoming changes in market trends.
Cumulative and non-cumulative values
In the context of this library, a cumulative value refers to the cumulative sum of a series since the last occurrence of a specific condition (referred to as `anchor` in the function definitions). Given that relative values depend on time, we use time-based conditions such as the onset of a new hour, day, etc. On the other hand, a non-cumulative value is simply the series value at a specific time without accumulation.
Calculating relative values
Four main functions coordinate together to compute the relative values: `maintainArray()`, `calcAverageByTime()`, `calcCumulativeSeries()`, and `averageAtTime()`. These functions are underpinned by a `collectedData` user-defined type (UDT), which stores data collected since the last reset of the timeframe along with their corresponding timestamps. The relative values are calculated using the following procedure:
1. The `averageAtTime()` function invokes the process leveraging all four of the methods and acts as the main driver of the calculations. For each bar, this function adds the current bar's source and corresponding time value to a `collectedData` object.
2. Within the `averageAtTime()` function, the `maintainArray()` function is called at the start of each anchor period. It adds a new `collectedData` object to the array and ensures the array size does not exceed the predefined `maxSize` by removing the oldest element when necessary. This method plays an essential role in limiting memory usage and ensuring only relevant data over the desired number of periods is in the calculation window.
3. Next, the `calcAverageByTime()` function calculates the average value of elements within the `data` field for each `collectedData` object that corresponds to the same time offset from each anchor condition. This method accounts for cases where the current index of a `collectedData` object exceeds the last index of any past objects by using the last available values instead.
4. For cumulative calculations, the `averageAtTime()` function utilizes the `isCumulative` boolean parameter. If true, the `calcCumulativeSeries()` function will track the running total of the source data from the last bar where the anchor condition was met, providing a cumulative sum of the source values from one anchor point to the next.
To summarize, the `averageAtTime()` function continually stores values with their corresponding times in a `collectedData` object for each bar in the anchor period. When the anchor resets, this object is added to a larger array. The array's size is limited by the specified number of periods to be averaged. To correlate data across these periods, time indexing is employed, enabling the function to compare corresponding points across multiple periods.
█ USING THIS LIBRARY
The library simplifies the complex process of calculating relative values through its intuitive functions. Follow the steps below to use this library in your scripts.
Step 1: Import the library and declare inputs
Import the library and declare variables based on the user's input. These can include the timeframe for each period, the number of time intervals to include in the average, and whether the calculation uses cumulative values. For example:
//@version=5
import TradingView/RelativeValue/1 as TVrv
indicator("Relative Range Demo")
string resetTimeInput = input.timeframe("D")
int lengthInput = input.int(5, "No. of periods")
Step 2: Define the anchor condition
With these inputs declared, create a condition to define the start of a new period (anchor). For this, we use the change in the time value from the input timeframe:
bool anchor = timeframe.change(resetTimeInput)
Step 3: Calculate the average
At this point, one can calculate the average of a value's history at the time offset from the anchor over a number of periods using the `averageAtTime()` function. In this example, we use True Range (TR) as the `source` and set `isCumulative` to false:
float pastRange = TVrv.averageAtTime(ta.tr, lengthInput, anchor, false)
Step 4: Display the data
You can visualize the results by plotting the returned series. These lines display the non-cumulative TR alongside the average value over `lengthInput` periods for relative comparison:
plot(pastRange, "Past True Range Avg", color.new(chart.bg_color, 70), 1, plot.style_columns)
plot(ta.tr, "True Range", close >= open ? color.new(color.teal, 50) : color.new(color.red, 50), 1, plot.style_columns)
This example will display two overlapping series of columns. The green and red columns depict the current TR on each bar, and the light gray columns show the average over a defined number of periods, e.g., the default inputs on an hourly chart will show the average value at the hour over the past five days. This comparative analysis aids in determining whether the range of a bar aligns with its typical historical values or if it's an outlier.
█ NOTES
• The foundational concept of this library was derived from our initial Relative Volume at Time script. This library's logic significantly boosts its performance. Keep an eye out for a forthcoming updated version of the indicator. The demonstration code included in the library emulates a streamlined version of the indicator utilizing the library functions.
• Key efficiencies in the data management are realized through array.binary_search_leftmost() , which offers a performance improvement in comparison to its loop-dependent counterpart.
• This library's architecture utilizes user-defined types (UDTs) to create custom objects which are the equivalent of variables containing multiple parts, each able to hold independent values of different types . The recently added feature was announced in this blog post.
• To enhance readability, the code substitutes array functions with equivalent methods .
Look first. Then leap.
█ FUNCTIONS
This library contains the following functions:
calcCumulativeSeries(source, anchor)
Calculates the cumulative sum of `source` since the last bar where `anchor` was `true`.
Parameters:
source (series float) : Source used for the calculation.
anchor (series bool) : The condition that triggers the reset of the calculation. The calculation is reset when `anchor` evaluates to `true`, and continues using the values accumulated since the previous reset when `anchor` is `false`.
Returns: (float) The cumulative sum of `source`.
averageAtTime(source, length, anchor, isCumulative)
Calculates the average of all `source` values that share the same time difference from the `anchor` as the current bar for the most recent `length` bars.
Parameters:
source (series float) : Source used for the calculation.
length (simple int) : The number of reset periods to consider for the average calculation of historical data.
anchor (series bool) : The condition that triggers the reset of the average calculation. The calculation is reset when `anchor` evaluates to `true`, and continues using the values accumulated since the previous reset when `anchor` is `false`.
isCumulative (simple bool) : If `true`, `source` values are accumulated until the next time `anchor` is `true`. Optional. The default is `true`.
Returns: (float) The average of the source series at the specified time difference.

RS Rating (1-99)RS Rating
This indicator implements a Relative Strength (RS) rating for TradingView and is designed specifically to be used with the Pine Screener.
Concept
Relative Strength is calculated using weighted price performance over multiple time windows (approximately 3, 6, 9, and 12 months).
More recent performance is weighted more heavily, following well-established relative strength methodologies.
The resulting raw RS score is then compressed into a 1–99 scale, creating an intuitive and stable ranking metric.
Because TradingView scripts cannot rank a stock against the entire market universe, this indicator uses a behavioral proxy: the current RS score is mapped against its own historical distribution.
This produces RS values that behave similarly to widely used RS ratings, but it is not a true cross-sectional percentile rank.
IPO handling
RS Rating is not displayed until sufficient price history exists (default: ~9 months / 189 bars).
This avoids distorted RS values for newly listed stocks. IPOs are better evaluated using separate momentum, volume, or structure-based tools until they mature.
Interpretation (rule of thumb)
- RS ≥ 80 → strong relative performance
- RS ≥ 90 → leader
- RS ≥ 95 → very selective / top-tier
- RS Rating is best used as a ranking and confirmation tool, not as an entry signal.
Using RS Rating with TradingView Pine Screener
This indicator is designed to work directly with the TradingView Pine Screener (beta).
Setup
- Add the indicator to a chart
- Open Pine Screener
- Select this script as a filter source
- Use the plotted RS Rating (1–99) value for sorting or filtering
The screener reads the single plotted RS value and treats it as a sortable numeric column.
Typical screening workflows
Leader scan
Filter: RS Rating ≥ 90
Sort: Descending by RS Rating
Identifies stocks with sustained relative outperformance.
Broad strength scan
Filter: RS Rating ≥ 80
Useful for identifying emerging leaders or strong secondary names.
Top-of-universe view
No filter
Sort: Descending by RS Rating
Shows the strongest names within the selected universe.
Important notes on Pine Screener (beta)
The Pine Screener currently displays a limited number of results (approximately 100).
Symbols may be pre-sampled before filtering.
For larger universes, consider:
- splitting symbols to be scanned into multiple watchlists
Best practices
Use RS Rating to rank and prioritize candidates, not to time entries.
Combine RS with:
- price structure,
- volume behavior,
- overall market regime.
RS is most effective when used as part of a multi-factor screening process.

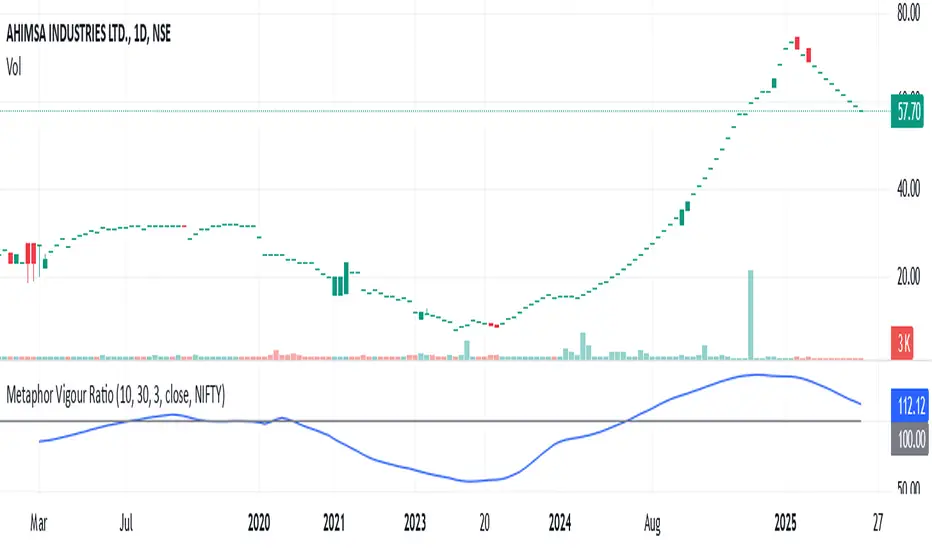
Metaphor Vigour Ratio### **Script Name:** Metaphor Vigour Ratio
**Short Title:** Metaphor Vigour Ratio
**Author:** Sovit Manjani, CMT
**Description:**
The Metaphor Vigour Ratio (MVRatio) is a powerful Relative Strength Indicator designed for assessing normalized relative strength. It is versatile and can be applied to any script or used to rank symbols based on their intermarket relative strength.
---
### **Features:**
1. **Bullish and Bearish Signals:**
- **Above 100:** Indicates a bullish trend.
- **Below 100:** Indicates a bearish trend.
2. **Trend Analysis with Slope:**
- **Slope Rising:** Suggests bullish momentum.
- **Slope Falling:** Suggests bearish momentum.
3. **Stock Selection Strategy:**
- Identify and rank stocks based on the MVRatio. For example, buy the top 10 stocks of Nifty with the highest MVRatio values for strong performance potential.
---
### **Inputs:**
1. **Fast EMA Period (RSEMAFast):** Default set to 10. Controls the sensitivity of the Fast Moving Average.
2. **Slow EMA Period (RSEMASlow):** Default set to 30. Provides a stable trend base with the Slow Moving Average.
3. **Smooth EMA Period (SmoothEMA):** Default set to 3. Smooths the MVRatio for better clarity.
4. **Close Source:** Default is the closing price, but it can be customized as needed.
5. **Comparative Symbol (ComparativeTickerId):** Default is "NSE:NIFTY," allowing comparison against a benchmark index.
---
### **Calculation Logic:**
1. **Relative Strength (RS):**
- Calculated as the ratio of the base symbol's price to the comparative symbol's price.
2. **Exponential Moving Averages (FastMA and SlowMA):**
- Applied to the RS to smooth and differentiate trends.
3. **Metaphor Vigour Ratio (MVRatio):**
- Computed as the ratio of FastMA to SlowMA, scaled by 100, and further smoothed using SmoothEMA.
---
### **Visualization:**
1. **MVRatio Plot (Blue):**
- Represents the relative strength dynamics.
2. **Reference Line at 100 (Gray):**
- Helps quickly identify bullish (above 100) and bearish (below 100) zones.
---
### **How to Use:**
1. Add the indicator to your chart from TradingView's Pine Script editor.
2. Compare the performance of any symbol relative to a benchmark (e.g., Nifty).
3. Analyze trends, slopes, and ranking based on MVRatio values to make informed trading decisions.
---
**Note:** This indicator is for educational purposes and should be used alongside other analysis methods to make trading decisions.
Realtime rVOL w/ Candle Highlight [Blk0ut]About This Script
Realtime rVOL Table + Candle Highlight (Presets, No Smoothing)
By Blk0ut
This tool visualizes real-time relative volume (rVOL) directly on your chart and in a compact table, helping traders identify where intraday participation deviates from the session’s baseline.
Unlike standard volume overlays, this script recalculates rVOL dynamically through the session and highlights candles when participation exceeds configurable thresholds — providing a clear picture of ignition zones, volume surges, and potential breakout conditions.
Core Features
-Realtime rVOL tracking: Displays the current bar’s relative volume ratio compared to a moving baseline of recent bars.
-Preset Profiles: Choose from four purpose-built profiles to quickly adjust the rVOL sensitivity to your trading horizon.
----------------------------------------------------------------------
*Opening Rush: 100-bar lookback, threshold 2.5*
*RTH 5m: 30-bar lookback, threshold 1.2*
*RTH 1hr: 50-bar lookback, threshold 1.5*
*RTH 1d+: 100-bar lookback, threshold 1.5*
----------------------------------------------------------------------
RTH-only filter: Option to limit the moving average baseline to regular market hours (09:30–16:00).
Candle highlighting: Optionally outlines candles when rVOL exceeds the active threshold to emphasize spikes visually in real time.
Table display: Compact dashboard showing current rVOL, raw volume, average baseline, and preset parameters.
How To Use
Select a preset that matches your timeframe or trading style.
Scalpers and open traders can use RTH 5m or Opening Rush.
Position or swing traders may prefer RTH 1hr or RTH 1d+.
Watch for rVOL readings above the threshold (and colored candle outlines). These often correspond to momentum ignition, news impact, or institutional activity.
Combine with VWAP, ORB, or intraday key levels for best confirmation.
Notes
The table automatically adapts to your chart corner choice.
Highlight thresholds can follow the preset or be set manually.
Color intensity tiers (High/Medium/Low) can be tuned in settings.
Designed for intraday and session-based traders who rely on live volume context rather than end-of-day stats.

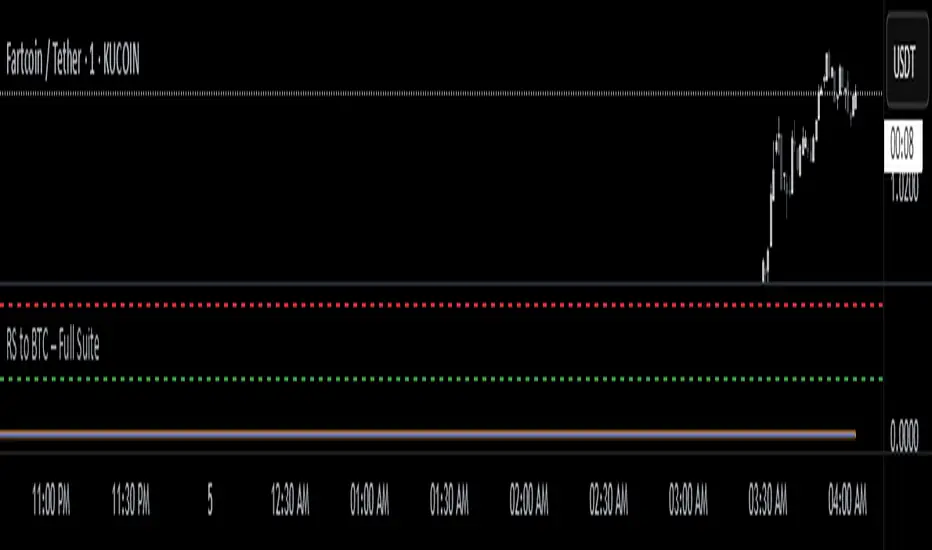
RS to BTC – EYASU V1RS to BTC – Full Suite
📝 Description:
This script tracks the relative strength of any coin against Bitcoin (RSBTC) in real-time. It is designed for altcoin traders who want to identify which coins are outperforming or underperforming BTC across multiple timeframes.
Features:
📈 RSBTC Line: Real-time plot of the altcoin’s price divided by BTC price
🟦 RSBTC Moving Average: Smooths the RS line to help identify trends
🔵 RSBTC RSI (Hidden by default): Highlights momentum of RS to detect overbought/oversold zones
🚨 Alerts: Set alerts for RSBTC crossing its moving average and RSI levels
Ideal for:
Spotting early altcoin breakouts
Timing entries/exits based on BTC-relative performance
Filtering for strong/weak coins before macro news
📱 Fully mobile compatible. Load it on any USDT chart — it auto-detects BTC and gives RS instantly.
Created by: @Eyasustock
License: Mozilla Public License 2.0
Fibonacci - RSI OscillatorIndicator Overview
The Fibonacci RSI Oscillator calculates the Relative Strength Index (RSI) based on a dynamically adjusting level derived from recent price action and a fixed Fibonacci ratio (0.236). This differs from standard RSI, which is calculated directly on the closing price. The objective is to measure momentum relative to a level that adapts to recent peaks and valleys.
Core Calculation Mechanism
Peak/Valley Tracking: The script identifies the highest high (state_peak) and lowest low (state_valley) since the last detected change in short-term directional bias (state_dir).
Dynamic Level Calculation: A level (state_dyn_level) is calculated using a fixed 0.236 Fibonacci ratio relative to the tracked peak and valley:
If bias is up: state_dyn_level = state_peak - (state_peak - state_valley) * 0.236
If bias is down: state_dyn_level = state_valley + (state_peak - state_valley) * 0.236
This level adjusts automatically when a new peak or valley is established in the current directional bias. If price crosses the dynamic level against the current bias, the bias flips, and the level recalculates.
Optional Source Smoothing: The calculated state_dyn_level can optionally be smoothed using a user-selected moving average (SMA, EMA, WMA, HMA, RMA) before the RSI calculation.
RSI Calculation: The standard RSI formula is applied to the (optionally smoothed) state_dyn_level series to produce the primary oscillator value (val_primary_osc).
Signal Line: A moving average (type and length configurable) is calculated on the val_primary_osc to generate the val_sig_line.
Key Features & Components
Dynamic Fibonacci Level: The core input for the RSI calculation, based on recent peaks/valleys and the 0.236 ratio.
Fibonacci Level RSI: The primary oscillator line representing the RSI of the dynamic level.
Signal Line: A moving average of the primary RSI line.
Overbought/Oversold Levels: User-defined threshold lines.
Optional Source Smoothing: Configurable MA smoothing applied to the dynamic level before RSI calculation.
Gradient RSI Color : Option to color the primary RSI line based on its value relative to OB/Mid/OS levels.
Zone & OB/OS Fills: Visual fills for the 0-50 / 50-100 zones and specific fills when the RSI enters OB/OS territory.
Background Gradient: Optional vertical background color gradient based on the RSI's position between 0 and 100.
Configurable Parameters: Inputs for lengths, MA types, OB/OS levels, colors, line widths, and feature toggles.
Visual Elements Explained
Fibonacci Level RSI Line: The main plotted oscillator (color/gradient/width configurable).
Signal Line: The moving average of the RSI line (color/width/MA type configurable).
OB/OS Lines: Horizontal lines plotted at the set OB/OS levels (color/width configurable).
Mid-Line (50): Horizontal line plotted at 50 (color/width configurable).
Zone Fills:
Background fill between 0-50 and 50-100 (colors configurable).
Conditional fill between the RSI line and the 50 line when RSI > OB level or RSI < OS level (colors configurable).
Background Gradient: Optional background coloring where transparency varies vertically with the RSI level (base colors and transparency range configurable).
Configuration Options
Users can adjust the following parameters in the indicator settings:
Smoothing: Enable/disable dynamic level smoothing; set length and MA type.
RSI: Set the RSI calculation length.
Signal Line: Set the signal line smoothing length and MA type.
Levels: Define Overbought and Oversold numeric thresholds.
Visuals: Configure colors and widths for the RSI line, signal line, OB/OS lines, mid-line, zone fills, and OB/OS fills.
Gradients: Enable/disable and configure colors for the RSI line gradient; enable/disable and configure colors/transparency for the background gradient.
Interpretation Notes
The oscillator reflects the momentum of the dynamic Fibonacci level, not directly the price. Divergences, OB/OS readings, and signal line crossovers should be interpreted in this context.
The behavior may differ from standard RSI, potentially offering a smoother output or highlighting different momentum patterns depending on market structure and volatility.
As with any indicator, signals should be used in conjunction with other analysis methods and risk management practices. It is not designed as a standalone trading system.
Risk Disclaimer:
Trading involves significant risk. This indicator is provided for analytical purposes only and does not constitute financial advice. Past performance is not indicative of future results. Use sound risk management practices and never trade with capital you cannot afford to lose.

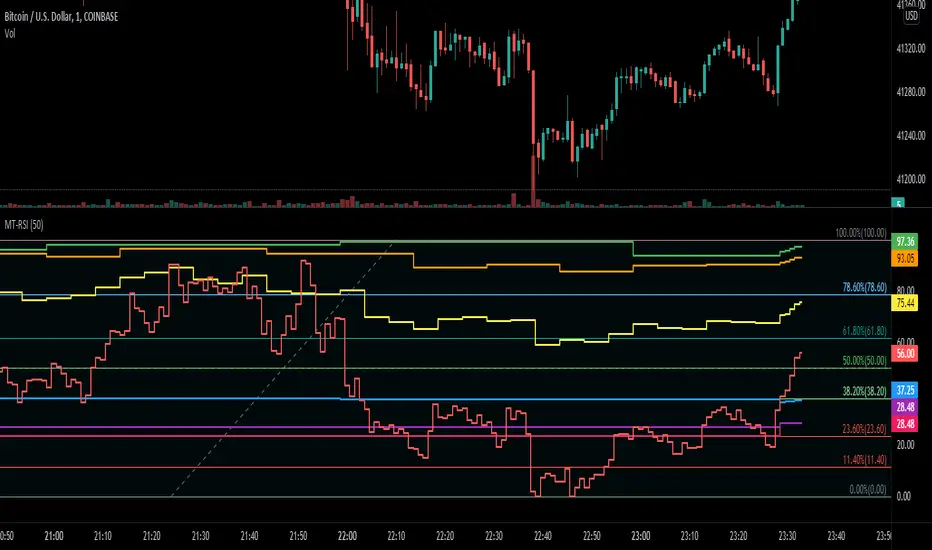
MT-RSIThis script shows a "Multi Timeframe RSI" for a range. You could use this script to quickly detect if the RSI of the higher and lower timeframes are overbought or oversold.
RSI is relative to a lower timeframe. So 1H is relative to the 4H and the 4H relative to the 1D chart etc...
In this example you can see that the 1H timeframe (green line) is performing well but is in overbought territory, but the 4H timeframe (blue line) dit not perform that great relative to the 1H timeframe.
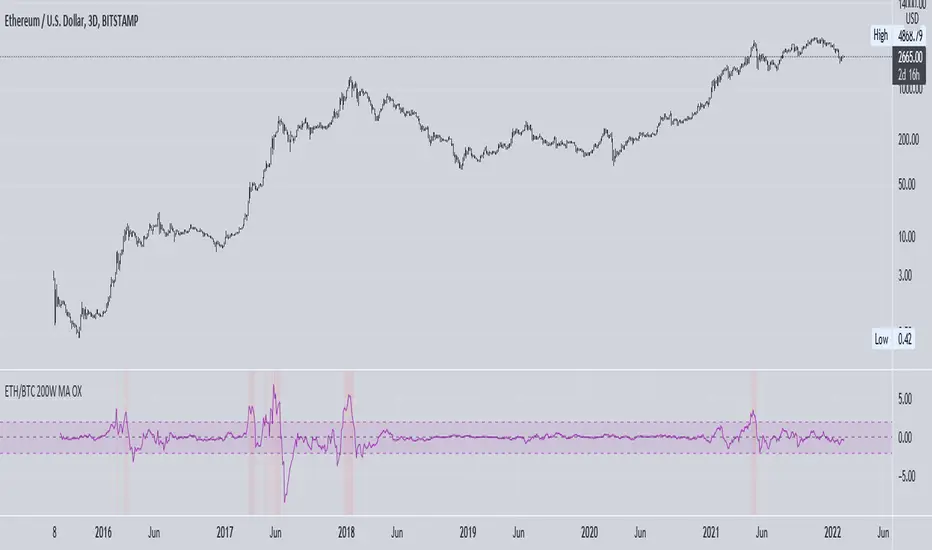
ETH vs BTC 200W SMA OverextensionHistorically, when BTC suffers a correction and ETH continues to rally, this hints at an impending market-wide correction. In Jan 2018, ETH rallies while BTC corrects, signalling the end of the bull cycle. In May 2021, ETH rallies while BTC ranges between $50-$60k, then a major correction occurs. This indicator attempts to monitor this phenomenon in order to help spot potential macro tops in the cryptocurrency market.
The indicator takes the price of the asset and divides it by the 200 week SMA value. This gives an over/undervaluation in percentage terms. When ETH becomes significantly more overvalued relative to BTC, the indicator will warn of a potential top forming (see red shaded areas).
This is for edutainment purposes only. Don't make financial decisions based on this indicator.
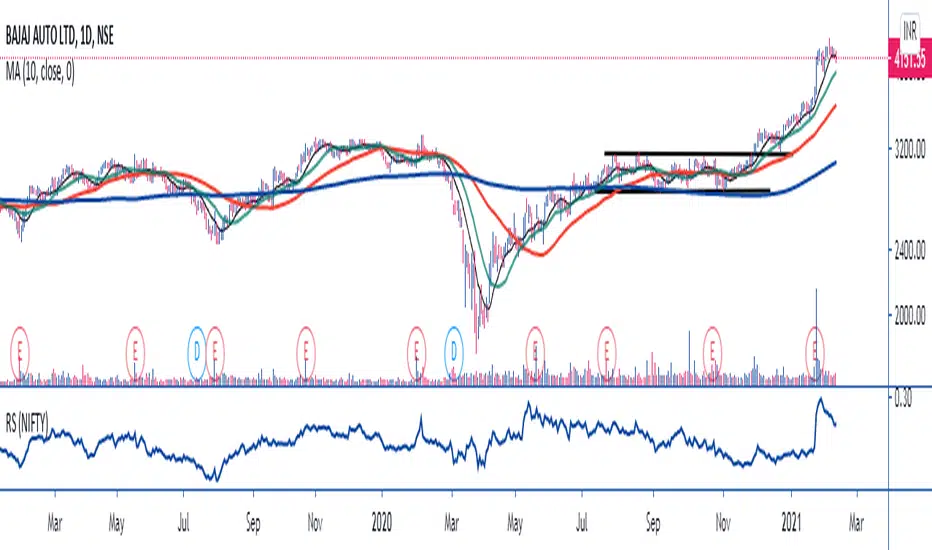
MAVERICKAMIT01-RELATIVE STRENGTHTHE SCRIPT SIMPLY DIVIDES THE STOCK PRICE BY NIFTY TO MEASURE UNDER PERFORMANCE AND OUT PERFORMANCE WITH NIFTY. YOU CAN CHANGE SETTINGS FROM NIFTY TO ANY OTHER SECTOR LIKE CNX FMCG TO MEASURE SECTOR PERFORMANCE AND UNDER PERFORMANCE !!!

RSI+ Crypto Smart Strategy by Ignotus ### **RSI+ Crypto Smart Strategy by Ignotus**
**Description:**
The **RSI+ Crypto Smart Strategy by Ignotus** is an advanced and visually enhanced version of the classic **Relative Strength Index (RSI)**, developed by the **Crypto Smart** community. This indicator is designed to provide traders with a clear and actionable view of market momentum, overbought/oversold conditions, and potential reversal points. With its sleek design, customizable settings, and intuitive visual signals, this tool is perfect for traders who want to align their strategies with the principles of the **Crypto Smart** methodology.
Whether you're a beginner or an experienced trader, this indicator simplifies technical analysis while offering powerful insights into market behavior. It combines traditional RSI calculations with advanced visual enhancements and natural language interpretations, making it easier than ever to interpret market conditions at a glance.
---
### **Key Features:**
1. **Enhanced RSI Visualization:**
- The RSI line dynamically changes color based on its position relative to the 50-level midpoint:
- **Green** for bullish momentum (RSI > 50).
- **Red** for bearish momentum (RSI < 50).
- Overbought (default: 70) and oversold (default: 30) levels are clearly marked with customizable colors and shaded clouds for better visibility.
2. **Customizable Settings:**
- Adjust the RSI period, overbought/oversold thresholds, and background transparency to match your trading style.
- Fine-tune pivot lookback ranges and other parameters to adapt the indicator to different timeframes and assets.
3. **Interactive Information Table:**
- A compact, easy-to-read table provides real-time data on the current RSI value, its direction (▲, ▼, →), and a natural language interpretation of market conditions.
- Choose from three text sizes (small, medium, large) to optimize readability.
4. **Natural Language Interpretations:**
- The indicator includes a detailed explanation of the RSI's current state in plain English:
- Momentum trends (bullish, bearish, or neutral).
- Overbought/oversold warnings with potential reversal alerts.
- Clear guidance on whether the market is trending or ranging.
5. **Visual Buy/Sell Signals:**
- Triangles (▲ for buy, ▼ for sell) highlight potential entry and exit points based on RSI crossovers and divergence patterns.
- Configurable alerts notify you in real-time when key signals are triggered.
6. **Improved Aesthetics:**
- Clean, modern design with customizable colors for lines, clouds, and backgrounds.
- Dynamic shading and transparency options enhance chart clarity without cluttering the workspace.
---
### **How to Use This Indicator:**
- **Overbought/Oversold Zones:** Use the RSI's overbought (above 70) and oversold (below 30) zones to identify potential reversal points. Look for confirmation from price action or other indicators before entering trades.
- **Momentum Analysis:** Monitor the RSI's position relative to the 50-level midpoint to gauge bullish or bearish momentum.
- **Trend Identification:** Combine the RSI's readings with price trends to confirm the strength and direction of the market.
- **Entry/Exit Signals:** Use the visual signals (triangles) to spot potential entry and exit points. These signals are particularly useful for swing traders and scalpers.
---
### **Why Choose RSI+ Crypto Smart Strategy?**
This indicator is more than just an RSI—it's a complete tool designed to streamline your trading process. By focusing on clarity, customization, and actionable insights, the **RSI+ Crypto Smart Strategy** empowers traders to make informed decisions quickly and confidently. Whether you're trading cryptocurrencies, stocks, or forex, this indicator adapts seamlessly to your needs.
---
### **Developed by Crypto Smart:**
The **RSI+ Crypto Smart Strategy by Ignotus** is part of the **Crypto Smart** ecosystem, a community-driven initiative aimed at providing innovative tools and strategies for traders worldwide. Our mission is to simplify technical analysis while maintaining the depth and precision required for successful trading.
If you find this indicator helpful, please leave a review and share it with fellow traders! Your feedback helps us continue developing cutting-edge tools for the trading community.
---
### **Disclaimer:**
This indicator is a technical analysis tool and should not be considered financial advice. Trading involves risk, and past performance is not indicative of future results. Always conduct your own research and consult with a financial advisor before making trading decisions. Use of this indicator is at your own risk.

RSI with Dynamic ColorsThe "RSI with Dynamic Colors" is a custom indicator built on top of the traditional Relative Strength Index (RSI), which helps traders identify overbought or oversold market conditions. This enhanced version includes added functionality like dynamic colors, highlighting specific conditions, and more customization options. Here's a breakdown of how this indicator works:
Indicator Components:
Relative Strength Index (RSI) Calculation:
The RSI is a momentum oscillator that measures the speed and change of price movements. It oscillates between 0 and 100, helping traders determine if an asset is overbought or oversold.
In this version, the RSI is calculated with a configurable lookback period (default is 14) and applies smoothing to both upward and downward price changes using the Relative Moving Average (RMA).
Dynamic Coloring:
The indicator dynamically changes the color of the RSI line based on its value. Specific thresholds include:
Blue: When the RSI is at or above an extreme overbought level (≥ 85).
Red: When the RSI is in the overbought zone (≥ 70 but < 85).
Yellow: When the RSI is at or below the extreme oversold level (≤ 15).
Green: When the RSI is in the oversold zone (≤ 30 but > 15).
White: When the RSI is between the oversold and overbought zones.
Moving Average Options (MA):
The indicator allows the user to plot an optional moving average of the RSI for additional trend confirmation. Users can select from various types of moving averages, including Simple Moving Average (SMA), Exponential Moving Average (EMA), and others.
Bollinger Bands can be optionally applied around the RSI to visualize volatility.
Overbought and Oversold Highlights:
It provides visual highlights (green for overbought and red for oversold) in the background of the RSI plot, making it easier to identify potential reversal zones.
Divergence Detection (Optional):
The indicator can optionally display regular bullish or bearish divergence, which can signal potential trend reversals. Divergence occurs when price moves in the opposite direction of the RSI.
Bullish divergence is indicated when the price makes lower lows while the RSI makes higher lows.
Bearish divergence is shown when the price makes higher highs while the RSI makes lower highs.
Alerts:
Users can set up alerts for bullish or bearish divergence, making it easier to get notified when key conditions occur in the market.
Use Case:
This custom RSI indicator is designed for traders who want to combine the classic RSI functionality with enhanced visual aids, such as color coding for different RSI zones, customizable moving averages, and Bollinger Bands. It is particularly useful for identifying potential market tops and bottoms by highlighting overbought/oversold conditions and divergence signals.
In summary, this indicator not only retains the traditional RSI's power but also adds new layers of insight through color, moving averages, and divergence detection, helping traders make better-informed decisions.

Chebyshev-Gauss RSIThe Chebyshev-Gauss RSI is a variant of the standard Relative Strength Index (RSI) that uses the Chebyshev-Gauss Moving Average (CG-MA) for smoothing gains and losses instead of a traditional Simple or Exponential Moving Average. This results in a more responsive and potentially smoother RSI line.
This version is enhanced with features from the built-in TradingView RSI indicator, including:
A selectable smoothing moving average of the RSI line.
Bollinger Bands based on the smoothing MA.
Automatic divergence detection.
How it works:
It calculates the upward and downward price changes (gains and losses).
It applies the Chebyshev-Gauss Moving Average to smooth these gains and losses over a specified lookback period.
The smoothed values are used to calculate the Relative Strength (RS) and then the final RSI value.

Adaptive Volume-Weighted RSI (AVW-RSI)Concept Summary
The AVW-RSI is a modified version of the Relative Strength Index (RSI), where each price change is weighted by the relative trading volume for that period. This means periods of high volume (typically driven by institutions or “big money”) have a greater influence on the RSI calculation than periods of low volume.
Why AVW-RSI Helps Traders
Avoids Weak Signals During Low Volume
Standard RSI may show overbought/oversold zones even during low-volume periods (e.g., during lunch hours or after news).
AVW-RSI gives less weight to these periods, avoiding misleading signals.
Amplifies Strong Momentum Moves
If RSI is rising during high volume, it's more likely driven by institutional buying—AVW-RSI reflects that stronger by weighting the RSI component.
Filters Out Retail Noise
By prioritizing high-volume candles, it naturally discounts fakeouts caused by thin markets or retail-heavy moves.
Highlights Institutional Entry/Exit
Useful for spotting hidden accumulation/distribution that classic RSI would miss.
How It Works (Calculation Logic)
Traditional RSI Formula Recap
RSI = 100 - (100 / (1 + RS))
RS = Average Gain / Average Loss (over N periods)
Modified Step – Apply Volume Weight
For each period
Gain_t = max(Close_t - Close_{t-1}, 0)
Loss_t = max(Close_{t-1} - Close_t, 0)
Weight_t = Volume_t / AvgVolume(N)
WeightedGain_t = Gain_t * Weight_t
WeightedLoss_t = Loss_t * Weight_t
Weighted RSI
AvgWeightedGain = SMA(WeightedGain, N)
AvgWeightedLoss = SMA(WeightedLoss, N)
RS = AvgWeightedGain / AvgWeightedLoss
AVW-RSI = 100 - (100 / (1 + RS))
Visual Features on Chart
Line Color Gradient
Color gets darker as volume weight increases, signaling stronger conviction.
Overbought/Oversold Zones
Traditional: 70/30
Suggested AVW-RSI zones: Use dynamic thresholds based on historical volatility (e.g., 80/20 for high-volume coins).
Volume Spike Flags
Mark RSI turning points that occurred during volume spikes with a special dot/symbol.
Trading Strategies with AVW-RSI
1. Weighted RSI Divergence
Regular RSI divergence becomes more powerful when volume is high.
AVW-RSI divergence with volume spike is a strong signal of reversal.
2. Trend Confirmation
RSI crossing above 50 during rising volume is a good entry signal.
RSI crossing below 50 with high volume is a strong exit or short trigger.
3. Breakout Validation
Price breaking resistance + AVW-RSI > 60 with volume = Confirmed breakout.
Price breaking but AVW-RSI < 50 or on low volume = Potential fakeout.
Example Use Case
Stock XYZ is approaching a resistance zone. A trader sees:
Standard RSI: 65 → suggests strength.
Volume is 3x the average.
AVW-RSI: 78 → signals strong momentum with institutional backing.
The trader enters confidently, knowing this isn't just low-volume hype.
Limitations / Tips
Works best on liquid assets (Forex majors, large-cap stocks, BTC/ETH).
Should be used alongside price action and volume analysis—not standalone.
Periods of extremely high volume (news events) might need smoothing to avoid spikes.
