RSI Horizontal resistance levelsRSI Horizontal Resistance Levels
Purpose
This study automatically draws horizontal price rays every time the Relative Strength Index (RSI) trades inside a user‑defined band (default = 50 ± 1). The idea is to spotlight price levels that historically coincided with a specific RSI state—levels that often evolve into short‑term support or resistance as sentiment repeats.
How it works
Raw RSI – The script computes an un‑smoothed RSI of the closing price (rsiLength, default = 3).
Trigger zone – Whenever RSI falls within level ± tolerance (e.g., 49 – 51) the close price of that bar becomes a reference.
Horizontal ray – A ray (extend.right) is drawn from that close and continues indefinitely to the right, creating a live price level.
History management – Only the most recent N rays are kept (maxRays, default = 5); the oldest line is deleted automatically to avoid chart clutter.
Inputs
Name Default Description
RSI Length 3 Look‑back of the RSI calculation.
RSI Level 50 Center of the trigger zone. Common alternatives: 30, 70, custom mid‑lines.
Tolerance 1 Width of the RSI band on each side of RSI Level (set 0 for an exact hit).
Max Rays 5 Maximum number of active horizontal levels kept on screen.
Ray Color Yellow Visual color of the rays.
Ray Width 2 Thickness of the rays.
How to use it
Spot recurring reaction zones – Markets often hesitate near prices where momentum has flipped before. The rays reveal those spots automatically.
Combine with candlestick or volume cues – A level marked by this script plus a rejection wick, volume spike, or divergence can strengthen conviction.
Adapt the band –
50 ± tolerance → momentum balance line (trend pullbacks)
70 ± tolerance → overbought fade levels
30 ± tolerance → oversold bounce levels
Works on any asset or timeframe; shorter RSI periods highlight intraday rotations, longer periods capture swing pivots.
Tips & cautions
A drawn line is not a guarantee of future reversal—always validate with price action and risk management.
For high‑frequency strategies, consider lowering tolerance or increasing rsiLength to reduce noise.
You can add custom alerts on RSI crossing the band to receive push or email notifications.
Happy trading!
"Relative Strength Index (RSI) " için komut dosyalarını ara

RSI Divergence Strategy - AliferCryptoStrategy Overview
The RSI Divergence Strategy is designed to identify potential reversals by detecting regular bullish and bearish divergences between price action and the Relative Strength Index (RSI). It automatically enters positions when a divergence is confirmed and manages risk with configurable stop-loss and take-profit levels.
Key Features
Automatic Divergence Detection: Scans for RSI pivot lows/highs vs. price pivots using user-defined lookback windows and bar ranges.
Dual SL/TP Methods:
- Swing-based: Stops placed a configurable percentage beyond the most recent swing high/low.
- ATR-based: Stops placed at a multiple of Average True Range, with a separate risk/reward multiplier.
Long and Short Entries: Buys on bullish divergences; sells short on bearish divergences.
Fully Customizable: Input groups for RSI, divergence, swing, ATR, and general SL/TP settings.
Visual Plotting: Marks divergences on chart and plots stop-loss (red) and take-profit (green) lines for active trades.
Alerts: Built-in alert conditions for both bullish and bearish RSI divergences.
Detailed Logic
RSI Calculation: Computes RSI of chosen source over a specified period.
Pivot Detection:
- Identifies RSI pivot lows/highs by scanning a lookback window to the left and right.
- Uses ta.barssince to ensure pivots are separated by a minimum/maximum number of bars.
Divergence Confirmation:
- Bullish: Price makes a lower low while RSI makes a higher low.
- Bearish: Price makes a higher high while RSI makes a lower high.
Entry:
- Opens a Long position when bullish divergence is true.
- Opens a Short position when bearish divergence is true.
Stop-Loss & Take-Profit:
- Swing Method: Computes the recent swing high/low then adjusts by a percentage margin.
- ATR Method: Uses the current ATR × multiplier applied to the entry price.
- Take-Profit: Calculated as entry price ± (risk × R/R ratio).
Exit Orders: Uses strategy.exit to place bracket orders (stop + limit) for both long and short positions.
Inputs and Configuration
RSI Settings: Length & price source for the RSI.
Divergence Settings: Pivot lookback parameters and valid bar ranges.
SL/TP Settings: Choice between Swing or ATR method.
Swing Settings: Swing lookback length, margin (%), and risk/reward ratio.
ATR Settings: ATR length, stop multiplier, and risk/reward ratio.
Usage Notes
Adjust the Pivot Lookback and Range values to suit the volatility and timeframe of your market.
Use higher ATR multipliers for wider stops in choppy conditions, or tighten swing margins in trending markets.
Backtest different R/R ratios to find the balance between win rate and reward.
Disclaimer
This script is for educational purposes only and does not constitute financial advice. Trading carries significant risk and you may lose more than your initial investment. Always conduct your own research and consider consulting a professional before making any trading decisions.

ICT Swiftedge# ICT SwiftEdge: Advanced Market Structure Trading System
**Overview**
ICT SwiftEdge is a powerful trading system built upon the foundation of ICTProTools' ICT Breakers, licensed under the Mozilla Public License 2.0 (mozilla.org). This script has been significantly enhanced by to combine market structure analysis with modern technical indicators and a sleek, AI-inspired statistics dashboard. The goal is to provide traders with a comprehensive tool for identifying high-probability trade setups, managing exits, and tracking performance in a visually intuitive way.
**Credits**
This script is a derivative work based on the original "ICT Breakers" by ICTProTools, used with permission under the Mozilla Public License 2.0. Significant enhancements, including RSI-MA signals, trend filtering, dynamic timeframe adjustments, dual exit strategies, and an AI-style statistics dashboard, were developed by . We express our gratitude to ICTProTools for their foundational work in market structure analysis.
**What It Does**
ICT SwiftEdge integrates multiple trading concepts to help traders identify and manage trades based on market structure and momentum:
- **Market Structure Analysis**: Identifies Break of Structure (BOS) and Market Structure Shift (MSS) patterns, which signal potential trend continuations or reversals. BOS indicates a continuation of the current trend, while MSS highlights a shift in market direction, providing key entry points.
- **RSI-MA Signals**: Generates "BUY" and "SELL" signals when BOS or MSS patterns align with the Relative Strength Index (RSI) smoothed by a Moving Average (RSI-MA). Signals are filtered to occur only when RSI-MA is above 50 (for buys) or below 50 (for sells), ensuring momentum supports the trade direction.
- **Trend Filtering**: Prevents multiple signals in the same trend, ensuring only one buy or sell signal per trend direction, reducing noise and improving trade clarity.
- **Dynamic Timeframe Adjustment**: Automatically adjusts pivot points, RSI, and MA parameters based on the selected chart timeframe (1M to 1D), optimizing performance across different market conditions.
- **Flexible Exit Strategies**: Offers two user-selectable exit methods:
- **Trailing Stop-Loss (TSL)**: Exits trades when price moves against the position by a user-defined distance (in points), locking in profits or limiting losses.
- **RSI-MA Exit**: Exits trades when RSI-MA crosses the 50 level, signaling a potential loss of momentum.
- Users can enable either or both strategies, providing flexibility to adapt to different trading styles.
- **AI-Style Statistics Dashboard**: Displays real-time trade performance metrics in a futuristic, neon-colored interface, including total trades, wins, losses, win/loss ratio, and win percentage. This helps traders evaluate the system's effectiveness without external tools.
**Why This Combination?**
The integration of these components creates a synergistic trading system:
- **BOS/MSS and RSI-MA**: Combining market structure breaks with RSI-MA ensures entries are based on both price action (structure) and momentum (RSI-MA), increasing the likelihood of high-probability trades.
- **Trend Filtering**: By limiting signals to one per trend, the system avoids overtrading and focuses on significant market moves.
- **Dynamic Adjustments**: Timeframe-specific parameters make the system versatile, suitable for scalping (1M, 5M) or swing trading (4H, 1D).
- **Dual Exit Strategies**: TSL protects profits during trending markets, while RSI-MA exits are ideal for range-bound or reversing markets, catering to diverse market conditions.
- **Statistics Dashboard**: Provides immediate feedback on trade performance, enabling data-driven decision-making without manual tracking.
This combination balances technical precision with user-friendly visuals, making it accessible to both novice and experienced traders.
**How to Use**
1. **Add to Chart**: Apply the script to any TradingView chart.
2. **Configure Settings**:
- **Chart Timeframe**: Select your chart's timeframe (1M to 1D) to optimize parameters.
- **Structure Timeframe**: Choose a timeframe for market structure analysis (leave blank for chart timeframe).
- **Exit Strategy**: Enable Trailing Stop-Loss (`useTslExit`), RSI-MA Exit (`useRsiMaExit`), or both. Adjust `tslPoints` for TSL distance.
- **Show Signals/Labels**: Toggle `showSignals` and `showExit` to display "BUY", "SELL", and "EXIT" labels.
- **Dashboard**: Enable `showDashboard` to view trade statistics. Customize colors with `dashboardBgColor` and `dashboardTextColor`.
3. **Trading**:
- Look for "BUY" or "SELL" labels to enter trades when BOS/MSS aligns with RSI-MA.
- Exit trades at "EXIT" labels based on your chosen strategy.
- Monitor the statistics dashboard to track performance (total trades, win/loss ratio, win percentage).
4. **Alerts**: Set up alerts for BOS, MSS, buy, sell, or exit signals using the provided alert conditions.
**License**
This script is licensed under the Mozilla Public License 2.0 (mozilla.org). The source code is available for review and modification under the terms of this license.
**Compliance with TradingView House Rules**
This publication adheres to TradingView's House Rules and Scripts Publication Rules. It provides a clear, self-contained description of the script's functionality, credits the original author (ICTProTools), and explains the rationale for combining indicators. The script contains no promotional content, offensive language, or proprietary restrictions beyond MPL 2.0.
**Note**
Trading involves risk, and past performance is not indicative of future results. Always backtest and validate the system on your preferred markets and timeframes before live trading.
Enjoy trading with ICT SwiftEdge, and let data-driven insights guide your decisions!

RSI Oversold ScannerPine Script Description for TradingView Publication
Title: RSI Oversold Scanner (1m, 5m, 15m)
Description:
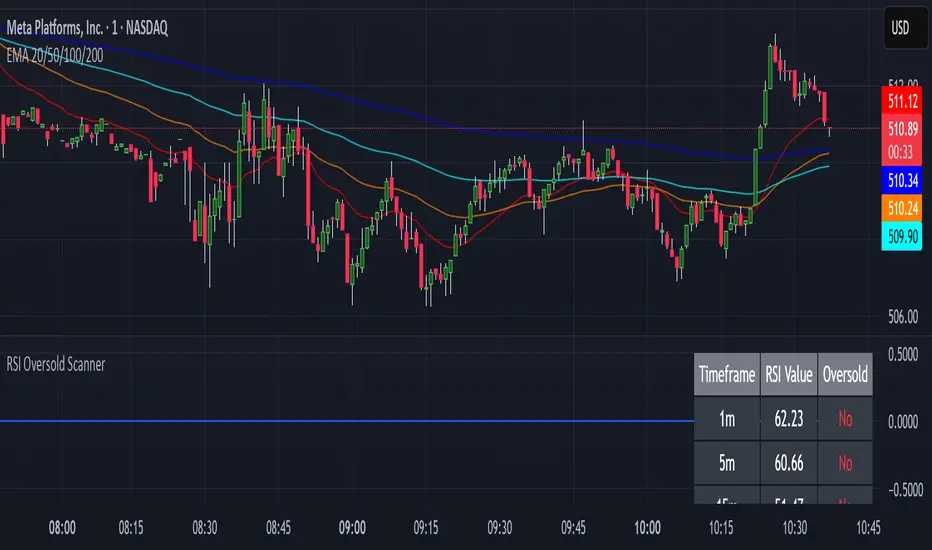
The RSI Oversold Scanner is a powerful tool designed to identify stocks that are simultaneously oversold on the 1-minute, 5-minute, and 15-minute timeframes, based on the Relative Strength Index (RSI). This script is ideal for traders seeking short-term reversal or momentum opportunities across multiple intraday timeframes.
Key Features:
Multi-Timeframe RSI Analysis: Calculates RSI (default length: 14) on the 1m, 5m, and 15m timeframes and checks if all are below the oversold threshold (default: 30).
Visual Output: Displays a table in the top-right corner showing RSI values and oversold status ("Yes" or "No") for each timeframe, making it easy to verify conditions.
Scan Result: Plots a value of 1 when all three timeframes are oversold, or 0 otherwise, enabling quick identification of matching stocks.
Alert Support: Includes an alert condition that triggers when a stock is oversold on all timeframes, with a customizable message for real-time notifications.
User-Friendly: Built with Pine Script v6 for compatibility and reliability, with clear visual feedback for traders of all levels.
How It Works:
The script uses ta.rsi to compute RSI on the current chart’s timeframe (1m) and request.security to fetch RSI data for the 5m and 15m timeframes.
It checks if RSI is below the oversold level (default: 30) on all three timeframes.
A table displays the RSI values and oversold status for easy debugging.
The Scan Result plot (1 or 0) indicates whether the stock meets the oversold criteria, which can be used for manual scanning or alerts.
Usage Instructions:
Add the script to your chart via Pine Editor.
Use a watchlist to switch between stocks and check the table or Scan Result for oversold conditions.
Set alerts by selecting the script’s Scan Result condition (value = 1) to get notified when a stock is oversold on all timeframes.
Customize the RSI length or oversold level in the script’s code if needed (e.g., change rsiLength or oversoldLevel).
Notes:
Best used on intraday charts (e.g., 1m or higher) with a watchlist for manual scanning, as TradingView’s Stock Screener does not directly support custom Pine Scripts.
Real-time alerts and intraday data may require a TradingView paid plan.
The script uses only two request.security calls, staying well within Pine Script’s limits.
Ideal For:
Day traders and swing traders looking for oversold stocks across multiple intraday timeframes.
Users who want to combine technical analysis with visual and alert-based confirmation.
MTF RSI & SMA Crossover [OB/OS Filtered Signals]MTF RSI & SMA Crossover
This custom indicator combines the power of Multi-Timeframe (MTF) RSI, Simple Moving Average (SMA), and overbought/oversold (OB/OS) conditions to provide precise buy and sell signals based on the crossovers of the RSI and its SMA. The indicator includes the following features:
MTF RSI: The Relative Strength Index (RSI) is calculated on a customizable timeframe, giving traders the ability to analyze price momentum across different timeframes.
SMA of RSI: The RSI is smoothed using a Simple Moving Average (SMA), helping to filter out market noise and identify clearer trend reversals.
Overbought/Oversold Filter: Signals are only triggered when the RSI has been in an overbought (above 70) or oversold (below 30) condition, improving the reliability of potential trend reversals.
Buy/Sell Signals:
Buy signals occur when the RSI crosses above its SMA after being oversold, indicating potential upward momentum.
Sell signals occur when the RSI crosses below its SMA after being overbought, indicating potential downward momentum.
Customizable Label Colors: Choose your own colors for the "BUY" and "SELL" labels to match your chart's design and preferences.
Alerts: Set alerts for buy and sell signals, ensuring you don't miss a potential trade.
This indicator is ideal for traders who want to capture trend reversals and momentum shifts while filtering out false signals by using overbought and oversold conditions. Customize the settings to suit your trading style and strategy.

Rendon1 Swing Market Turns**Swing Market Turns Indicator**
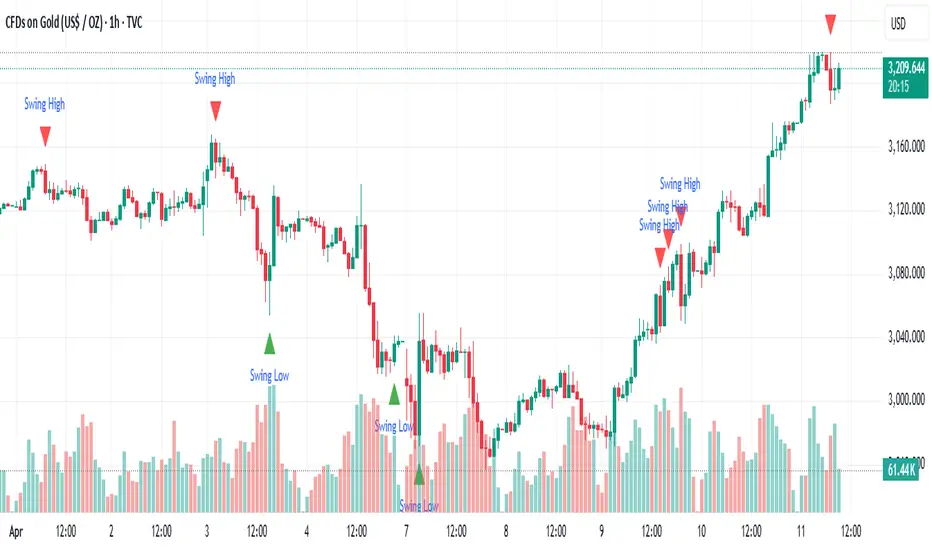
This indicator identifies potential swing highs and swing lows by integrating Relative Strength Index (RSI), volume confirmation, and higher timeframe (HTF) levels to accurately detect market reversals and turning points. Specifically optimized for swing traders, this tool aims to pinpoint moments when price momentum is shifting, providing clear signals for trade entries and exits.
### How It Works:
- **RSI Divergence:** Detects momentum shifts through RSI overbought and oversold conditions.
- **Higher Timeframe Levels:** Confirms reversals using support and resistance levels from higher timeframes.
- **Volume Confirmation:** Ensures stronger validity of signals by checking if current volume exceeds the moving average of recent volume.
### Key Features:
- Visual labels on chart clearly indicating potential swing highs and lows.
- Customizable RSI period, RSI overbought/oversold thresholds, volume moving average length, and higher timeframe selections.
- Built-in alert conditions for immediate notifications when swing opportunities are detected.
### Recommended Use:
- Ideal for traders focusing on swing trading strategies, particularly those looking for high-probability turning points.
- Effective across multiple assets including forex, stocks, commodities, and crypto.
- Suitable for various intraday and higher timeframes, with customization options available.
### Settings:
- **RSI Period:** Adjust the sensitivity of RSI calculation.
- **Higher Timeframe:** Select the timeframe used for support/resistance reference.
- **RSI Overbought/Oversold:** Customize thresholds defining extreme RSI values.
- **Volume MA Length:** Specify the length for volume moving average calculation.
Feel free to customize the parameters to best fit your trading style and asset of choice.
**Disclaimer:**
This indicator does not guarantee profitable trades and should be used in conjunction with proper risk management and additional analysis methods.
Smooth Gradient RSIThe RSI READY NO1 is a custom-designed Relative Strength Index (RSI) indicator that visually enhances the classic RSI functionality with modern aesthetics and user-friendly features. Its purpose is to provide smooth and clear insights into price momentum and potential reversal zones.
**Key Features**:
- **Smooth Gradient Line**: The RSI line dynamically changes color from green (low RSI values) to red (high RSI values) through a gradient transition. This visually intuitive representation highlights changes in momentum and overbought/oversold conditions.
- **Customizable Background**: Users can select their preferred background color to enhance visual clarity and suit their personal preferences or chart themes.
- **Precise Levels Marking**: The Overbought Level (default: 70) and Oversold Level (default: 30) are marked with white dashed lines of thickness 2, ensuring clear visibility of critical zones.
**Visual Enhancements**:
- The gradient feature makes the RSI more visually appealing, helping traders quickly identify shifts in market momentum.
- Clean design ensures focus remains on the RSI line, with minimal distractions.
**Usability**:
- Designed for easy integration into charts with parameters customizable directly from the interface.
- Compatible with TradingView platform, leveraging Pine Script Version 5.
This indicator is ideal for traders who prioritize visual clarity and customization, providing enhanced insights into market trends and dynamics.

ReadyFor401ks Stoch + RSIThis indicator is a powerful tool that combines the classic Relative Strength Index (RSI) with a Stochastic RSI to provide traders with a more nuanced view of market momentum and potential reversal points. By blending these two techniques, the script offers a detailed insight into price action, highlighting when a market might be overbought or oversold. The RSI is calculated once and then used both for a traditional RSI plot and to derive the Stochastic RSI, ensuring consistency and efficiency in your analysis.
One of the standout features of this indicator is its dynamic visual presentation. A gradient color scheme is applied to the RSI line, which changes based on its position between customizable overbought and oversold levels. This visual cue allows traders to quickly identify critical zones without having to constantly monitor numerical values. Additionally, the background fill between these levels enhances clarity, making it easier to spot when conditions are ripe for a potential reversal.
The indicator is highly customizable, allowing you to adjust parameters such as the RSI period, Stochastic length, and smoothing factors. This flexibility means you can fine-tune the tool to suit different market conditions, whether you’re trading trending markets or range-bound environments. For example, an RSI crossover above the oversold level can signal an emerging upward trend, while a crossover below the overbought level may indicate a downturn, providing actionable alerts that can be integrated into your trading strategy.
Overall, the ReadyFor401k Stoch + RSI indicator is designed to offer a clear, concise, and visually engaging method for monitoring market momentum. It serves as an excellent complement to other technical analysis tools and can help improve your decision-making process by providing early warning signals for potential market reversals. Whether you’re a seasoned trader or just starting out, this indicator can be a valuable addition to your TradingView toolkit.

RSI Alerts – Live & ConfirmedThe RSI Alerts – Live & Confirmed indicator enhances the traditional Relative Strength Index (RSI) by providing real-time alerts and confirmed breakout signals when RSI reaches key levels. It also features a dynamic RSI line color change for better visualization.
Key Features:
✅ Live & Confirmed Alerts:
Live Alert Mode: Triggers when RSI touches overbought (70) or oversold (30).
Confirmed Alert Mode: Triggers only when RSI closes above/below these levels, reducing false signals.
✅ Dynamic RSI Line Coloring:
Above 70: RSI turns green, indicating an overbought condition.
Below 30: RSI turns red, indicating an oversold condition.
Between 30 and 70: RSI remains blue, its normal color, ensuring no color leaks into invalid zones.
✅ Customizable RSI Settings:
Adjustable RSI length, overbought/oversold levels, and alert preferences.
Mid-Level (50) line for trend bias reference.
This indicator is perfect for traders who rely on RSI signals and want clear visual cues and real-time alerts for improved decision-making.

MACD+RSI Indicator Moving Average Convergence/Divergence or MACD is a momentum indicator that shows the relationship between two Exponential Moving Averages (EMAs) of a stock price. Convergence happens when two moving averages move toward one another, while divergence occurs when the moving averages move away from each other. This indicator also helps traders to know whether the stock is being extensively bought or sold. Its ability to identify and assess short-term price movements makes this indicator quite useful.
The Moving Average Convergence/Divergence indicator was invented by Gerald Appel in 1979.
Moving Average Convergence/Divergence is calculated using a 12-day EMA and 26-day EMA. It is important to note that both the EMAs are based on closing prices. The convergence and divergence (CD) values have to be calculated first. The CD value is calculated by subtracting the 26-day EMA from the 12-day EMA.
---------------------------------------------------------------------------------------------------------------------
The relative strength index (RSI) is a momentum indicator used in technical analysis. RSI measures the speed and magnitude of a security's recent price changes to detect overbought or oversold conditions in the price of that security.
The RSI is displayed as an oscillator (a line graph) on a scale of zero to 100. The indicator was developed by J. Welles Wilder Jr. and introduced in his seminal 1978 book, New Concepts in Technical Trading Systems.
In addition to identifying overbought and oversold securities, the RSI can also indicate securities that may be primed for a trend reversal or a corrective pullback in price. It can signal when to buy and sell. Traditionally, an RSI reading of 70 or above indicates an overbought condition. A reading of 30 or below indicates an oversold condition.
---------------------------------------------------------------------------------------------------------------------
By combining them, you can create a MACD/RSI strategy. You can go ahead and search for MACD/RSI strategy on any social platform. It is so powerful that it is the most used indicator in TradingView. It is best for trending market. Our indicator literally let you customize MACD/RSI settings. Explore our indicator by applying to your chart and start trading now!

Waldo Momentum Cloud Bollinger Bands (WMCBB)
Title: Waldo Momentum Cloud Bollinger Bands (WMCBB)
Description:
Introducing the "Waldo Momentum Cloud Bollinger Bands (WMCBB)," an innovative trading tool crafted for those who aim to deepen their market analysis by merging two dynamic technical indicators: Dynamic RSI Bollinger Bands and the Waldo Cloud.
What is this Indicator?
WMCBB integrates the volatility-based traditional Bollinger Bands with a momentum-sensitive approach through the Relative Strength Index (RSI). Here’s how it works:
Dynamic RSI Bollinger Bands: These bands dynamically adjust according to the RSI, which tracks the momentum of price movements. By scaling the RSI to align with price levels, we generate bands that not only reflect market volatility but also the underlying momentum, offering a refined view of overbought and oversold conditions.
Waldo Cloud: This feature adds a layer of traditional Bollinger Bands, visualized as a 'cloud' on your chart. It employs standard Bollinger Band methodology but enhances it with additional moving average layers to better define market trends.
The cloud's color changes dynamically based on various market conditions, providing visual signals for trend direction and potential trend reversals.
Why Combine These Indicators?
Combining Dynamic RSI Bollinger Bands with the Waldo Cloud in WMCBB aims to:
Enhance Trend Identification: The Waldo Cloud's color-coded system aids in recognizing the overarching market trend, while the Dynamic RSI Bands give insights into momentum changes within that trend, offering a comprehensive view.
Improve Volatility and Momentum Analysis: While traditional Bollinger Bands measure market volatility, integrating RSI adds a layer of momentum analysis, potentially leading to more accurate trading signals.
Visual Clarity: The unified color scheme for both sets of bands, which changes according to RSI levels, moving average crossovers, and price positioning, simplifies the process of gauging market sentiment at a glance.
Customization: Users have the option to toggle the visibility of moving averages (MA) through the settings, allowing for tailored analysis based on individual trading strategies.
Usage:
Utilize WMCBB to identify potential trend shifts by observing price interactions with the dynamic bands or changes in the Waldo Cloud's color.
Watch for divergences between price movements and RSI to forecast potential market reversals or continuations.
This combination shines in sideways markets where traditional indicators might fall short, as it provides additional context through RSI momentum analysis.
Settings:
Customize parameters for both the Dynamic RSI and Waldo Cloud Bollinger Bands, including the calculation source, standard deviation factors, and moving average lengths.
WMCBB is perfect for traders seeking to enhance their market analysis through the synergy of momentum and volatility, all while maintaining visual simplicity. Trade with greater insight using the Waldo Momentum Cloud Bollinger Bands!

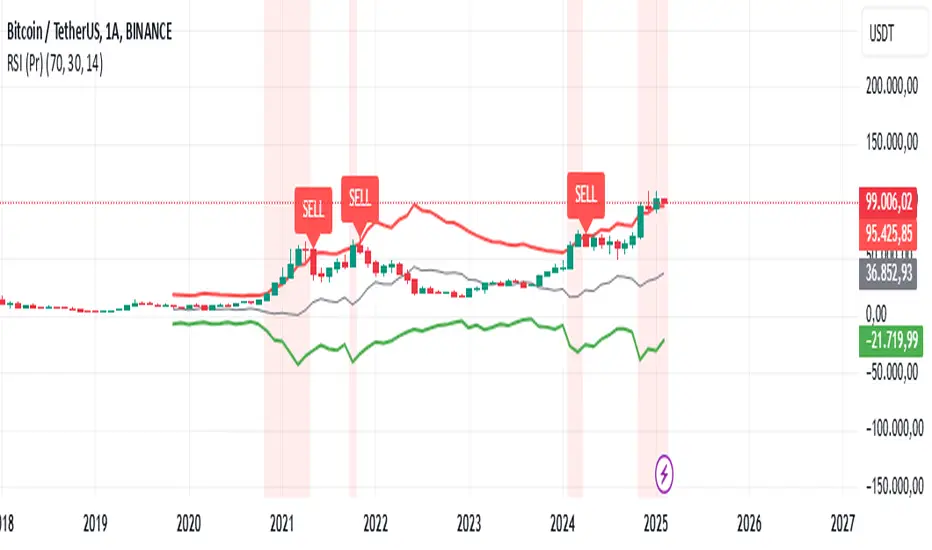
RSI (Pr)The "RSI (Pr)" indicator enhances the traditional Relative Strength Index (RSI) by incorporating dynamic bands and highlighting extreme market conditions directly on the price chart. This approach offers traders a more intuitive visualization of potential overbought and oversold zones, facilitating timely decision-making.
Key Features:
Dynamic RSI Bands: The indicator calculates upper and lower bands based on user-defined overbought and oversold levels. These bands adjust in real-time, providing a responsive measure of market extremes.
Visual Alerts: Background colors change when the price moves outside the RSI bands, offering immediate visual cues of potential market reversals.
Buy/Sell Signals: The script places "BUY" and "SELL" labels on the chart when the price crosses above or below the RSI bands, assisting traders in identifying potential entry and exit points.
How It Works:
RSI Calculation: The script computes the RSI based on the closing price and a user-defined length (default is 14 periods).
Exponential Moving Averages (EMA): It calculates the EMA of the maximum gains and losses to smooth out the data, enhancing the reliability of the RSI bands.
Upper and Lower Bands: Using the smoothed data, the script determines the upper (resistance) and lower (support) bands, which represent dynamic overbought and oversold levels.
Visual Indicators: The script plots the upper and lower bands, as well as a midline, directly on the price chart. Background colors change when the price exceeds these bands, and "BUY" or "SELL" labels appear at crossover points.
Usage:
Overbought Conditions: When the price crosses above the upper band, it may indicate an overbought condition, suggesting a potential selling opportunity.
Oversold Conditions: When the price crosses below the lower band, it may indicate an oversold condition, suggesting a potential buying opportunity.
Customization:
Users can adjust the following parameters to suit their trading preferences:
RSI Overbought Level: Default is 70.
RSI Oversold Level: Default is 30.
RSI Length: Default is 14 periods.
Disclaimer:
This indicator is designed for educational purposes and should not be construed as financial advice. Trading involves significant risk, and it's essential to conduct thorough research and consider your financial situation before making trading decisions. Past performance is not indicative of future results.
By integrating dynamic RSI bands and clear visual signals directly onto the price chart, this indicator aims to provide traders with actionable insights into market conditions, enhancing the traditional RSI analysis.
Power Trend [MacAlgo]Description:
The Power Trend Indicator is a sophisticated technical analysis tool that overlays on your trading charts to identify prevailing market trends. It utilizes a combination of ATR-based trend calculations, moving averages, volume analysis, and momentum indicators to generate reliable buy and sell signals. Additionally, it offers customizable settings to adapt to various trading styles and timeframes.
Key Features:
Adaptive ATR Calculation: Automatically adjusts the ATR (Average True Range) period and multiplier based on the selected timeframe for more accurate trend detection.
Dynamic Trend Lines: Plots continuous trend lines with color-coded bars to visually represent bullish and bearish trends.
Buy/Sell Signals: Generates standard and power buy/sell signals to help you make informed trading decisions.
Volume Analysis: Incorporates average buy and sell volumes to identify strong market movements.
Multiple Timeframe Support: Automatically adjusts the indicator's timeframe or allows for manual selection to suit your trading preferences.
Highlighting: Highlights trending bars for easy visualization of market conditions.
Alerts: Customizable alert conditions to notify you of potential trading opportunities in real-time.
How it Works:
1. ATR-Based Trend Calculation:
ATR Period & Multiplier: Calculates ATR based on user-defined periods and multipliers, dynamically adjusting according to the chart's timeframe.
Trend Determination: Identifies trends as bullish (1) or bearish (-1) based on price movements relative to ATR-based upper (up) and lower (dn) trend lines.
2. Moving Averages:
EMA & SMA: Calculates exponential and simple moving averages to smooth price data and identify underlying trends.
AlphaTrend Line: Combines a 50-period EMA and a 30-period SMA on a 4-hour timeframe to create the AlphaTrend line, providing a robust trend reference.
3. Volume Analysis:
Buy/Sell Volume: Differentiates between buy and sell volumes to gauge market strength.
Average Volume: Compares current volume against average buy/sell volumes to detect significant market movements.
4. Momentum Indicators:
RSI, MACD, OBV: Incorporates Relative Strength Index (RSI), Moving Average Convergence Divergence (MACD), and On-Balance Volume (OBV) to assess momentum and confirm trend strength.
5. Signal Generation:
Standard Signals: Basic buy and sell signals based on trend crossovers.
Power Signals: Enhanced signals requiring multiple conditions (e.g., increased volume, momentum confirmation) for higher confidence trades.
Customization Options:
Tailor the Power Trend Indicator to your specific trading needs with the following settings:
ATR Period: Set the period for ATR calculation (default: 8).
ATR Multiplier: Adjust the ATR multiplier to fine-tune trend sensitivity (default: 3.0).
Source: Choose the price source (e.g., HL2, Close) for calculations.
Change ATR Calculation Method: Toggle between different ATR calculation methods.
Show Buy/Sell Signals: Enable or disable the display of buy and sell signals on the chart.
Highlighting: Turn on or off the bar highlighting feature.
Timeframe Adjustment: Choose between automatic timeframe adjustment or manually set
the indicator's timeframe.
Manual Indicator Timeframe: If manual adjustment is selected, specify the desired timeframe (default: 60 minutes).
Visual Components:
Trend Lines: Continuous lines representing the current trend, color-coded for easy identification (green for bullish, red for bearish, orange for neutral).
Bar Coloring: Bars are colored based on the current trend and its relationship to the AlphaTrend line.
Buy/Sell Triangles: Triangular markers appear on the chart to indicate buy and sell signals.
Power Signals: Larger triangles highlight strong buy and sell opportunities based on multiple confirming factors.
Highlighting: Transparent overlays highlight trending areas to enhance visual clarity.
Alerts:
Stay informed with customizable alerts that notify you of important market movements:
SuperTrend Buy/Sell: Alerts when standard buy or sell signals are generated.
Power Buy/Sell Alerts: Notifications for strong buy or sell signals based on comprehensive conditions.
Trend Direction Change: Alerts when the trend changes from bullish to bearish or vice versa.
How to Use:
Add to Chart: Apply the Power Trend Indicator to your preferred trading chart on TradingView.
Configure Settings: Adjust the input parameters to match your trading style and the timeframe you are analyzing.
Analyze Trends: Observe the trend lines, bar colors, and AlphaTrend line to understand the current market trend.
Follow Signals: Look for buy and sell signals or power signals to identify potential entry and exit points.
Set Alerts: Enable alerts to receive real-time notifications of significant trading opportunities.
Adjust as Needed: Fine-tune the settings based on market conditions and your trading experience.
Important Notes:
Backtesting: While the Power Trend Indicator is built using robust technical analysis principles, it's essential to backtest and validate its performance within your trading strategy.
Market Conditions: The indicator performs best in trending markets. In sideways or highly volatile markets, signal reliability may vary.
Risk Management: Always employ proper risk management techniques when trading based on indicator signals to protect your capital.
Disclaimer:
This indicator is intended for educational purposes only and does not provide financial advice or guarantee future performance. Trading involves risk, and past results are not indicative of future outcomes. Always conduct your own analysis and risk management.

RSI & DPO support/resistanceThis indicator combines the Relative Strength Index (RSI) to identify overbought and oversold conditions with the Detrended Price Oscillator (DPO) to highlight support and resistance levels.
Unlike traditional indicators that display these metrics in a separate window, this tool integrates them directly onto the main price chart.
This allows for a more cohesive analysis, enabling traders to easily visualize the relationship between price movements and momentum indicators in one unified view.
How to Use It:
Identify Overbought and Oversold Conditions:
Look for RSI values above 70 to identify overbought conditions, suggesting a potential price reversal or pullback. Conversely, RSI values below 30 indicate oversold conditions, which may signal a potential price bounce or upward movement.
Analyze Support and Resistance Levels:
Observe the DPO lines on the main chart to identify key support and resistance levels. When the price approaches these levels, it can provide insights into potential price reversals or breakouts.
Combine Signals for Trading Decisions:
Use the RSI and DPO signals together to make informed trading decisions. For example, if the RSI indicates an overbought condition while the price is near a resistance level identified by the DPO, it may be a good opportunity to consider selling or taking profits.
Monitor Divergences:
Watch for divergences between the RSI and price movements. If the price is making new highs while the RSI is not, it could indicate weakening momentum and a potential reversal.
Set Alerts:
Consider setting alerts for when the RSI crosses above or below the overbought or oversold thresholds, or when the price approaches significant support or resistance levels indicated by the DPO.
Practice Risk Management:
Always use proper risk management techniques, such as setting stop-loss orders and position sizing, to protect your capital while trading based on these indicators.
By following these steps, traders can effectively utilize this indicator to enhance their market analysis and improve their trading strategies.

RSI OB/OS Strategy Analyzer█ OVERVIEW
The RSI OB/OS Strategy Analyzer is a comprehensive trading tool designed to help traders identify and evaluate overbought/oversold reversal opportunities using the Relative Strength Index (RSI). It provides visual signals, performance metrics, and a detailed table to analyze the effectiveness of RSI-based strategies over a user-defined lookback period.
█ KEY FEATURES
RSI Calculation
Calculates RSI with customizable period (default 14)
Plots dynamic overbought (70) and oversold (30) levels
Adds background coloring for OB/OS regions
Reversal Signals
Identifies signals based on RSI crossing OB/OS levels
Two entry strategies available:
Revert Cross: Triggers when RSI exits OB/OS zone
Cross Threshold: Triggers when RSI enters OB/OS zone
Trade Direction
Users can select a trade bias:
Long: Focuses on oversold reversals (bullish signals)
Short: Focuses on overbought reversals (bearish signals)
Performance Metrics
Calculates three key statistics for each lookback period:
Win Rate: Percentage of profitable trades
Mean Return: Average return across all trades
Median Return: Median return across all trades
Metrics calculated as percentage changes from entry price
Visual Signals
Dual-layer signal display:
BUY: Green triangles + text labels below price
SELL: Red triangles + text labels above price
Semi-transparent background highlighting in OB/OS zones
Performance Table
Interactive table showing metrics for each lookback period
Color-coded visualization:
Win Rate: Gradient from red (low) to green (high)
Returns: Green for positive, red for negative
Time Filtering
Users can define a specific time window for the indicator to analyze trades, ensuring that performance metrics are calculated only for the desired period.
Customizable Display
Adjustable table font sizes: Auto/Small/Normal/Large
Toggle option for table visibility
█ PURPOSE
The RSI OB/OS Strategy Analyzer helps traders:
Identify mean-reversion opportunities through RSI extremes
Backtest entry strategy effectiveness across multiple time horizons
Optimize trade timing through visual historical performance data
Quickly assess strategy robustness with color-coded metrics
█ IDEAL USERS
Counter-Trend Traders: Looking to capitalize on RSI extremes
Systematic Traders: Needing quantitative strategy validation
Educational Users: Studying RSI behavior in different market conditions
Multi-Timeframe Analysts: Interested in forward returns analysis

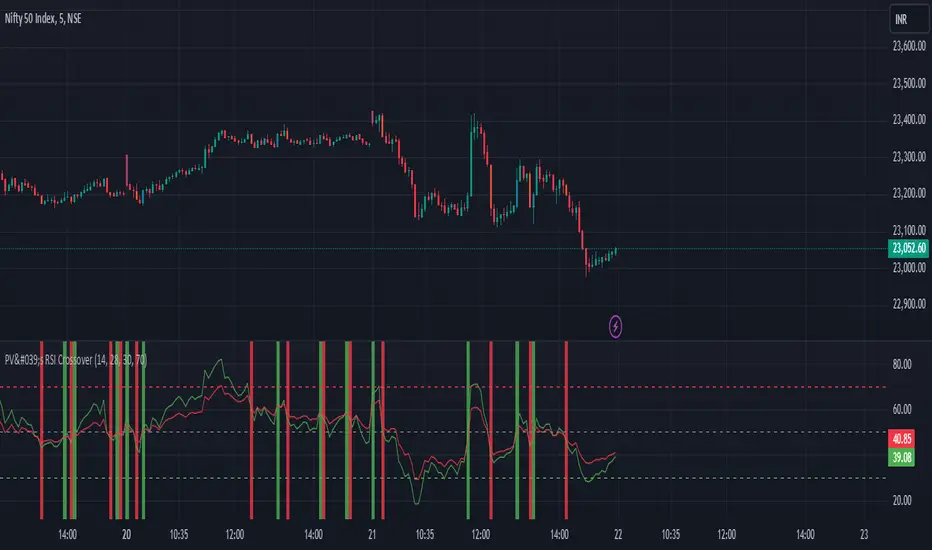
PV's Dual RSI Crossover StrategyIntroduction to the Dual RSI Two-Cross Indicator
The Relative Strength Index (RSI) is a widely used technical indicator in finance that measures the magnitude of recent price changes to determine overbought or oversold conditions. The RSI Two-Cross indicator takes this concept a step further by introducing a unique twist: it plots two RSI lines with different lengths and generates alerts based on their crossovers.
Key Features:
Dual RSI Lines: The indicator plots two RSI lines with user-defined lengths, allowing traders to compare the short-term and long-term momentum of an asset.
Crossover Alerts: The indicator generates alerts when the shorter RSI line crosses above or below the longer RSI line, indicating potential trend reversals or continuations.
Customizable Parameters: Users can adjust the lengths of the RSI lines, oversold and overbought levels, and other parameters to suit their trading strategy and asset of choice.
Visual Aids: The indicator features colored bars and backgrounds to highlight crossover events, making it easy to identify trading opportunities at a glance.
Trading Applications:
Trend Reversal Detection: The RSI Two-Cross indicator can help traders identify potential trend reversals by monitoring crossovers between the two RSI lines.
Momentum Confirmation: The indicator can be used to confirm momentum shifts in an asset's price, helping traders to filter out false signals and make more informed trading decisions.
Scalping and Day Trading: The indicator's short-term focus makes it suitable for scalping and day trading strategies, where traders aim to capitalize on small price movements.
By combining the versatility of the RSI with the power of crossover analysis, the RSI Two-Cross indicator offers a unique perspective on market momentum and trend dynamics. Whether you're a seasoned trader or just starting out, this indicator can help you navigate the markets with greater confidence and precision.
Advanced Options Trading Indicator: Buy & Sell Signal Generator This powerful custom indicator combines the Relative Strength Index (RSI) and Moving Average (MA) to help traders identify optimal entry and exit points in the options market. The indicator generates real-time buy and sell signals based on RSI crossovers and price positioning relative to the moving average, providing actionable insights for traders seeking to make informed decisions. Additionally, it calculates potential call and put option strike prices with a buffer for added flexibility and precision, ensuring a well-rounded approach to options trading.

Big Candle Identifier with RSI Divergence and Advanced Stops1. Strategy Objective
The main goal of this strategy is to:
Identify significant price momentum (big candles).
Enter trades at opportune moments based on market signals (candlestick patterns and RSI divergence).
Limit initial risk through a fixed stop loss.
Maximize profits by using a trailing stop that activates only after the trade moves a specified distance in the profitable direction.
2. Components of the Strategy
A. Big Candle Identification
The strategy identifies big candles as indicators of strong momentum.
A big candle is defined as:
The body (absolute difference between close and open) of the current candle (body0) is larger than the bodies of the last five candles.
The candle is:
Bullish Big Candle: If close > open.
Bearish Big Candle: If open > close.
Purpose: Big candles signal potential continuation or reversal of trends, serving as the primary entry trigger.
B. RSI Divergence
Relative Strength Index (RSI): A momentum oscillator used to detect overbought/oversold conditions and divergence.
Fast RSI: A 5-period RSI, which is more sensitive to short-term price movements.
Slow RSI: A 14-period RSI, which smoothens fluctuations over a longer timeframe.
Divergence: The difference between the fast and slow RSIs.
Positive divergence (divergence > 0): Bullish momentum.
Negative divergence (divergence < 0): Bearish momentum.
Visualization: The divergence is plotted on the chart, helping traders confirm momentum shifts.
C. Stop Loss
Initial Stop Loss:
When entering a trade, an immediate stop loss of 200 points is applied.
This stop loss ensures the maximum risk is capped at a predefined level.
Implementation:
Long Trades: Stop loss is set below the entry price at low - 200 points.
Short Trades: Stop loss is set above the entry price at high + 200 points.
Purpose:
Prevents significant losses if the price moves against the trade immediately after entry.
D. Trailing Stop
The trailing stop is a dynamic risk management tool that adjusts with price movements to lock in profits. Here’s how it works:
Activation Condition:
The trailing stop only starts trailing when the trade moves 200 ticks (profit) in the right direction:
Long Position: close - entry_price >= 200 ticks.
Short Position: entry_price - close >= 200 ticks.
Trailing Logic:
Once activated, the trailing stop:
For Long Positions: Trails behind the price by 150 ticks (trail_stop = close - 150 ticks).
For Short Positions: Trails above the price by 150 ticks (trail_stop = close + 150 ticks).
Exit Condition:
The trade exits automatically if the price touches the trailing stop level.
Purpose:
Ensures profits are locked in as the trade progresses while still allowing room for price fluctuations.
E. Trade Entry Logic
Long Entry:
Triggered when a bullish big candle is identified.
Stop loss is set at low - 200 points.
Short Entry:
Triggered when a bearish big candle is identified.
Stop loss is set at high + 200 points.
F. Trade Exit Logic
Trailing Stop: Automatically exits the trade if the price touches the trailing stop level.
Fixed Stop Loss: Exits the trade if the price hits the predefined stop loss level.
G. 21 EMA
The strategy includes a 21-period Exponential Moving Average (EMA), which acts as a trend filter.
EMA helps visualize the overall market direction:
Price above EMA: Indicates an uptrend.
Price below EMA: Indicates a downtrend.
H. Visualization
Big Candle Identification:
The open and close prices of big candles are plotted for easy reference.
Trailing Stop:
Plotted on the chart to visualize its progression during the trade.
Green Line: Indicates the trailing stop for long positions.
Red Line: Indicates the trailing stop for short positions.
RSI Divergence:
Positive divergence is shown in green.
Negative divergence is shown in red.
3. Key Parameters
trail_start_ticks: The number of ticks required before the trailing stop activates (default: 200 ticks).
trail_distance_ticks: The distance between the trailing stop and price once the trailing stop starts (default: 150 ticks).
initial_stop_loss_points: The fixed stop loss in points applied at entry (default: 200 points).
tick_size: Automatically calculates the minimum tick size for the trading instrument.
4. Workflow of the Strategy
Step 1: Entry Signal
The strategy identifies a big candle (bullish or bearish).
If conditions are met, a trade is entered with a fixed stop loss.
Step 2: Initial Risk Management
The trade starts with an initial stop loss of 200 points.
Step 3: Trailing Stop Activation
If the trade moves 200 ticks in the profitable direction:
The trailing stop is activated and follows the price at a distance of 150 ticks.
Step 4: Exit the Trade
The trade is exited if:
The price hits the trailing stop.
The price hits the initial stop loss.
5. Advantages of the Strategy
Risk Management:
The fixed stop loss ensures that losses are capped.
The trailing stop locks in profits after the trade becomes profitable.
Momentum-Based Entries:
The strategy uses big candles as entry triggers, which often indicate strong price momentum.
Divergence Confirmation:
RSI divergence helps validate momentum and avoid false signals.
Dynamic Profit Protection:
The trailing stop adjusts dynamically, allowing the trade to capture larger moves while protecting gains.
6. Ideal Market Conditions
This strategy performs best in:
Trending Markets:
Big candles and momentum signals are more effective in capturing directional moves.
High Volatility:
Larger price swings improve the probability of reaching the trailing stop activation level (200 ticks).

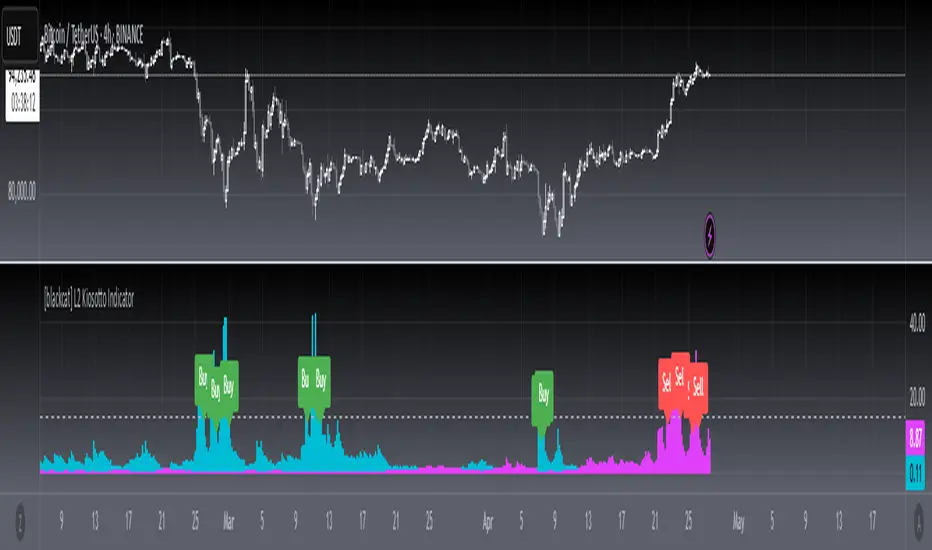
[blackcat] L2 Kiosotto IndicatorOVERVIEW
The Kiosotto Indicator is a versatile technical analysis tool designed for forex trading but applicable to other financial markets. It excels in detecting market reversals and trends without repainting, ensuring consistent and reliable signals. The indicator has evolved over time, with different versions focusing on specific aspects of market analysis.
KEY FEATURES
Reversal Detection: Identifies potential market reversals, crucial for traders looking to capitalize on turning points.
Trend Detection: Earlier versions focused on detecting trends, useful for traders who prefer to follow the market direction.
Non-Repainting: Signals remain consistent on the chart, providing reliable and consistent signals.
Normalization: Later versions, such as Normalized Kiosotto and Kiosotto_2025, incorporate normalization to assess oversold and overbought conditions, enhancing interpretability.
VERSIONS AND EVOLUTION
Early Versions: Focused on trend detection, useful for following market direction.
2 in 1 Kiosotto: Emphasizes reversal detection and is considered an improvement by users.
Normalized Versions (e.g., Kiosotto_2025, Kiosotto_3_2025): Introduce normalization to assess oversold and overbought conditions, enhancing interpretability.
HOW TO USE THE KIOSOTTO INDICATOR
Understanding Signals:
Reversals: Look for the indicator's signals that suggest a potential reversal, indicated by color changes, line crossings, or other visual cues.
Trends: Earlier versions might show stronger trending signals, indicated by the direction or slope of the indicator's lines.
Normalization Interpretation (for normalized versions):
Oversold: When the indicator hits the lower boundary, it might indicate an oversold condition, suggesting a potential buy signal.
Overbought: Hitting the upper boundary could signal an overbought condition, suggesting a potential sell signal.
PINE SCRIPT IMPLEMENTATION
The provided Pine Script code is a version of the Kiosotto indicator. Here's a detailed explanation of the code:
//@version=5
indicator(" L2 Kiosotto Indicator", overlay=false)
//Pine version of Kiosotto 2015 v4 Alert ms-nrp
// Input parameters
dev_period = input.int(150, "Dev Period")
alerts_level = input.float(15, "Alerts Level")
tsbul = 0.0
tsber = 0.0
hpres = 0.0
lpres = 9999999.0
for i = 0 to dev_period - 1
rsi = ta.rsi(close , dev_period)
if high > hpres
hpres := high
tsbul := tsbul + rsi * close
if low < lpres
lpres := low
tsber := tsber + rsi * close
buffer1 = tsber != 0 ? tsbul / tsber : 0
buffer2 = tsbul != 0 ? tsber / tsbul : 0
// Plotting
plot(buffer1, color=color.aqua, linewidth=3, style=plot.style_histogram)
plot(buffer2, color=color.fuchsia, linewidth=3, style=plot.style_histogram)
hline(alerts_level, color=color.silver)
EXPLANATION OF THE CODE
Indicator Definition:
indicator(" L2 Kiosotto Indicator", overlay=false): Defines the indicator with the name " L2 Kiosotto Indicator" and specifies that it should not be overlaid on the price chart.
Input Parameters:
dev_period = input.int(150, "Dev Period"): Allows users to set the period for the deviation calculation.
alerts_level = input.float(15, "Alerts Level"): Allows users to set the level for alerts.
Initialization:
tsbul = 0.0: Initializes the tsbul variable to 0.0.
tsber = 0.0: Initializes the tsber variable to 0.0.
hpres = 0.0: Initializes the hpres variable to 0.0.
lpres = 9999999.0: Initializes the lpres variable to a very high value.
Loop for Calculation:
The for loop iterates over the last dev_period bars.
rsi = ta.rsi(close , dev_period): Calculates the RSI for the current bar.
if high > hpres: If the high price of the current bar is greater than hpres, update hpres and add the product of RSI and close price to tsbul.
if low < lpres: If the low price of the current bar is less than lpres, update lpres and add the product of RSI and close price to tsber.
Buffer Calculation:
buffer1 = tsber != 0 ? tsbul / tsber : 0: Calculates the first buffer as the ratio of tsbul to tsber if tsber is not zero.
buffer2 = tsbul != 0 ? tsber / tsbul : 0: Calculates the second buffer as the ratio of tsber to tsbul if tsbul is not zero.
Plotting:
plot(buffer1, color=color.aqua, linewidth=3, style=plot.style_histogram): Plots the first buffer as a histogram with an aqua color.
plot(buffer2, color=color.fuchsia, linewidth=3, style=plot.style_histogram): Plots the second buffer as a histogram with a fuchsia color.
hline(alerts_level, color=color.silver): Draws a horizontal line at the alerts_level with a silver color.
FUNCTIONALITY
The Kiosotto indicator calculates two buffers based on the RSI and price levels over a specified period. The buffers are plotted as histograms, and a horizontal line is drawn at the alerts level. The indicator helps traders identify potential reversals and trends by analyzing the relationship between the RSI and price levels.
ALGORITHMS
RSI Calculation:
The Relative Strength Index (RSI) measures the speed and change of price movements. It is calculated using the formula:
RSI=100− (1+RS) / 100
where RS is the ratio of the average gain to the average loss over the specified period.
Buffer Calculation:
The buffers are calculated as the ratio of the sum of RSI multiplied by the close price for high and low price conditions. This helps in identifying the balance between buying and selling pressure.
Signal Generation:
The indicator generates signals based on the values of the buffers and the alerts level. Traders can use these signals to make informed trading decisions, such as entering or exiting trades based on potential reversals or trends.
APPLICATION SCENARIOS
Reversal Trading: Traders can use the Kiosotto indicator to identify potential reversals by looking for significant changes in the buffer values or crossings of the alerts level.
Trend Following: The indicator can also be used to follow trends by analyzing the direction and slope of the buffer lines.
Oversold/Overbought Conditions: For normalized versions, traders can use the indicator to identify oversold and overbought conditions, which can provide buy or sell signals.
THANKS
Special thanks to the TradingView community and the original developers for their contributions and support in creating and refining the Kiosotto Indicator.
rsi wf breakoutRSI Breakout Asif
RSI Breakout Asif Indicator
Overview:
The RSI Breakout Asif indicator is a custom script designed to analyze and highlight potential
breakout points using the Relative Strength Index (RSI) combined with Williams Fractals. This
indicator is specifically developed for traders who want to identify key momentum shifts in the
market.
Features:
1. RSI Analysis:
- The RSI is calculated using a user-defined length and price source.
- Horizontal lines are plotted at levels 70 (overbought), 50 (neutral), and 30 (oversold) to visually
aid decision-making.
2. Williams Fractals on RSI:
- Detects fractal highs and lows based on RSI values.
- Highlights these fractal points with dynamic, symmetrical lines for better visibility.
3. Customization:
- Users can adjust the RSI length and price source for personalized analysis.
- Fractal settings (left and right bar length) are also adjustable, making the indicator versatile for
different trading styles.
4. Visual Enhancements:
- Fractal highs are marked in red, while fractal lows are marked in green.
Asif - Page 1
RSI Breakout Asif
- Precise line placement ensures clarity and reduces chart clutter.
5. Practical Utility:
- Use the fractal breakout signals in conjunction with other technical indicators for enhanced
decision-making.
Usage:
- Add the RSI Breakout Asif indicator to your TradingView chart.
- Adjust the settings according to your trading strategy.
- Observe the RSI values and fractal points to identify potential breakout zones.
Disclaimer:
This indicator is a technical analysis tool and should be used in combination with other analysis
methods. It does not guarantee profitable trades.
Watermarked by Asif.
Asif - Page 2

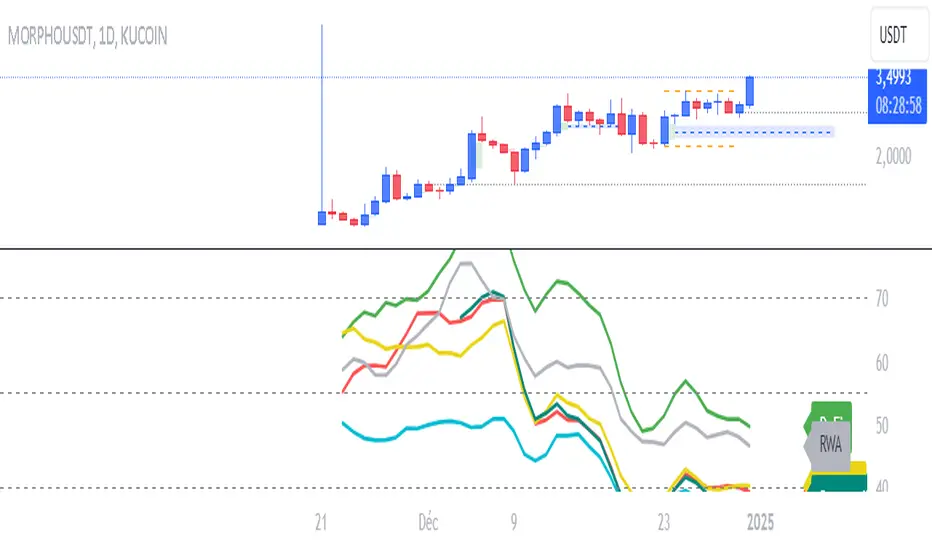
RSI NarrativesDescription:
The RSI Narratives script aggregates Relative Strength Index (RSI) values across multiple cryptocurrency narratives or sectors, providing an easy-to-read visual and alert system for trend reversals and overbought/oversold conditions. This tool is designed for traders looking to track sector-specific trends and compare performance across AI, DeFi, Level 1 blockchains, and more.
Key Features:
RSI Aggregation by Sector: Calculates average RSI for key narratives, including AI, DeFi, Level 1 blockchains, new memes, and more.
Customizable RSI Settings: Adjust RSI period, line width, and label offsets for personalized analysis.
Dynamic Alerts: Receive alerts when a narrative enters overbought or oversold territory, helping you act quickly on market movements.
Clean Visualization: Overlay sector-specific SMA lines with distinct colors and optional labels for quick interpretation.
Multi-Narrative Comparison: Analyze trends across diverse narratives to identify emerging opportunities.
Parameters for Customization:
RSI Period: Set the lookback period for RSI calculations (default: 14).
Line Width: Adjust the thickness of plotted lines (default: 2).
Label Offset: Control label placement for better chart readability.
Overbought/Oversold Thresholds: Configure the RSI levels for alerts (default: 70/40).
How to Use:
Add the script to your TradingView chart.
Customize the RSI parameters to suit your trading strategy.
Monitor the plotted SMA lines to identify narrative-specific trends.
Set alerts for overbought and oversold conditions to stay informed in real time.
Alerts System:
Alerts trigger when a narrative crosses predefined overbought or oversold levels.
Text notifications suggest potential trading actions, such as selling on overbought or buying on oversold.
Intended Users:
This script is ideal for crypto traders, sector analysts, and market enthusiasts who want to track performance across narratives and gain actionable insights into sector rotations.
Disclaimer:
This script is for educational and informational purposes only. It does not constitute financial advice. Please test on historical data and practice caution when trading.
DAILY Supertrend + EMA Crossover with RSI FilterThis strategy is a technical trading approach that combines multiple indicators—Supertrend, Exponential Moving Averages (EMAs), and the Relative Strength Index (RSI)—to identify and manage trades.
Core Components:
1. Exponential Moving Averages (EMAs):
Two EMAs, one with a shorter period (fast) and one with a longer period (slow), are calculated. The idea is to spot when the faster EMA crosses above or below the slower EMA. A fast EMA crossing above the slow EMA often suggests upward momentum, while crossing below suggests downward momentum.
2. Supertrend Indicator:
The Supertrend uses Average True Range (ATR) to establish dynamic support and resistance lines. These lines shift above or below price depending on the prevailing trend. When price is above the Supertrend line, the trend is considered bullish; when below, it’s considered bearish. This helps ensure that the strategy trades only in the direction of the overall trend rather than against it.
3. RSI Filter:
The RSI measures momentum. It helps avoid buying into markets that are already overbought or selling into markets that are oversold. For example, when going long (buying), the strategy only proceeds if the RSI is not too high, and when going short (selling), it only proceeds if the RSI is not too low. This filter is meant to improve the quality of the trades by reducing the chance of entering right before a reversal.
4. Time Filters:
The strategy only triggers entries during user-specified date and time ranges. This is useful if one wants to limit trading activity to certain trading sessions or periods with higher market liquidity.
5. Risk Management via ATR-based Stops and Targets:
Both stop loss and take profit levels are set as multiples of the ATR. ATR measures volatility, so when volatility is higher, both stops and profit targets adjust to give the trade more breathing room. Conversely, when volatility is low, stops and targets tighten. This dynamic approach helps maintain consistent risk management regardless of market conditions.
Overall Logic Flow:
- First, the market conditions are analyzed through EMAs, Supertrend, and RSI.
- When a buy (long) condition is met—meaning the fast EMA crosses above the slow EMA, the trend is bullish according to Supertrend, and RSI is below the specified “overbought” threshold—the strategy initiates or adds to a long position.
- Similarly, when a sell (short) condition is met—meaning the fast EMA crosses below the slow EMA, the trend is bearish, and RSI is above the specified “oversold” threshold—it initiates or adds to a short position.
- Each position is protected by an automatically calculated stop loss and a take profit level based on ATR multiples.
Intended Result:
By blending trend detection, momentum filtering, and volatility-adjusted risk management, the strategy aims to capture moves in the primary trend direction while avoiding entries at excessively stretched prices. Allowing multiple entries can potentially amplify gains in strong trends but also increases exposure, which traders should consider in their risk management approach.
In essence, this strategy tries to ride established trends as indicated by the Supertrend and EMAs, filter out poor-quality entries using RSI, and dynamically manage trade risk through ATR-based stops and targets.

RSI Strategy With TP/SL - Lower TFThis Pine Script strategy integrates the Relative Strength Index (RSI) for trade signals with user-defined Take Profit (TP) and Stop Loss (SL) levels. It's designed for flexible application in different market conditions, offering long, short, or dual-direction trading.
Short Description
The strategy uses the RSI to identify overbought and oversold market conditions:
Buy signal: When RSI drops below the specified "Buy Level."
Sell signal: When RSI rises above the "Sell Level."
Additionally, it manages risk and profit targets with:
Take Profit (TP): Exits trades when the price reaches a percentage gain.
Stop Loss (SL): Exits trades to limit losses if the price falls by a certain percentage.
The strategy is versatile and includes options for visualizing performance, monthly profit/loss data, and detailed trade metrics.
How to Use
Set Parameters:
RSI Period: Default is 14. Adjust based on your analysis.
RSI Buy/Sell Levels:
Buy Level: Default is 40. Consider higher levels for conservative entries.
Sell Level: Default is 60. Lower this for earlier exits.
Take Profit (%): Set your profit target (default: 5%).
Stop Loss (%): Set your risk tolerance (default: 2%).
Trade Direction: Choose "Long Only," "Short Only," or "Both."
Interpret Signals:
Buy signals appear when RSI crosses below the buy threshold.
Sell signals appear when RSI crosses above the sell threshold.
Risk Management:
The strategy dynamically calculates TP and SL levels for each trade.
TP/SL is applied using the percentage input based on the entry price.
Monitor Performance:
Review trade statistics in the "Strategy Tester."
Use the monthly performance table to track P/L across months.
Customize Alerts:
Alerts for buy, sell, TP, and SL events can be used to automate notifications.
Key Features
Configurable RSI Settings: Adaptable to various market conditions.
Risk Management: Built-in TP and SL management.
Customizable Trade Direction: Tailored for long-only, short-only, or both directions.
Monthly P/L Table: Visualizes performance trends over time.
Alerts: Notifies when critical trade events occur.
Please do your own research before ase this to your real trading.
