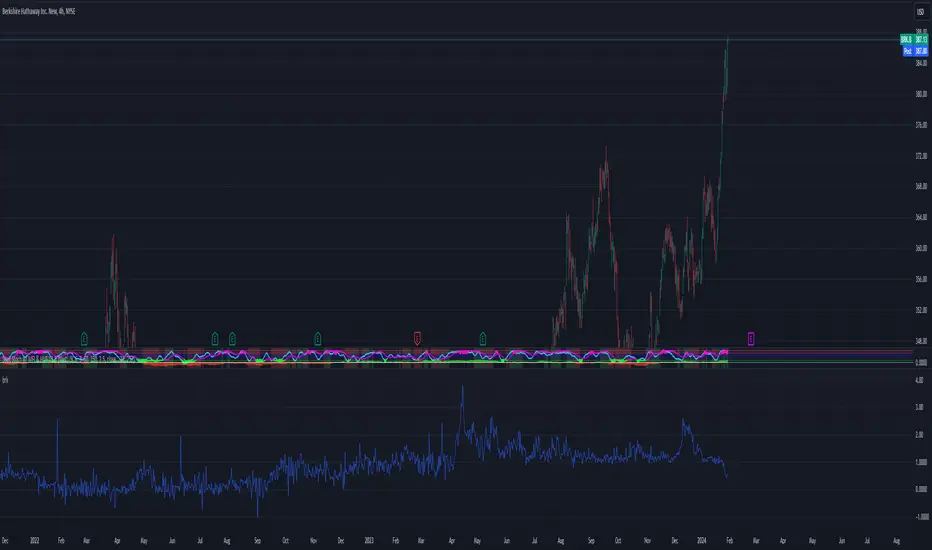
OBV with Volume/Momentum DivergenceCredits go to vyperphi696 and LazyBear for the original OBV with Divergence script.
This indicator has the new option to check for momentum divergence, which I have done by adding RSI and MACD data.
Hence the indicator allows combined testing of volume and momentum divergence. This feature aims to improve trend reversal detection by reducing false positives.
In summary, 3 divergence categories are shown by default as lines:
Volume + RSI + MACD (dark green/red)
Volume + RSI / Volume + MACD (light green/red)
Volume (gray)
Line colors can be adjusted via plot settings. Therefore it is also possible to distinguish Volume + RSI and Volume + MACD divergence if necessary.
Lastly, I edited the indicator scaling mechanism when changing from one timeframe to another; the transitions are smoother now. This only applies when auto-scaling is off.
"N+credit最新动态" için komut dosyalarını ara

Relative Aggregate Strength OscillatorCredits to
@wolneyyy - "Mean Deviation Detector - Throw Out All Other Indicators"
And
@algomojo - "Responsive Coppock Curve"
And the default Relative Strength Index
The candles are the average of the MFI ,CCI ,MOM and RSI values presented as candles, they seemed similar enough in style to me so I created candles out of each and the took the sum of all the candle's OHLC values and divided by 4 to get an average.
In the Background we have @wolneyyy's - "Mean Deviation Detector - Throw Out All Other Indicators" in blue
along with @algomojo's - "Responsive Coppock Curve" in red and green.

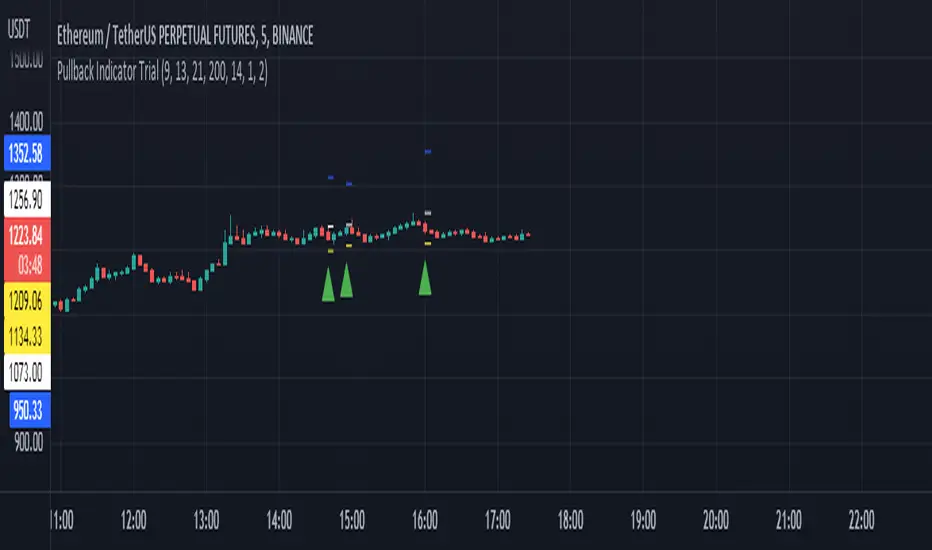
Pullback Indicator Trial- Credits to ZenAndTheArtOfTrading
- Contains 3 EMA's: 8, 13, 21
- Plots Entry Price, Stop Price, and Target Price (Recommend using Stop Market or Stop Limit Orders)
- If Buy Entry Price is not hit and a new Buy signal appears, you can create multiple orders or ignore the new one or cancel the previous and take the new signal. As for Sell signals, do the opposite.
- If Buy Entry Price is not hit and a Sell signal appears, decide to take trade at your own discretion and vice versa(sell side).
WAE v4Credits to Waddah Attar Explosion V2
Changes major things
Adds a feature to disable absolute value mode. Makes it a whole lot easier to read, and is a major change
Adds a counter feature, counting how many bars it takes for it to "explode" out of deadzone
Adds a feature to normalize the chart by certain lines, changing the proportions visually
Adds a feature to filter incorrect colors, making the indicator more consistent.

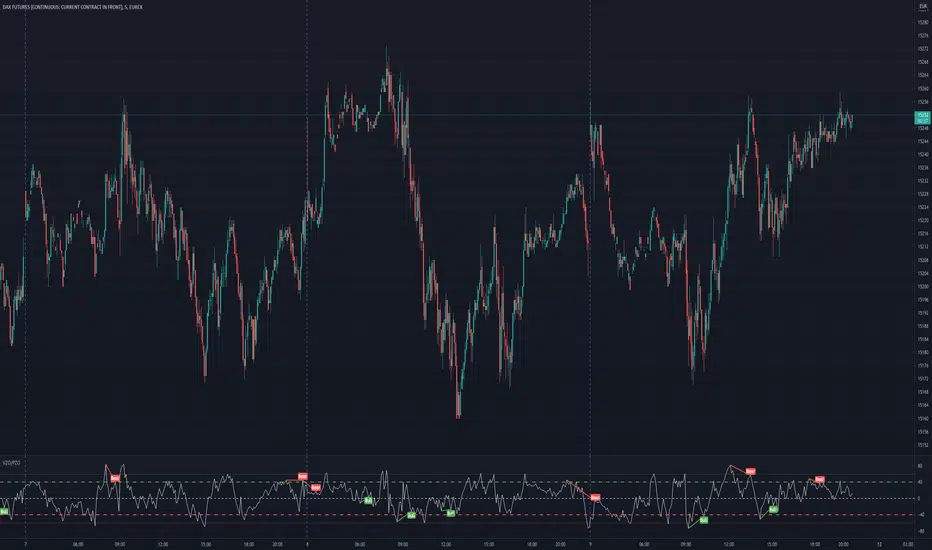
Volume Zone Oscillator and Price Zone Oscillator (VZO/PZO)Credits go to @NeoButane as basis is taken from his open-source code and I modified it - changes described below.
Usage:
Positive -> bullish, negative -> bearish
-60/60 is seen as the limit of the oscillator range, and a pullback should be expected from there
-40/40 are in general Oversold/Overbought levels
Modifications:
added alerts
added Divergences formula
added additional types of smoothing
added signal display based on described above usage (extreme levels of oscillations and bounce back)
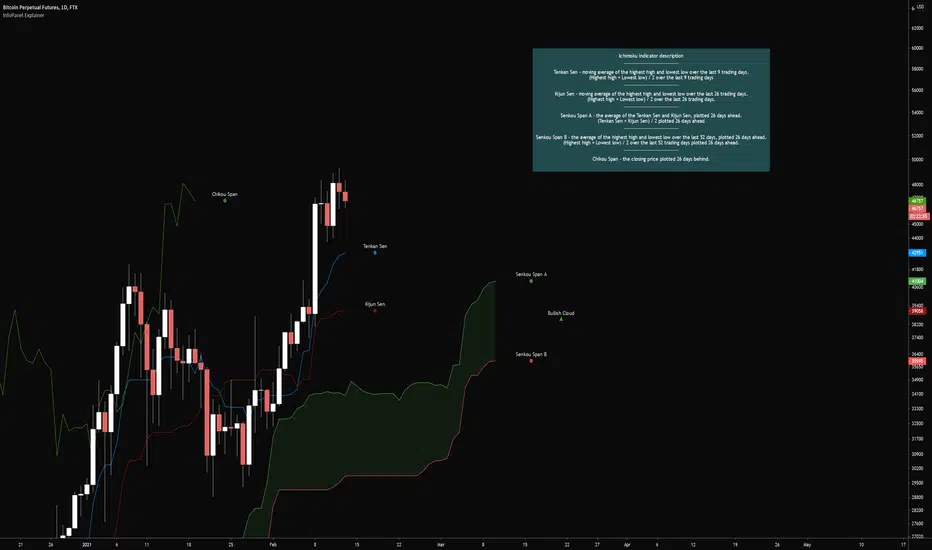
InfoPanel ExplainerCredits to @RicardoSantos for the infopanel script (www.tradingview.com)
Publishing this to hopefully start a common practice for indicators with multiple signals/rules to add an explanation of them into the indicator itself.
This would make it easier to learn new indicator setups when the reference material is all on one webpage.
May or may not be helpful to others but I needed it for something.
The indicator has inputs for where the label should go, the text size, whether or not to display the infopanel, and changing the colors for the text and background. I tried making it user friendly as possible
The example used is showcasing what the plots are in the ichimoku cloud indicator.
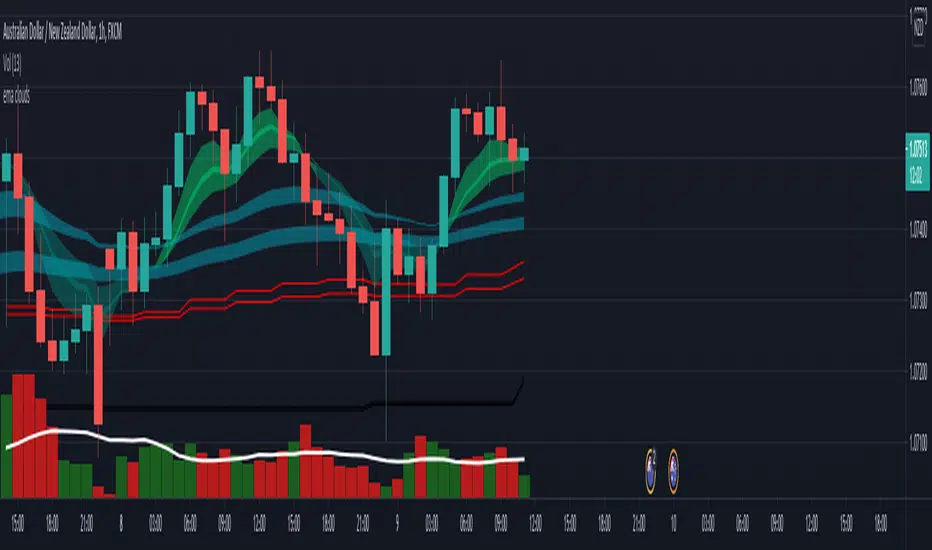
EMA cloudsCredits to Ripster47
5-12 ema cloud
34-50 ema cloud
72-89 ema cloud
1H is actually very important on swings + Daily/Weekly Level
5-12 EMA clouds on 1H Tell Trend
34-50 EMA clouds on 1H act as Dynamic Trendlines
72-89 EMA clouds on 3min acts as Dynamic Trendlines
20 EMA Daily Moving Average to Intraday ChartCredits to freedom_trader_
20 EMA to intra day chart, enjoy!
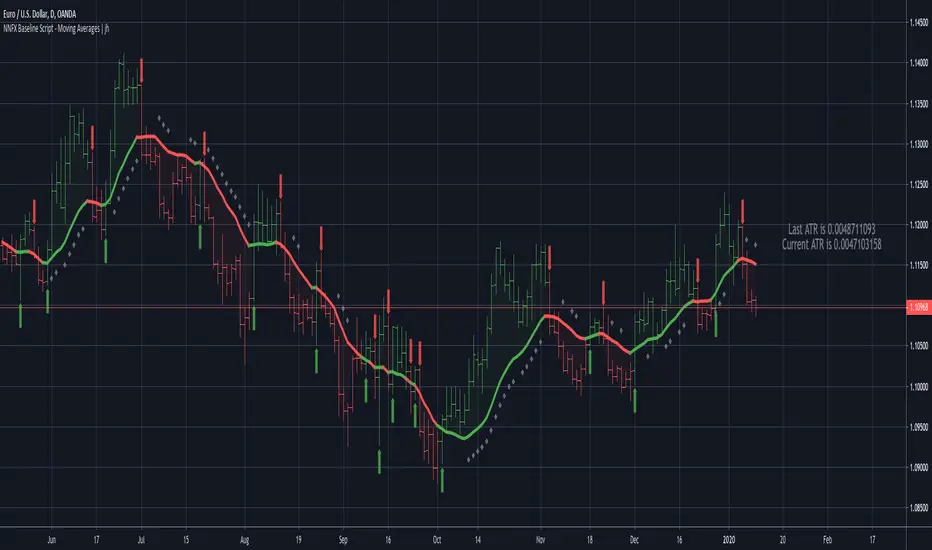
NNFX Baseline Script - Moving AveragesCredits to @Fractured
Adapted the "Many Moving Averages" script to VP's NNFX No Nonsense Forex method.
Includes:
- ATR bands and labels
- Price is > 1 ATR away from baseline indication
Without ATR Bands and bar colors
Available MAs
"ALMA", "EMA", "DEMA", "TEMA", "WMA", "VWMA", "SMA", "SMMA", "HMA", "Kijun", "McGinley"
Twiggs Money Flow Fisher Transform// Credits to @LazyBear
// This is an experimental indicator (Originaly coded by Lazybear) modified by @haidinurhasfi by applying the Fisher Transform to Twiggs Money Flow.
// Tune the length according to your trading style and instrument

Zerg range filter credit to Kivanc turkish pinecoder for base indicator i reworked with chatgpt and some common sense
this indicator similar to the ADX but i think its better visually to keep you out of market conditions that are unfavorable.
i made original indicator to work in a 0-100 enviroment (before it was a zero middle line oscillator) and added background coloring that has a lower and higher threshold setting. i also added a smoothing moving average. this will trigger threshold levels (not the core oscillator)
above higher level would indicate trending market conditions and its purple. these are the areas where you might want to buy low period moving average bounces like 10 or 21 ema
lower band will paint indicator background blue and its cold, meaning range bound trade ideas are likely play out better. selling resistance and buying horizontal supports for example.
you are encourage to play with lookback period and change thresholds until you find something that works for your trading.
on the picture above it illustrates how i intended its usage.
it also shows divergences which was not intended but also a function.
you can also observe as the oscillator likes to coil up into a tight range (horizontal or a wedge formation) and when these break their trendlines explosive moves are incoming usually.
if you have a trading system and can generate a lot of signals but want to filter out some loser trades this could be the indicator you were looking for.
i hope this will be inline with community guidelines. my other publishing got removed unfortunately

The Final Countdown//Credit to ©SamRecio for the original indicator that this is based on, which is called, "HTF Bar Close Countdown".
Here are the key differences between the two indicators (That a user would care about):
1.) 10 timeframe slots (double the original number).
2.) Many more timeframe options ('1', '3', '5', '10', '15', '30', '45', '1H', '2H', '4H', '6H', '8H', '12H', 'D', 'W').
3.) Ability to structure timeframes however you want (Higher up top descending, vice versa, or just randomly.).
4.) Support for hour-based timeframes (1H, 2H, etc.).
5.) Displays minutes as numbers, hours with a number followed by H (ex. 1H), and anything above with a letter (D for day, W for week).
6.) Dynamic colors based on remaining time percentage (green->yellow->red) with two user-defined thresholds.
7.) Alerts for when timeframes are close to closing (yellow->red).
8.) More granular timeframe selection options.
9.) Background colors for an additional visual alert.
------Colors background the selected color for each timeframe (Default is all timeframes are blue with 80% transparency).
------This does not repaint, so the color will persist once the red condition is over.
------As soon as you leave the timeframe though, it will be erased and the new timeframe will begin tracking red conditions.
------It always starts from the current bar, so it is not applicable to historical bars unless you leave it running for an extended period of time.
------Do note that since this is not actual paint or colored pencils, the colors do not blend.
------The most recent timeframe to enter a red condition will be the background that you see unless you leave the timeframe and return.
--------------------------------------------------------------------------------------------------------------------
Now for the description and instructions....
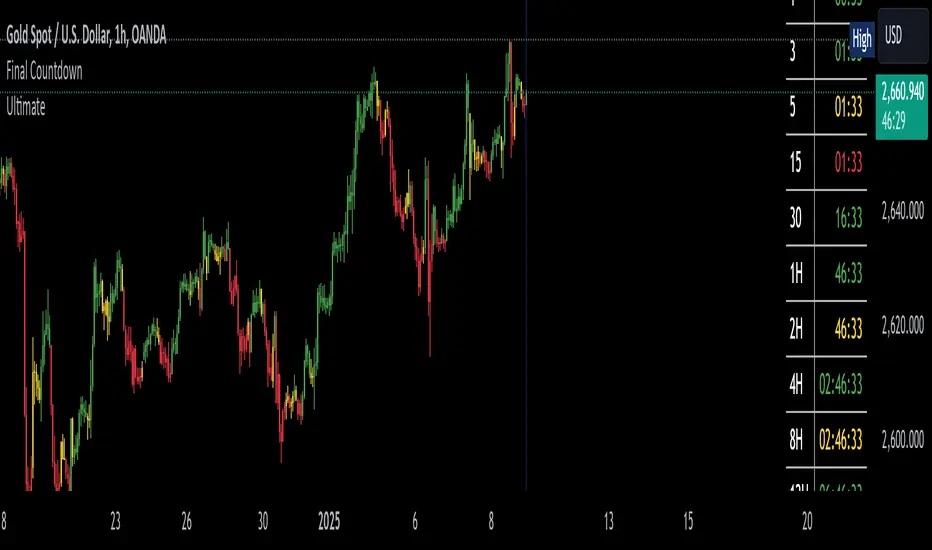
IT'S THE FINAL COUNTDOWN!
This indicator helps shorter-timeframe traders track multiple timeframe closings simultaneously, providing visual, audio and notification alerts when bars are nearing their close. It's particularly useful for traders who want to prepare for potential price action around bar closings across different timeframes. If you're a HODL till you're broke kind of trader, you don't need this.
-------------------------------
Multi-Timeframe Tracking
-------------------------------
- Monitors up to 10 different timeframes simultaneously
- Supports various timeframes from 1 minute to weekly (1m, 3m, 5m, 10m, 15m, 30m, 45m, 1H, 2H, 4H, 6H, 8H, 12H, Daily, Weekly)
- Timeframes can be arranged in any order (ascending, descending, or custom)
-----------------
Visual Display
-----------------
- Shows a countdown timer for each selected timeframe
- Dynamic color changes based on time remaining:
Green: More than 15% of bar time remaining
Yellow: Between 15% and 5% remaining
Red: Less than 5% remaining
- Customizable background colors appear when timeframes enter their red zone
----------------
Alert System
----------------
- Built-in alerts trigger when any timeframe enters its red zone
- Each timeframe can have its alerts toggled independently
------
-------------
--------------------------
- Setup Instructions -
--------------------------
-------------
------
-------------------------
Timeframe Selection
-------------------------
- Choose up to 10 timeframes to monitor
- Each timeframe has its own toggle switch to turn it on/off
- Default configuration starts from 5m and goes up to 12H
-------------------------
Visual Customization
-------------------------
- Adjust the table size, position
- Customize frame and border colors
- Modify the yellow and red threshold percentages
--------------------------------
Background Color Settings
--------------------------------
- Enable/disable background colors for each timeframe
- Choose custom colors for each timeframe's background
- Default setting is blue (with a fixed 80% transparency)
-------------
Usage Tips
-------------
- Use the countdown table to prepare for multiple timeframe closes as big moves (especially reversals) tend to begin come after higher timeframe changes (sometimes to the second).
- Watch for color changes to anticipate important closing periods to avoid getting trapped in bad trade (please always use stop losses if trading, in general).
- Set up alerts for critical timeframes that require immediate attention (2H, 4H, etc.).
- Use background colors as an additional visual cue for timeframe closes.
- Position the table where it won't interfere with your chart analysis.
ICT CheckListCredit to the owner of this script "TalesOfTrader"
The Awakening Checklist indicator is a tool designed to help traders evaluate certain key market conditions and elements before making trading decisions. It consists of a series of questions that the trader must answer using the options "Yes", "No" or "N/A" (not applicable).
“Has Asia Session ended?” : This question aims to determine if the Asian trading session has ended. The answer to this question can influence trading strategies depending on market conditions.
“Have you identified potential medium induction?” : This question concerns the identification of potential average inductions on the market. Recognizing these inductions can help traders anticipate future price movements.
"Have you identified potential PoI's": This question asks about the identification of potential points of interest on the market. These points of interest can indicate areas of significant support or resistance.
"Have you identified in which direction they are creating lQ?" : This question aims to determine in which direction market participants create liquidity (lQ). Understanding this dynamic can help make informed trade decisions.
“Have they induced Asia Range”: This question concerns the induction of the Asian range by market participants. Recognizing this induction can be important in assessing future price movements.
“Have you had a medium induction”: This question asks about the presence of a medium induction on the market. The answer to this question can influence trading prospects.
“Do you have a BoS away from the induction”: This question aims to find out if the trader has an offer (BoS) far from the identified induction. This can be a risk management strategy.
"Doas your induction PoI have imbalance": This question concerns the imbalance of points of interest (PoI) linked to induction. Recognizing this imbalance can help anticipate price movements.
“Do you have a valid target in mind”: This question aims to find out if the trader has a clear trading objective in mind. Having a goal can help guide trading decisions and manage risk.

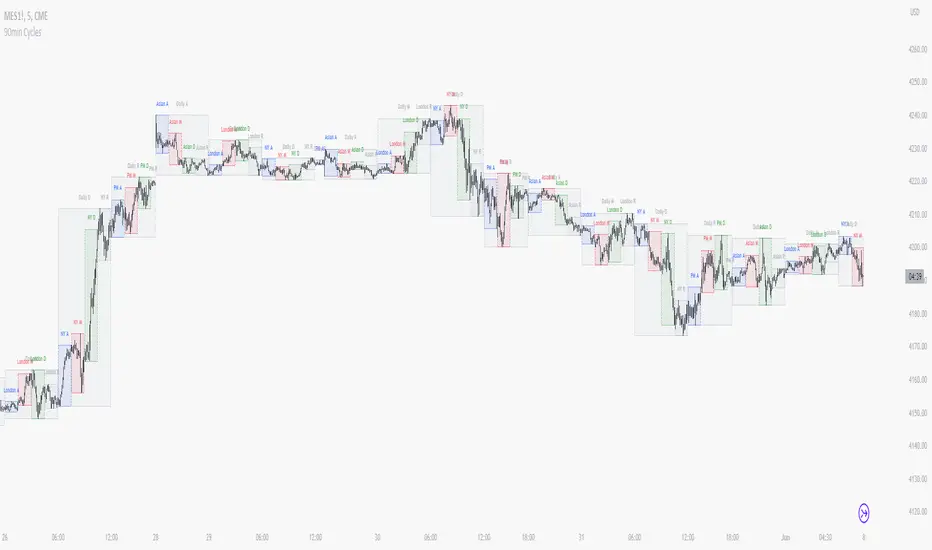
90 Minute Cycles + MTFCredit goes to LuxAlgo for the inspiration from 'Sessions' which allowed users to analyse specific price movements within a user defined period with tools such as trendline, mean and vwap.
Settings
Sessions
Enable Session: Allows to enable or disable all associated elements with a specific user set session.
Session Time: Opening and closing times of the user set session in the hh:mm format.
Range: Highlights the associated session range on the chart.
Ranges Settings
Range Area colour: Set each range to a specific colour.
Range Label: Shows the session label at the mid-point of the session interval.
Usage
By breaking 24hrs in quarters, starting with an Asian range of 18:00 NY time you can visualise the principles of Accumulation, Manipulation, Distribution and Rebalance. Know as AMD or PO3 (Power of Three), the principle is that the Manipulation phase will break above or below the Accumulation, before moving in an apposing direction and then rebalancing. This only works when there is a higher timeframe PD array or liquidity to support an apposing move.
Further to the daily quarters, each one can then be broken down again into 90min cycles. Again, each represents AMD, allowing the user an opportunity to watch for reversals during the 90min manipulation phase.
Note: Ensure the Asian Cycle always begins at 18:00 NY time.
The example shows that the 90min cycle occurs, followed by an apposing move away in price action
Here is the Daily cycle, highlighting the Manipulation phase.
Enjoy!
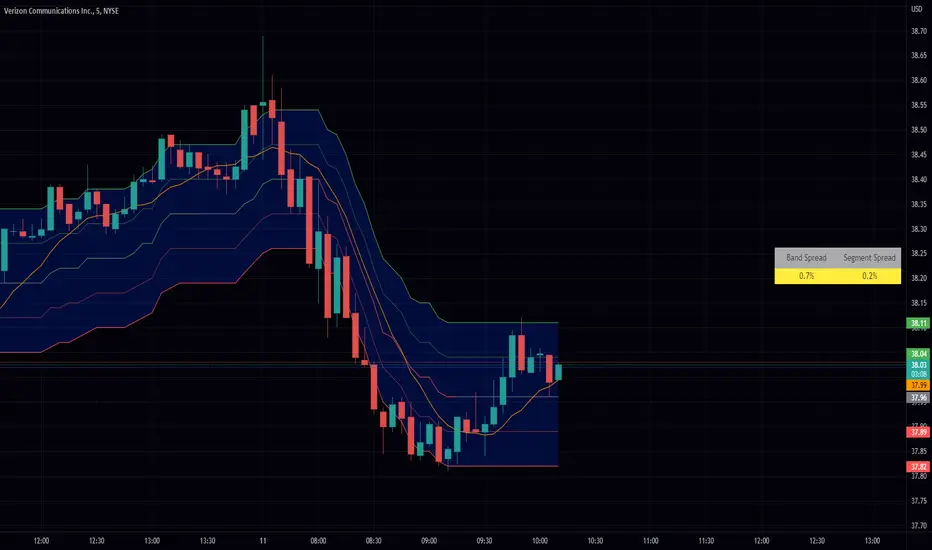
VWAP Bollinger Band Crossover Breakout with ResistanceCredit to © Jesus_Salvatierra for VWAP script
This script help you find a trend in momentum stock that is about to breakout and shows resistance point. This script utilizes Bollinger bands VWAP and is good for intra day charts.
VWAP, or Volume Weighted Average Price, is a technical analysis tool used to measure the average price a security trades at during a given time period, weighted by the trading volume for each price level. It is commonly used by traders and investors to identify the true average price of a security and to assess whether they are buying or selling at a fair price.
A Bollinger Band is a technical analysis tool that uses standard deviation to measure the volatility of a security. The Bollinger Band is typically composed of three lines: the upper band, the lower band, and the middle band. The middle band is a simple moving average of the security's price, while the upper and lower bands are calculated based on the standard deviation of the security's price.
A Bollinger Band crossover occurs when the price of a security crosses above or below one of the bands. When the price crosses above the upper band, it is considered overbought, while when it crosses below the lower band, it is considered oversold. Traders often use Bollinger Band crossovers as a signal to enter or exit a position, depending on their trading strategy.
The VWAP and Bollinger Band crossover are two separate technical analysis tools that can be used in conjunction with each other. When a security's price crosses above or below the Bollinger Band, traders may look to the VWAP to confirm whether the security is trading at a fair price. If the security is trading above the VWAP, it may be overvalued, while if it is trading below the VWAP, it may be undervalued. Similarly, traders may use the Bollinger Band crossover as a signal to enter or exit a position, while also taking into account the VWAP to assess whether the price is fair.

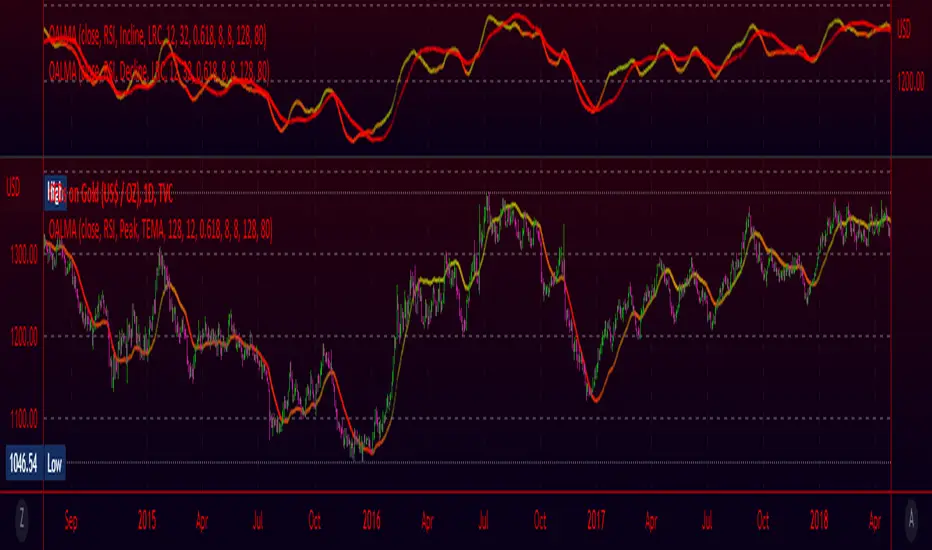
Oscillating Length Moving Averages***CREDIT TO TradingView's TA Library*** (), Attempted to use "import TradingView/ta/4" to import the library, but for whatever reason
some of the functions failed to work, while others had no issue, so I opted to just copy paste what I wanted to use.
This moving average uses an oscillator to influence the length used during calculation. Extremely customizable/tunable with ability to change Max and Min length values, length multiplier, length multiple,4 different settings ,( Decline , <>Peak, >Decline , <>Peak, >
QQE Student's T-Distribution Bollinger Bands Oscillator Credit to all of the developers on this project (aka all of the places I got the code from lol) @eylwithsteph @storma @Fractured @lejmer @AlexGrover @Montyjus @Jiehonglim @StephXAGs @peacefulLizard50262 @gorx1 @above-c-level
This script utilizes @above-c-level 's Student's T-Distribution script to give us a great estimation of volatility. I took this idea and apply it to the QQE filter! That being said I have added a boat load of features as to make this script as useful to as many people as possible. This is the Osc version
Included averages: 'TMA', 'ALMA', 'EMA', 'DEMA', 'TEMA', 'WMA', 'VWMA', 'SMA', 'SMMA', 'HMA', 'LSMA', 'JMA', 'VAMA', 'FRAMA', 'ZLEMA', 'KAMA', 'IDWMA', 'FLMSA', 'PEMA', 'HCF', 'TIF', 'MF', 'ARMA', 'DAF', 'WRMA', 'RMA', 'RAF', 'A2RMA', 'QQE 1', 'QQE 2','Centroid',"Harmonic Mean","Geometric Mean","Quadratic Mean","Median","Trimean","Midhinge","Midrange","VWAP"
Included Features: Smoothing, Additional Moving Average, Log Space, Mean Momentum via Derivative, Normalization, Convergence DIvergence, Candle View
Use this just like macd/rsi but instead this directly reflects the band version! It also shows really valid support and resistance. Use this in combination with the band version for more power.

QQE Student's T-Distribution Bollinger BandsCredit to all of the developers on this project (aka all of the places I got the code from lol) @eylwithsteph @storma @Fractured @lejmer @AlexGrover @Montyjus @Jiehonglim @StephXAGs @peacefulLizard50262 @gorx1 @above-c-level
This script utilizes @above-c-level 's Student's T-Distribution script to give us a great estimation of volatility. I took this idea and apply it to the QQE filter! That being said I have added a boat load of features as to make this script as useful to as many people as possible.
Included averages: 'TMA', 'ALMA', 'EMA', 'DEMA', 'TEMA', 'WMA', 'VWMA', 'SMA', 'SMMA', 'HMA', 'LSMA', 'JMA', 'VAMA', 'FRAMA', 'ZLEMA', 'KAMA', 'IDWMA', 'FLMSA', 'PEMA', 'HCF', 'TIF', 'MF', 'ARMA', 'DAF', 'WRMA', 'RMA', 'RAF', 'A2RMA', 'QQE 1', 'QQE 2','Centroid',"Harmonic Mean","Geometric Mean","Quadratic Mean","Median","Trimean","Midhinge","Midrange","VWAP"
Included Features: Smoothing, Additional Moving Average, Log Space, Mean Momentum via Derivative
Use this just like BB but instead (as long as you are on qqe) you get real prices that are stable! It also shows really valid support and resistance. Use this in combination with the osc version for more power.
Lepelle's Key LevelsCredit to original code goes to paaax and NSDT. Modified to include premarket H/L levels and to show only daily levels. Indicator includes Close levels.
-US Premarket High and Low Levels
-Daily OHL Levels (No close included)
-Yesterday and Previous day OHLC level
-Labels and ability to modify user preferences (color, line)

scalping low lag tema etalCredit for original idea goes to 1 min forex scalping by mikegoryunov
Changes include several lower lag filters (See line 3 for a list)
and values for profit, loss, and trail_points (See lines 48:53)
a, b, & c represent fast, medium, and slow filters. Basic idea is to monitor
crossovers of the three filters to determine buy/sells. Exits occur quickly within
the next time interval.
Note that this may be used for stocks and forex. The time interval can vary widely.
I have concerns about how to incorporate transaction costs with so many transactions.

[2020 Updated]Bitcoin Logarithmic Growth CurvesCredit goes to the original writer of the script, Quantadelic, who generously allowed anyone to copy/edit. I adjusted the value of the bottom/top intercept and slope to better fit the March 2020 coronavirus dip.
Use Bitstamp BTCUSD for better reading.
