MACD Aspray Hybrid Strategy The MACD Aspray Hybrid Strategy is a trend-following trading system based on a modified version of the MACD indicator.
"MACD" için komut dosyalarını ara
MACD Diff SignalWhen the MACD Absolute Histogram is above a threshold (set by nth lowest absolute histogram value in the rolling window) the indicator produces the MACD Histogram level, otherwise it produces 0. This Indicator is good for identifying bullish or bearish momentum.

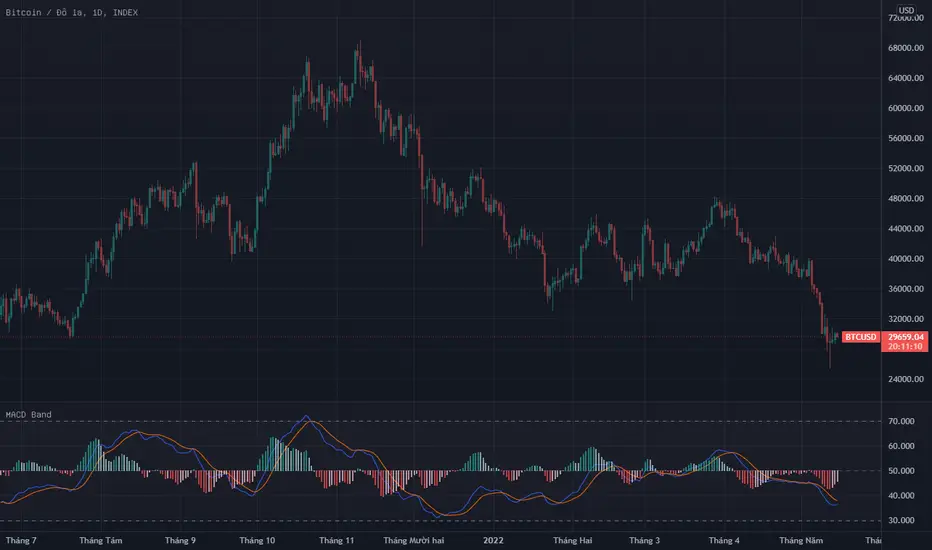
MACD in BANDSMy idea is to make the MACD histogram oscillating in a range from 0-100 just like the RSI .
I did it successfully, but compared to normal MACD histogram it is too low and hard to see because most values just fluctuate slightly above or below 50. So I'm happy and grateful to anyone who can offer guidance.
Image:
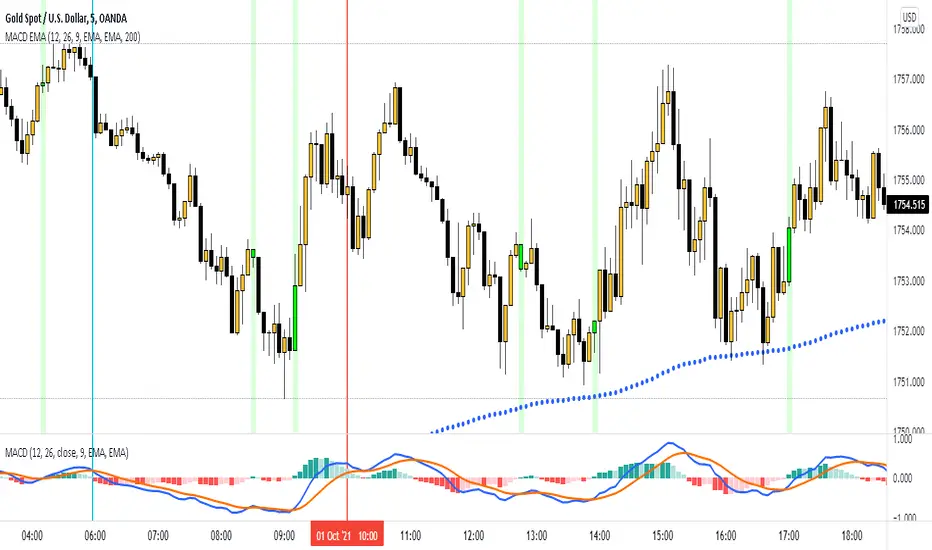
MACD EMA (by WJ)NOTE:
// MACD AND EMA CODE TAKEN FROM DEFAULT INDICATOR
// I HAVE ONLY MADE SOME ADJUSTMENTS FOR VISUAL AID
// I MADE THIS FOR MY OWN USE BUT HAVE DECIDED TO PUBLISH AND SHARE IN CASE ANYBODY WANTS TO USE IT
MACD EMA:
Bar colour and background colour
Buy signal shows when MACD does crossover below 0 line while above EMA (default 200)
Sell signal shows when MACD does crossover above 0 line while below EMA (default 200)
Alert notifications included
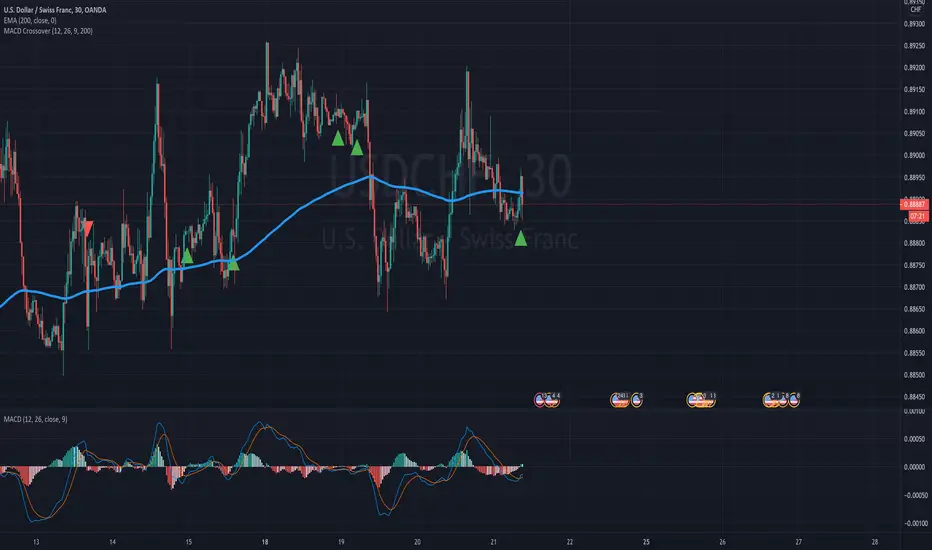
MACD Crossover Strategy with EMA200 Trend DetectionSimple MACD Strategy Indicator.
Rules:
- MACD Crossover with Signal Line
If
- MACD Crossover above zero line
- Price is below EMA200
=> Sell
If
- MACD Crossover below zero line (buy)
- Price is above EMA200
=> Buy
MACD with a Zero Line (baseline)I added the baseline to the built-in MACD code. This helps me to see the current state of the Signal and the MACD Line, as I do not use the Histogram. It is meant as a visual aid only.
Maybe there is somebody out there that finds this helpful too.

MACD Indicator BFThis is my MACD strategy but in indicator format so I can include alerts. The default settings are the same as in the strategy. The long and short conditions that the alerts are attached to are when the delta (usually illustrated as the histogram) crosses above or below the zero line respectively. There is one alert for long, one for short.

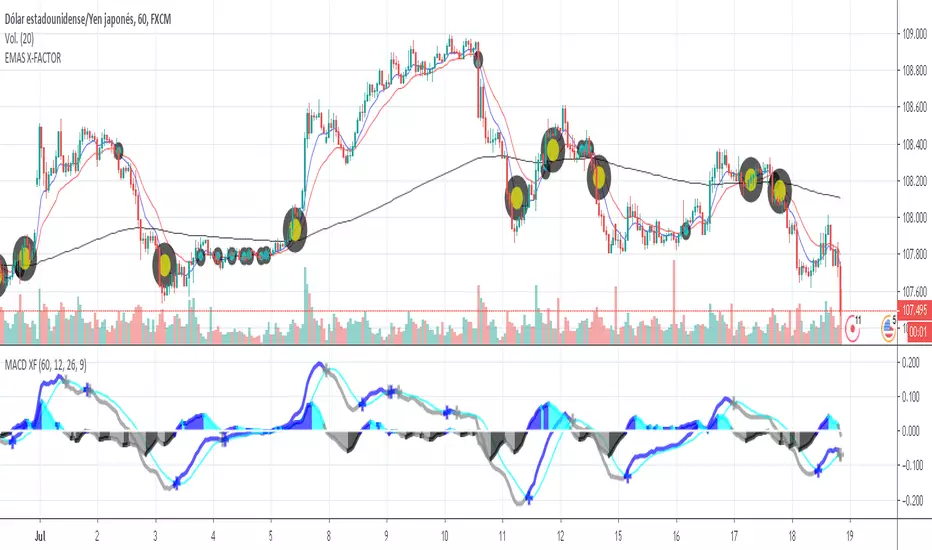
Macd X-FACTOReste indicador consiste en el trazado de dos líneas. La línea Convergencia Divergencia de la Media Móvil mas conocida como MACD es la diferencia entre dos medias móviles exponenciales y la línea de disparo es una media móvil exponencial de la diferencia. Si las líneas MACD se cruzan, entonces se toma como una señal de que es muy probable un cambio de tendencia. El indicador en cuestión nos marcará una cruz azul cuando haya dicho cruce y se genere una tendencia alcista asi como también nos marcara cuando haya un cruce y se genere una tendencia bajista, cruz gris se vende, cruz azul se compra.
MACD BFThis is a modified version of the MACD strategy in the public library. You can set the time period you want in the input parameters, along with the MACD and signal line values.
The default values for this strategy are 12, 26, 12. These settings seem favorable to BTC/USD pairs.
The strategy is simple - when the histogram crosses above zero, a buy signal is generated, when it crosses below zero, a sell signal is generated.
If an opposing signal is generated, we exit the current trade and enter the new one.
You can set a stop-loss as a percentage in the input parameters - for example, if you enter 5, the strategy will exit when the trade goes the wrong way by 5%.
The default money management strategy is to trade 100% of the equity. This can be changed in input settings like it can with any strategy.

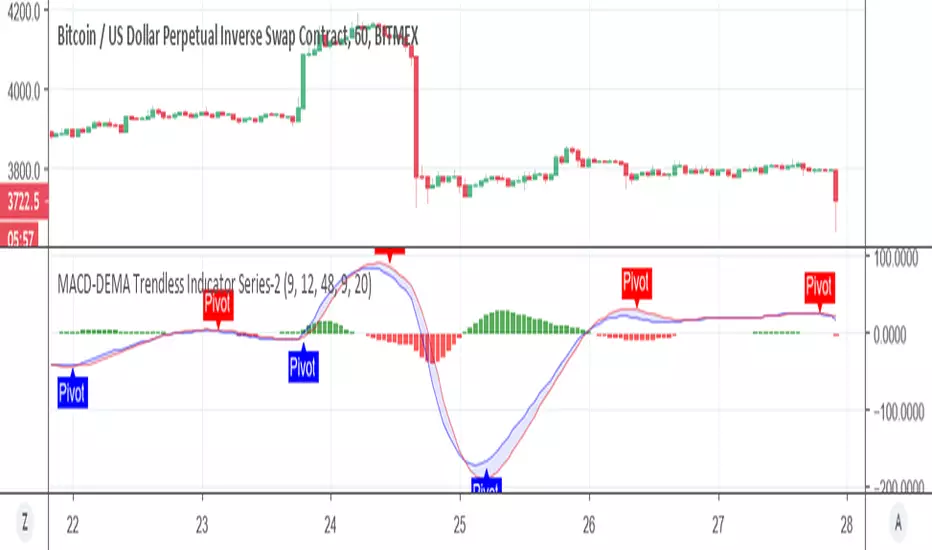
MACD-DEMA Trendless Indıcator Series-2Using This script of MACD DEMA
we play little to add pivot point to the macd so we can get the trend of it better:)
MACD x SuperTrend with trailing stoplossThis trading strategy is based on MACD crossover and crossunder. It uses the supertrend to identify the trend it is trading on and takes trades accordingly. You can use the built in risk to reward ratio parameter through the settings of the indicator for your desired R/R
My goal in creating this indicator was to learn about risk management. This indicator will put up a stop-loss and take profit target according to the entry point it shows.
This indicator showed me the best results on BTC at 5min price chart. I'm new to trading so, do your own due diligence

MACD minutesIt´s a multiple (3) Moving Average Convergence Divergence (MACD) indexes.
It was created to help traders to identify trend changes in multilple time frames, in the same graph.

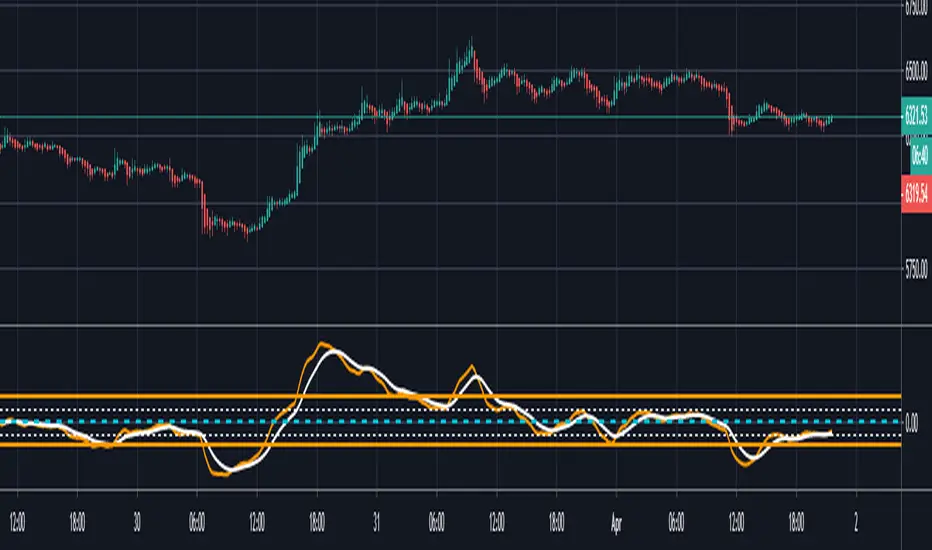
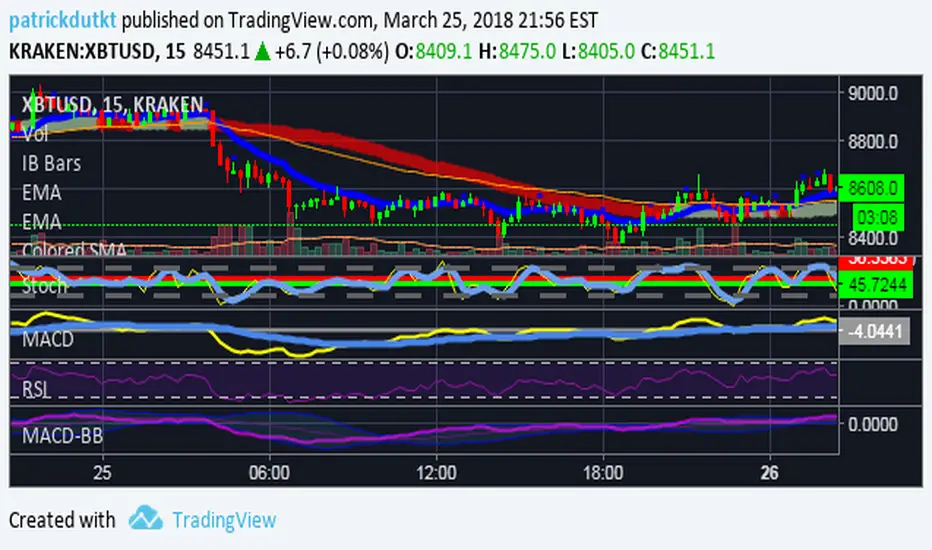
MACD At Scales with AlertsI use the horizontal scale lines on the MACD indicator as part of my scalping strategy along with other indicators like RSI/EMA and Market Cipher B when trading BTC
I am looking for a cross above or below the 12.5 and 25 horizontal scale lines, along with lining up other indicators
I set my alerts on the 5 min TF and look to the 15 and 30 min TF's for further confirmation.
I have find the scale lines to be very useful for visual reference of the crosses, above/below 25 lines is mostly a safer trade, crosses above/below 12.5 lines can have more risk, crosses between 0 baseline and 12.5 can have a higher return but have much more risk.
Don't ever use just this indicator by itself, you must always have at least 2 indicators running
This is an example of the TF's not lining up, so a entry here would be high risk
This is an example of the TF's lining up, so a entry here would be less risk
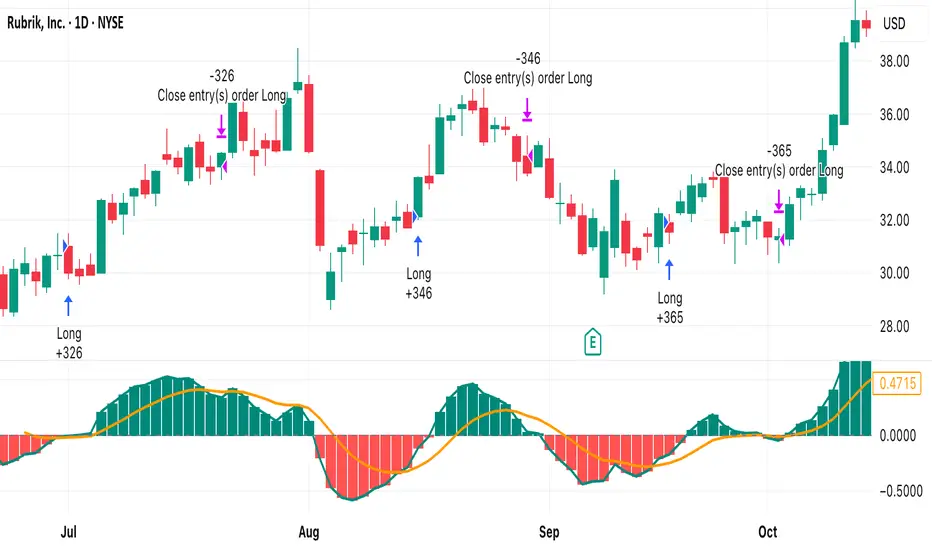
MACD Strategy With HistogramCombines MACD strategy for backtesting with a plotted histogram and orders

MACD Strategy with HistogramThis combines a strategy for backtesting with a plotted MACD graph and orders

MACD Strategy con alertasBasado en el MACD Strategy original. Se modificó para poder utilizar las alarmas. Probado en cryptos en velas de 4 horas, muy eficiente!

MACD for colour blind peopleThis is a MACD for the 1% of the population who suffer from Deuteranopia, commonly known as colour blindness (red-green)
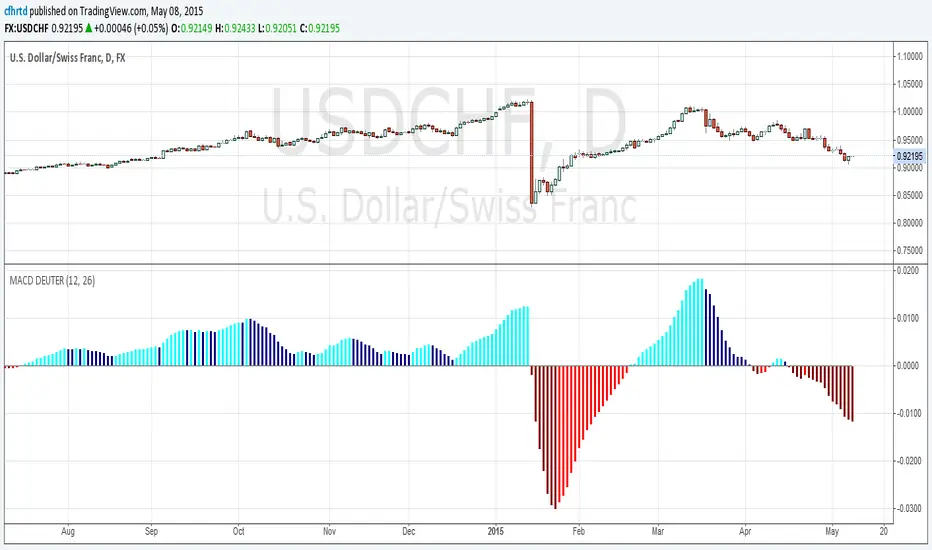
MACD for colour blind peopleTihs is a MACD for the 1% of the population who suffer from Deuteranopia, commonly known as colour blindness (red-green)
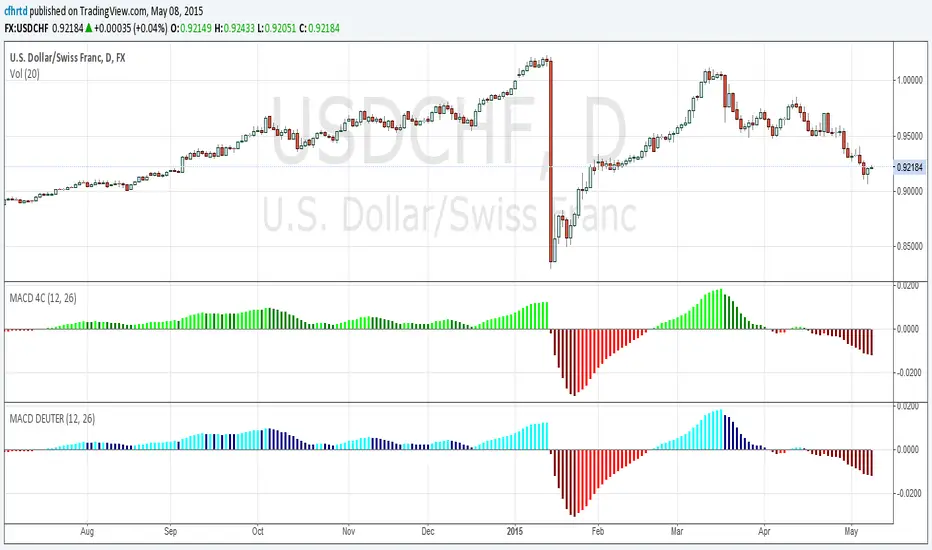
MACD DEUTERANOPIEThis is a 4 coloured MACD for the appr. 1% of People who suffer from Deuteranopia, commonly known as colour blindness (red-green).

MACD Split ColorsStandard MACD modified to show the histogram in different colors for positive/negative.
Ignore all the extra stuff in the chart, I didn't realize at this point I couldn't change it later!

MACD Sniper [trade_lexx]📈 MACD Sniper — Improve your trading strategy with accurate signals!
Introducing the MACD Sniper , an advanced trading indicator designed for a comprehensive analysis of market conditions. This indicator combines MACD (Moving Average Convergence Divergence) with various types of moving averages (SMA, EMA, WMA, VWMA, KAMA, HMA, ZLEMA, TEMA, ALMA, DEMA), providing traders with a powerful tool for generating buy and sell signals. It is ideal for traders who need an advantage in detecting changes in trends and market conditions.
🔍 How the signals work
1. Histogram signals:
— A buy signal is generated when the MACD histogram is below zero and begins to grow after the minimum number of falling histogram columns, which are indicated in the indicator menu. This indicates that selling pressure has decreased, the market is oversold and ready for a rebound. The signals are displayed as green triangles labeled "H" under the histogram graph. On the main chart, buy signals are displayed as green triangles labeled "Buy" under candlesticks.
— A sell signal is generated when the MACD histogram is above zero and begins to fall after the minimum number of growing histogram columns, which are indicated in the indicator menu. This indicates that the buying pressure has decreased, the market is overbought and ready for correction. The signals are displayed as red triangles labeled "H" above the histogram graph. On the main chart, the sell signals are displayed as red triangles with the word "Sell" above the candlesticks.
2. Moving Average Crossing Signals (MA):
— A buy signal is generated when the Fast Moving Average (MACD) crosses the Slow Moving Average (Signal Line) from bottom to top. This indicates a possible upward reversal of the market. The signals are displayed as green triangles labeled "MA" under the MACD chart. On the main chart, buy signals are displayed as green triangles labeled "Buy" under candlesticks.
— A sell signal is generated when the Fast Moving Average (MACD) crosses the slow Moving Average (Signal Line) from top to bottom. This indicates a possible downward reversal of the market. The signals are displayed as red triangles labeled "MA" above the MACD chart. On the main chart, the sell signals are displayed as red triangles with the word "Sell" above the candlesticks.
🔧 Signal filtering
— Minimum number of bars between signals
This filter allows the user to set the minimum number of bars that must pass between the generation of two consecutive signals. This helps to avoid frequent false alarms and improves the quality of the generated signals. Setting this parameter allows you to filter out the noise in the market and make the signals more reliable. For example, if the value is set to 5, then a new signal will be generated only after 5 bars have passed since the previous signal.
— "Wait for the opposite signal" mode
In this mode, Buy and Sell signals are generated only after receiving the opposite signal. This means that a buy signal will be generated only after the previous sell signal, and vice versa. This approach adds an additional level of filtering and helps to avoid false positives. This is especially useful in conditions of high market volatility, when false signals often occur.
— RSI filter
The Relative Strength Index (RSI) is used for additional filtering of buy and sell signals. The RSI helps determine whether a market is overbought or oversold. The user can set overbought and oversold levels, and signals will be generated only when the RSI is in the specified ranges. For example, a buy signal will be generated only if the RSI is in the range between 10 and 30 (oversold), and a sell signal if the RSI is in the range between 70 and 90 (overbought). This helps to avoid false signals in extreme market conditions.
🔌 Connector Histogram, MA, Combined 🔌
These parameters allow you to connect the indicator to trading strategies and test the signals throughout the trading history. This makes the indicator an even more powerful tool for traders who want to test the effectiveness of their strategies on historical data.
Connector Histogram provides the ability to connect signals based on the MACD histogram to trading strategies.
Connector MA allows you to connect signals based on the intersection of moving averages (MA) of the MACD, which can also be used for automatic trading or strategy testing.
The combined connector combines signals based on both a histogram and the intersection of moving averages, making the analysis more comprehensive and reliable, which is especially useful for traders seeking to improve the quality of their trading decisions.
🔔 Alerts
The indicator provides the ability to set up notifications for buy and sell signals, which allows traders to keep abreast of important market events without having to constantly monitor the chart. Users can set up notifications that will alert them when buy or sell signals appear, helping them respond to market changes in a timely manner and make informed decisions. These notifications can be configured for various types of signals, such as signals based on the MACD histogram, moving average crossings, or all at once, which makes the indicator a more convenient and functional tool for active traders.
🎨 Customizable Appearance
Customize the appearance of the MACD Sniper according to your preferences to make the analysis more convenient and visually pleasing. In the indicator settings section, you can change the colors of the buy and sell signals so that they stand out on the chart and are easily visible. For example, buy signals can be green, and sell signals can be red. These settings allow traders to adapt the indicator to their individual needs, making it more flexible and user-friendly.
🔧 How it works
The MACD Sniper indicator starts by calculating the MACD values and moving averages for a specific period in order to assess market conditions. For this, fast and slow moving averages are used, as well as a signal line, which are calculated based on the set parameters. The indicator then analyzes the MACD histogram to determine whether the difference between the fast and slow moving averages is rising or falling. Based on this analysis, buy and sell signals are generated. Additionally, the indicator uses the RSI filter to filter out false signals in overbought or oversold market conditions. The user can set the minimum number of bars between the signals and the "Wait for the opposite signal" mode for additional filtering. The indicator dynamically adjusts to changes in the market, providing relevant signals in real time.
📚 Quick guide to using the MACD Sniper
— Add the indicator to your favorites by clicking on the rocket icon. Adjust the parameters such as the length of periods for fast and slow moving averages, the type of moving average (SMA, EMA, WMA, VWMA, KAMA, HMA, ZLEMA, TEMA, ALMA, DEMA) and the length of the signal line, according to your trading style, or leave all settings as default.
— Adjust the signal filters to improve their quality and avoid false alarms
— Turn on notifications so that you don't miss important trading opportunities and don't constantly sit at the chart. This will allow you to keep abreast of all key market events and respond to them in a timely manner, without being distracted from other business.
— Use signals, they will help you determine the optimal entry and exit points of positions.
— Use the Connector for deeper analysis and verification of the effectiveness of signals, connect them to your trading strategies. This will allow you to test signals throughout your trading history and evaluate their accuracy based on historical data.
— Include the indicator in your trading strategy and run testing to see how buy and sell signals have worked in the past.
— Analyze the test results to determine how reliable the signals are and how they can improve your trading strategy. This will help you make more informed decisions and increase your trading efficiency.
