2 MA Cross Cvg Dvg Slope Overview
This indicator combines the Moving Average Convergence Divergence (MACD) and two Moving Averages (MAs) to assess market momentum and trend direction. It aims to provide insights into the strength and direction of price movements by analyzing the MACD line, MAs slopes, and MA crossovers. Instead of eyeballing the exact MA crossovers and MAs slope steepness on the chart and MACD line changes on separate panes, this indicator pixelate the overloaded information or multiple indicators interpretation into a KISS "boolean" decision making.
Key Components
MACD Line
This line represents the difference between the fast MA and slow MA. It reflects short-term price momentum relative to the long-term trend.
Moving Averages (MAs)
Two types of MAs are utilized in this indicator:
Fast MA (short-term): Often a 9-period MA or similar, which reacts quickly to price changes.
Slow MA (long-term): Typically a 21-period MA or similar, which smooths out price fluctuations and identifies the longer-term trend.
Indicator Logic
MA Crossover: The crossover of the fast MA above the slow MA suggests a bullish trend, while a crossover below indicates a bearish trend.
MA Slope Analysis: The indicator also considers the slopes of both the fast and slow MAs to determine the direction:
Both MA Positive Slope: Indicates upward momentum or bullish trend.
Both MA Negative Slope: Indicates downward momentum or bearish trend.
One MA Positive Slope, the other Negative Slope: Indicates indecision.
MACD Line: MACD Line consecutively increase means increasing positive momentum, vice versa.
Interpretation
Uptrend: When fast MA cross over slow MA. Indicator show "+" symbol at top zone with value 0.5.
Additional Uptrend Confirmation: When both MAs have positive slope. Indicator show only green bar.
Uptrend Upward Momentum: MACD Line increase when fast MA above slow MA. Indicator show "." symbol value 0.75.
Uptrend Downward Momentum: MACD Line decrease when fast MA above slow MA. Indicator show "." symbol value 0.25.
Indecision: When one of the MA has positive slope, but another MA has negative slope. Indicator showing both red and green bar.
Downtrend: When fast MA cross under slow MA. Indicator show "+" symbol at bottom zone with value 0.5.
Additional Downtrend Confirmation: When both MAs have negative slope. Indicator show only red bar.
Downtrend Upward Momentum: MACD Line increase when fast MA below slow MA. Indicator show "." symbol value -0.25.
Uptrend Downward Momentum: MACD Line decrease when fast MA below slow MA. Indicator show "." symbol value -0.75.
Combination of above multiple interpretation can further derive different signal for Trend Starts, Trend Continuous, and Trend Reversals.
Usage
This indicator is valuable for traders seeking to:
Identify entry and exit points based on single or multiple combination of MAs and MACD Line signals.
Confirm trend direction using MAs cross over or cross under spotted easily with the "+" symbol above 0 or below 0.
Double confirm the trend based on two MAs align slope direction.
Understand momentum shifts and potential trend reversals with an easy 4 different dots at -0.75, -0.25, 0.25, and 0.75.
Conclusion
By combining MACD Line analysis with Moving Average slopes and crossovers, this indicator offers a comprehensive approach to assessing market momentum and trend direction. It provides clear signals for traders to make informed decisions on when to enter or exit positions, enhancing overall trading strategy effectiveness without the need of referring to multiple chart or zoom in and out of the price chart to identify the crossover and slope direction.
"MACD背离" için komut dosyalarını ara

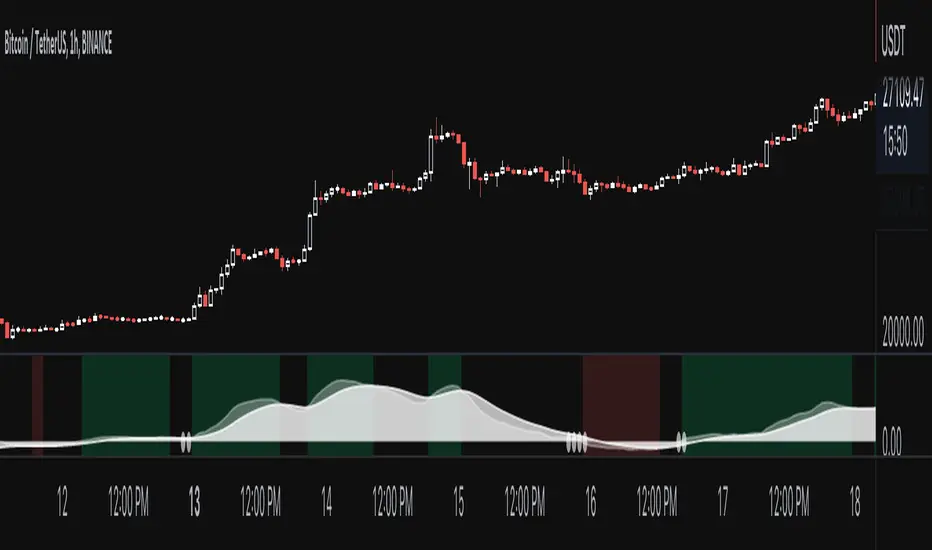
CAPACE MARKETThis custom indicator combines the Moving Average Convergence Divergence (MACD) and the Relative Strength Index (RSI) into a single trading tool. It calculates the MACD and RSI values, then averages these two indicators to create a composite line. This average line is intended to capture the momentum and relative strength of the market simultaneously, potentially offering a more nuanced view of market conditions.
Key features of the indicator include:
Visualization of MACD and RSI Lines: It plots the MACD and RSI values as separate lines on the chart, allowing traders to see the behavior of each indicator clearly.
Average Line: A line representing the average of the MACD and RSI indicators is plotted, providing a synthesized view of both momentum and strength.
Entry Points Indication: The indicator uses red dots to mark the points where the average line crosses over or under the MACD or RSI lines. These intersections are meant to signal potential entry points for traders.
Market Condition Highlighting: The background color changes based on whether the average line is above or below zero. A green background suggests a positive market condition (bullish), while a red background indicates a negative market condition (bearish).
This tool aims to offer traders an integrated perspective by combining the insights of both MACD and RSI, potentially aiding in the identification of entry and exit points as well as the overall market sentiment.

MACD_RSI_trend_followingINFO:
This indicator can be used to build-up a strategy for trading of assets which are currently in trending phase.
My preference is to use it on slowly moving assets like GOLD and on higher timeframes, but practice may show that we find more usefull cases.
This script uses two indicators - MACD and RSI, as the timeframe that those are extracted for is configurable (defaults with the Chart TF, but can be any other selected by the user).
The strategy has the following simple idea - buy if any if the conditions below is true:
The selected TF MACD line crosses above the signal line and the TF RSI is above the user selected trigger value
The selected TF MACD line is above the signal line and the TF RSI crosses above the user selected trigger value
Once we're in position we wait for the selected TF MACD line to cross below the signal line, and then we set a SL at the low of that bar
DETAILS and USAGE:
In the current implementation I find two possible use cases for the indicator:
as a stand-alone indicator on the chart which can also fire alerts that can help to determine if we want to manually enter/exit trades based on them
can be used to connect to the Signal input of the TTS (TempalteTradingStrategy) by jason5480 in order to backtest it, thus effectively turning it into a strategy (instructions below in TTS CONNECTIVITY section)
In the example below we see a position opened at the bar after the buy indicator from the script has been triggered, and then later after the SL indicator from the script has been triggered a SL has been set on the lower wick of the closing candle, and the position eventually got closed once the price hit that level. Note that most of the drawing on the example snapshot below are from the TTS indicator following the buy/sell/SL conditions themseves:
Trading period can be selected from the indicator itself to limit to more interesting periods.
Arrow indications are drawn on the chart to indicate the trading conditions met in the script - green arrow for a buy signal indication and orange for LTF crossunder to indicate setting of SL.
SETTINGS:
Leaving all of the settings as in vanilla use case, as both the MACD and RSI indicator's settings follow the default ones for the stand-alone indicators themselves.
The start-end date is a time filter that can be extermely usefull when backtesting different time periods.
Pesonal preference is using the script on a D/W timeframe, while the indicator is configured to use Monthly chart.
The default value of the RSI filter is left to 50, which can be changed. I.e. if the RSI is above 50 we have a regime filter based on the MACD criteria.
EXTERNAL LIBRARIES:
The script uses a couple of external libraries:
HeWhoMustNotBeNamed/enhanced_ta/14 - collection of TA indicators
jason5480/tts_convention/3 - more details about the Template Trading Strategy below
I would like to highly appreciate and credit the work of both HeWhoMustNotBeNamed and jason5480 for providing them to the community.
TTS SETTINGS (NEEDED IF USED TO BACKTEST WITH TTS):
The TempalteTradingStrategy is a strategy script developed in Pine by jason5480, which I recommend for quick turn-around of testing different ideas on a proven and tested framework
I cannot give enough credit to the developer for the efforts put in building of the infrastructure, so I advice everyone that wants to use it first to get familiar with the concept and by checking
by checking jason5480's profile www.tradingview.com
The TTS itself is extremely functional and have a lot of properties, so its functionality is beyond the scope of the current script -
Again, I strongly recommend to be thoroughly epxlored by everyone that plans on using it.
In the nutshell it is a script that can be feed with buy/sell signals from an external indicator script and based on many configuration options it can determine how to execute the trades.
The TTS has many settings that can be applied, so below I will cover only the ones that differ from the default ones, at least according to my testing - do your own research, you may find something even better :)
The current/latest version that I've been using as of writing and testing this script is TTSv48
Settings which differ from the default ones:
from - False (time filter is from the indicator script itself)
Deal Conditions Mode - External (take enter/exit conditions from an external script)
🔌Signal 🛈➡ - MACD_RSI_trend_following: 🔌Signal to TTSv48 (this is the output from the indicator script, according to the TTS convention)
Sat/Sun - true (for crypto, in order to trade 24/7)
Order Type - STOP (perform stop order)
Distance Method - HHLL (HigherHighLowerLow - in order to set the SL according to the strategy definition from above)
The next are just personal preferenes, you can feel free to experiment according to your trading style
Take Profit Targets - 0 (either 100% in or out, no incremental stepping in or out of positions)
Dist Mul|Len Long/Short- 10 (make sure that we don't close on profitable trades by any reason)
Quantity Method - EQUITY (personal backtesting preference is to consider each backtest as a separate portfolio, so determine the position size by 100% of the allocated equity size)
Equity % - 100 (note above)

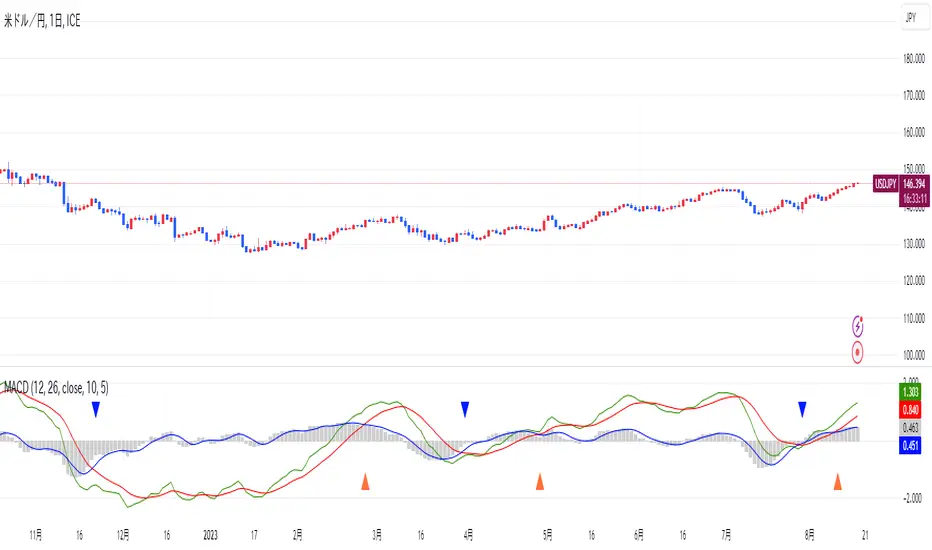
3x MTF MACD v3.0MACD's on 3 different Time Frames
Indicator Information
- Each Time Frame shows start of Trend and end of trend of the MACD vs the Signal Cross
- They are labled 1,2,3 with respective up or down triangle for possible direction.
User Inputs
- configure the indicator by specifying various inputs. These inputs include colors for bullish
and bearish conditions, the time frame to use, whether to show a Simple Moving Average
(SMA) line, and other parameters.
- Users can choose time frames for analysis (like 30 minutes, 1 hour, etc.)
but they must be in mintues.
- The code also allows users to customize how the indicator looks on the chart by providing
options for position and color.
Main Calculations
- The script calculates the Simple Moving Average (SMA) based on the user-defined time
frame.
- It then determines the color of the plot (line) based on certain conditions, such as whether
the SMA is rising or falling. These conditions help users quickly identify market trends.
Label Creation
- The code creates labels that can be displayed on the chart.
These labels indicate whether there's a bullish or bearish signal.
Level Detection
- The script determines and labels key levels or points of interest in the chart based on
certain conditions.
- It can show labels like "①" and "▲" for bullish conditions and "▼" for bearish conditions.
Table Display
- There's an option to show a table on the chart that displays information about the MACD
indicator Chosen and the NUmber Bubble assocated with that time frame
- The table can include information like which time frame is being analyzed, whether the SMA
line is shown, and other relevant data.
Plotting on the Chart
- The script plots the Simple Moving Average (SMA) on the chart. The color of this line
changes based on the calculated trend conditions.
ATR (Average True Range)
- The script also plots the Average True Range (ATR) on the chart. ATR is used to measure
market volatility.
"In essence, this script is a highly customizable MACD and SMA indicator for traders. It assists traders in comprehending market trends, offering insights into different MACD cycles concerning various timeframes.
Users can configure it to match their trading strategies, and it presents information in a user-friendly manner with colors, labels, and tables.
This simplifies market analysis, allowing traders to make more informed decisions without the distraction of multiple indicators."

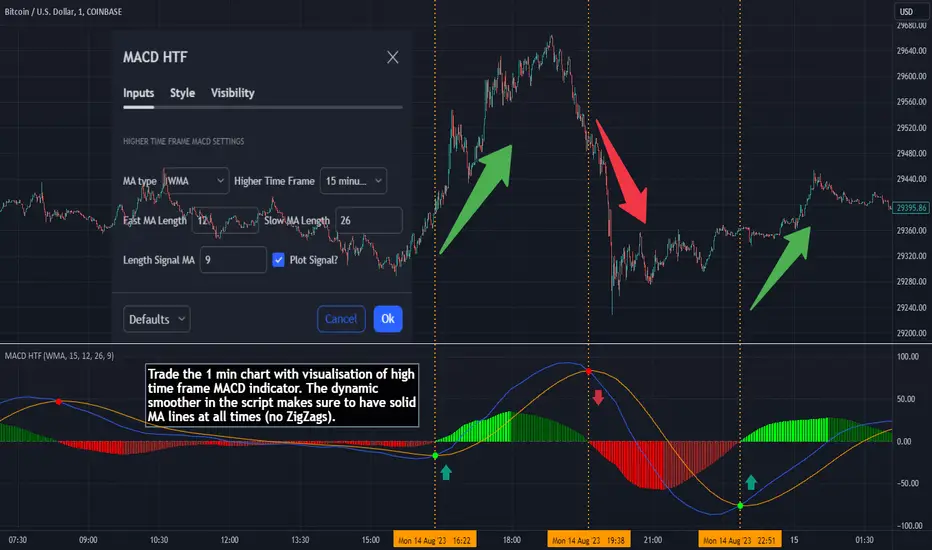
MACD HTF - Dynamic SmoothingEnhancing Your 1-Minute Trades with Dynamic HTF MACD Smoothing
Ever found yourself glued to a 1-minute chart, trying to catch every minor price movement, yet feeling like you're missing the bigger picture? Picture this: a solid MACD line on that chart, dynamically smoothed from a higher timeframe (HTF). This tool offers two significant benefits over other existing HTF MACD indicators:
User-Friendly Interface: No need to manually adjust input parameters every time you switch to a different timeframe.
Smooth Charting: Say goodbye to the zigzag lines that often result from plotting higher time frame resolutions on a lower time frame.
Understanding the MACD
The Moving Average Convergence Divergence (MACD) is one of the most widely used and trusted technical indicators in the trading community. Invented by Gerald Appel in the late 1970s, the MACD helps traders understand the relationship between two moving averages of a security's price. It consists of the MACD line (difference between a 12-period and 26-period Exponential Moving Average) and the Signal line (9-period EMA of the MACD line). When the MACD line crosses above the Signal line, it's viewed as a bullish signal, and vice versa. The difference between the two lines is represented as a histogram, providing insights into potential buy or sell opportunities.
Features of the Dynamic HTF MACD Smoothing Script
Time Frame Flexibility: Choose a higher timeframe to derive MACD values and apply dynamic smoothing to your current timeframe.
Multiple Moving Averages: The script supports various MA types like EMA, SMA, DEMA, TEMA, WMA and HMA.
Alerts: Get real-time alerts for MACD crossover and crossunder.
Customizability: From the type of moving average to its length, customize as per your strategy.
Visual Indicators: Clearly plots signals when MACD crossover or crossunder occurs for potential entries.
At last
A massive shoutout to all the wizards and generous contributors in the community! You inspire innovations and new tools, paving the path forward. Here's to a community where we learn and build together. Cheers to collective growth!
TARVIS Labs - Bitcoin Macro Bottom/Top SignalsSCRIPT DESCRIPTION
This is a script specifically written to help provide indicators from a macro view. This script is best run on the 1 day interval on Bitstamp's $BTCUSD chart. It helps indicate when to accumulate bitcoin, and when its in a bull run when there are local tops, strong top warnings, and a signal to exit a bull run. This is described further below.
If you don't have interest in trading on the way to the top I suggest turning off the following indicators in the settings of the indicator:
- Opportunity To Buy Back In Indicator
- Local Top Near Bull Run Top Indicator
ACCUMULATION ZONE INDICATOR - LIGHT GREEN
Description
When we look at the history of Bitcoin every bottom has crossed below the 100 week EMA. Once it does its accompanied by hash ribbon cross with miner capitulation. After that is the prime time to accumulate as theres a clearer signal the bottom is in. Specifically, a signal to look for is the 14 day MACD/signal cross and the 14 day MACD continuing to stay above the signal until the price returns above the 100 week EMA. This is prime accumulation territory.
Strategy for Usage
A good strategy to use when accumulating the bottom is dollar-cost averaging over a 30 day period. The accumulation zone can last longer than 30 days but 30 days is a good range of time to DCA.
STRONG BUY IN ACCUMULATION ZONE INDICATOR - DARK GREEN
Description
We can add to the bottoming signal by looking for post-downtrend reversals inside the bottoming signal. We do this by using a 9/19 daily cross.
Strategy for Usage
These post-downtrend reversals can potentially provide better targeted days for accumulation than the broader bottoming signal and can be used to add more on that day than on an average day for the dollar cost average strategy. Say for example, use 1/3 of funds on these days rather than 1/30th.
OPPORTUNITY TO BUY BACK IN INDICATOR - BLUE
Description
When the 1d 18 EMA > 1d 63 EMA and the 12/52 1d crosses. These together provide good buy opportunities to buy bitcoin.
Strategy for Usage
If you happen to find yourself out of the market from your own TA or a trade, this signal can provide a buy opportunity to reenter the market if you're out of it.
BULL RUN LOCAL TOP INDICATOR - ORANGE
Description
We will similarly use the 100 week EMA to determine trend reversal into a bull run. When we see the 100 week EMA uptrending, we can begin to look for local tops using the 9/19 daily MACD/signal bearish cross along with the 12 EMA having a negative slope, which could be the beginning signal for a local top.
Strategy for Usage
This is a rather light indicator, but can be used in tandem with your own technical analysis to determine if you want to reenter after you exit from its signal.
LOCAL TOP NEAR BULL RUN TOP INDICATOR - RED
Description
When the 100 week EMA is in an uptrend we can look for significant loss of momentum in order to determine if a local top is in near a bull run top. Similar to the Bull Run Local Top Indicator, this strategy uses a MACD/signal cross but instead uses the 30/65 day EMAs.
Strategy for Usage
Ideally the right strategy to use here is to exit the market when this indicator starts. When the indicator ends if the "End of Bull Run Indicator" is not showing on the chart you can buy back into the market.
TOP IS LIKELY IN INDICATOR
Description
When the 100 week EMA is in a very strong uptrend and the 9/19 weekly MACD/signal bearish cross occurs, and the 63 EMA begins to downtrend.
Strategy for Usage
This signal typically accompanies the "Local Top Near Bull Run Top Indicator" therefore if you're following the strategy you would likely already be out of the market, but if you're not and this signal fires its a strong signal the top is in and we're likely going to start seeing a strong retrace. This is typically right before we see the "End of Bull Run Indicator". There is only one occurrence where it wasn't followed by a large drop & the "End of Bull Run Indicator" and that was in the 2017 bull run where there were many strong retracements post local top. The likelihood we see that again is low, but if it were to happen you can buy back into the market when the "Top is Likely In Indicator" and the "Local Top Near Bull Run Top Indicator" are not firing.
TOP IS LIKELY IN INDICATOR
Description
When the 100 week EMA is in a strong uptrend and the 9/19 weekly MACD/signal bearish cross occurs, and the 63 EMA begins to downtrend.
Strategy for Usage
This signal typically accompanies the "Local Top Near Bull Run Top Indicator" therefore if you're following the strategy you would likely already be out of the market, but if you're not and this signal fires its a strong signal the top is in and we're likely going to start seeing a strong retrace. This is typically right before we see the "End of Bull Run Indicator". There is only one occurrence where it wasn't followed by a large drop & the "End of Bull Run Indicator" and that was in the 2017 bull run where there were many strong retracements post local top. The likelihood we see that again is low, but if it were to happen you can buy back into the market when the "Top is Likely In Indicator" and the "Local Top Near Bull Run Top Indicator" are not firing.
END OF BULL RUN INDICATOR
Description
When the 100 week EMA is in an uptrend and the 1d 18 EMA crosses the 1d 63 EMA.
Strategy for Usage
When the 100 week EMA is a strong uptrend and the 18/63 cross occurs the top is very likely in. It has occurred in every bull run top leading to the bear market.

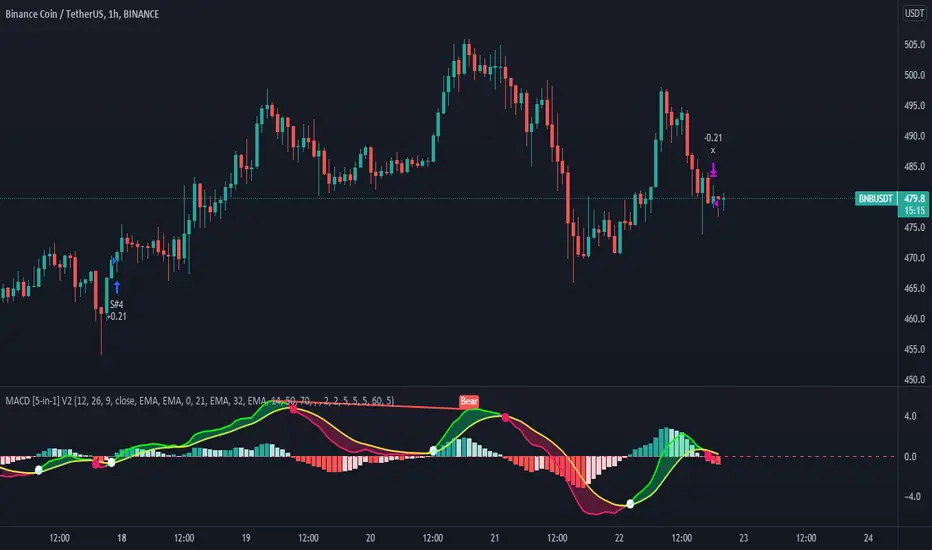
MACD 5 iN 1 [Pro-Tool]introducing MACD Which has different indicators inside,
And not only that, five different strategies have also been included in this indicator.
Strategy №1:👉 MACD Crossover Signal Line
Strategy №2:👉 MACD Crossover + MACD Overbought Section (for ignore false Crossover signals)
Strategy №3:👉 MACD Crossover + Market Close should b greater tha MOVING AVERAGE
Strategy №4:👉 MACD Crossover + Market Close should b greater tha MOVING AVERAGE ZONE
Strategy №5:👉 MACD Crossover + RSI Close should b greater tha 50 Level (or whatever level you choose)
also 5 types of MOVING AVERAGE you can choose
1: Simple Moving Average ( SMA )
2: Exponential Moving Average ( EMA )
3: Weighted Moving Average ( WMA )
4: Volume Weighted Moving Average ( VWMA )
5: Relative Moving Average (RMA)
and you can customize MACD Colors + Widths + Signals and MACD lines, and also can Hide or Unhide Histogram / Cross Sign / MACD Zone Color
hope so you like it, 🥰
Investing and trading in cryptocurrencies is very risky, as anything can happen at any time.
***NOT FINANCIAL, LEGAL, OR TAX ADVICE! JUST OPINION! I AM NOT AN EXPERT! I DO NOT GUARANTEE A PARTICULAR OUTCOME I HAVE NO INSIDE KNOWLEDGE! YOU NEED TO DO YOUR OWN RESEARCH AND MAKE YOUR OWN DECISIONS! THIS IS JUST EDUCATION & ENTERTAINMENT! USE ALTCOIN DAILY AS A STARTING OFF POINT!
[fareid] Quick Backtest Framework█ OVERVIEW
This Framework allows Pine Coders to quickly code Study() based signal/strategy and validate its viability before proceed to code with more advance/complex customized rules for entry, exit, trailstop, risk management etc..
This is somewhat an upgraded version of my earlier personal template with different strategy used, cleaner code
and additional features.
█ USE CASES
- You have an idea for trade signal and need a quick way to verify its potential before writing lengthy/complicated code
- You found a study script for trading signal in public library and want to validate it profitability with minimum effort before including it in your trading playbook
█ FEATURES
- Alert: Ready to use alert function based on signals from your custom indicator.
- Visual Backtest: Auto-plot entry, stop-loss and take profit for simple strategy performance analysis
- Backtest Statistic: Provide basic key metrics based on backtest strategy
- BTE External Signal Protocol: Ready to use code that will supply required state to PineCoders Backtesting & Trading Engine if you wish to have more advance and sophisticated backtesting engine
Notes: All of the above features have On/Off toggle
█ Description & How To Use
This Framework consist of 5 Modules but you only need to edit the first 2 Modules:
Module1: Indicator
Module2: Framework Input Protocol
Module3: Alert
Module4: Backtest
Module5: Backtest & Trading Engine
Tips: The source-code includes collapsible block by module for easy navigating
Module1: Indicator:
-----------------------------------------------------------------------------------
Main Module. Place custom indicator input parameter/calculation/indicator plotting here
Sample Strategy: Double MACD Crossover
MACD Signal: 1st MACD Cross above signal line indicate Buy Signal
1st MACD Cross below signal line indicate Sell Signal
MACD Filter: 2nd MACD is above 0 line indicate Uptrend
2nd MACD is below 0 line indicate Downtrend
Module2: Framework Input Protocol:
-----------------------------------------------------------------------------------
Use this module to connect main indicator/signal calculated in Module1 to the rest of the framework's module
4 variables needed to be defined here:
1. Uptrend
2. Dntrend
3. BuySignal
4. SellSignal
i'm not sure how to place a code snippet here to show you example so in the source code i already put a comment in Module2 on which part u need to edit. I hope its pretty simple to use.
Module3: Alert Module Description:
-----------------------------------------------------------------------------------
As long as the variables in Module2 properly defined, the alert module is ready to use without any further modification.
Input:
Enable Alert --> Enable TV's alert and plot signal to chart
Alert Type --> Set to take Buy only, Sell only or Both alert
Module4: Backtest Module Description:
-----------------------------------------------------------------------------------
As long as the variables in Module2 properly defined, the backtest module is ready to use without any further modification.
Input:
Backtest Stat --> Enable Backtest Statistic Label
Backtest Visual --> Enable Backtest visual simulation
Backtest Type --> Set to take Buy only or Sell only or both
SL Type -->
ATR : Set SL in ATR times Multiplier below entry price
Fixed : Set SL in fixed point below entry point (in 'Dollar'). e.g. for Stocks -> 0.5 equals to 50cent while for EURUSD currency -> 0.005 equal to 50 pips
HiLo Bar: Set SL at highest/lowest wick of previous bar plus/minus Fixed point. e.g. EURUSD HiLo=3 and Fixed Point = 0.0005, buy trade will place SL 5 Pips below lowest of previous 3 bar
SL ATR Multi --> Set Lookback Period used for SL's ATR calculation
SL ATR Multi --> Set ATR Multiplier for SL
SL Fixed --> Set Fixed Level for SL
SL Bar --> Set Number of previous bar to check for SL placement
TP RR Ratio --> Set TP based on RR multiplier. e.g. 2 means TP level will be twice further from entry point compared to Entry-SL distance.
Notes: The point is for preliminary testing, so it only supports 1 trade at a time and no Trailing Stop
Module5: Backtest & Trading Engine Description:
-----------------------------------------------------------------------------------
As long as the variables in Module2 properly defined, the Pinecoders BTE module is ready to use without any further modification.
Input:
External Signal Protocol --> Set ESP State to send to "Backtesting & Trading Engine "
Signal With Filter --> Use this to send entry signal that already filtered by this study indicator (without stoploss level)
Signal Without Filter --> Use this to send raw entry signal that are NOT YET FILTERED by this study indicator (without stoploss level)
Signal and Stop With Filter --> Use this to send entry signal WITH StopLoss that already filtered by this study indicator (with stoploss level)
Signal and Stop Without Filter --> Use this to send raw entry signal WITH StopLoss that are NOT YET FILTERED by this study indicator (with stoploss level)
Notes: Backtesting & Trading Engine already have built-in Filter, Entries and Stop Level. e.g. Unselect all their filter state if only want to use custom filter and make sure send Signal with Filter (with or without SL level)
█ DISCLAIMER:
This framework main objective is to create my personal indicator template so that i just have to modify the indicator module for preliminary testing in future.
The sample strategy included are for educational purpose only. Use at your own risk
credit: LucF/PineCoders for a lot of his scripts that i use as a guide to complete this

macd xoverThe MACD XOver indicator was developed by John Bruns to predict the price point at which MACD Histogram will reverse the direction of its slope.
The indicator is plotted one day ahead into the future, allowing, if your strategy depends on MACD Histogram, to predict its reversal point for tomorrow (or the next bar in any timeframe). If the closing price tomorrow is above the value of this indicator, then MACD Histogram will tick up. If the closing price tomorrow is below the value of this indicator, then MACD Histogram will tick down. This is especially useful on the charts of the longer timeframes and when using the Impulse system whose color depends in part on the slope of MACD Histogram.
Use the same values as the MACD Combo which you want to anticipate. If you use the default values, then accept the values below.
Parameters:
MACD_Short_Period(12) – The short EMA for the MACD calculation;
MACD_Long_Period (26) – The long EMA for the MACD calculation;
MACD_Smoothing_Period (9) – The smoothing value for the Signal line;
Time_Ratio (1) – The default here is set to 5 (weekly)

Heiken Ashi zero lag EMA v1.1 by JustUncleLI originally wrote this script earlier this year for my own use. This released version is an updated version of my original idea based on more recent script ideas. As always with my Alert scripts please do not trade the CALL/PUT indicators blindly, always analyse each position carefully. Always test indicator in DEMO mode first to see if it profitable for your trading style.
DESCRIPTION:
This Alert indicator utilizes the Heiken Ashi with non lag EMA was a scalping and intraday trading system
that has been adapted also for trading with binary options high/low. There is also included
filtering on MACD direction and trend direction as indicated by two MA: smoothed MA(11) and EMA(89).
The the Heiken Ashi candles are great as price action trending indicator, they shows smooth strong
and clear price fluctuations.
Financial Markets: any.
Optimsed settings for 1 min, 5 min and 15 min Time Frame;
Expiry time for Binary options High/Low 3-6 candles.
Indicators used in calculations:
- Exponential moving average, period 89
- Smoothed moving average, period 11
- Non lag EMA, period 20
- MACD 2 colour (13,26,9)
Generate Alerts use the following Trading Rules
Heiken Ashi with non lag dot
Trade only in direction of the trend.
UP trend moving average 11 period is above Exponential moving average 89 period,
Doun trend moving average 11 period is below Exponential moving average 89 period,
CALL Arrow appears when:
Trend UP SMA11>EMA89 (optionally disabled),
Non lag MA blue dot and blue background.
Heike ashi green color.
MACD 2 Colour histogram green bars (optional disabled).
PUT Arrow appears when:
Trend UP SMA11

MACD (The Moving Average Convergence Divergence)The Moving Average Convergence Divergence (MACD) is a momentum indicator used in technical analysis to identify trends, measure their strength, and signal potential reversals. It is calculated by subtracting the 26-period Exponential Moving Average (EMA) from the 12-period EMA, creating the MACD line. A 9-period EMA of the MACD line, known as the signal line, is then plotted to generate buy or sell signals. Positive MACD values suggest upward momentum, while negative values indicate downward momentum. Traders often watch for crossovers, divergences, and movements relative to the zero line to make informed decisions.

Adaptive Convergence Divergence### Adaptive Convergence Divergence (ACD)
By Gurjit Singh
The Adaptive Convergence Divergence (ACD) reimagines the classic MACD by replacing fixed moving averages with adaptive moving averages. Instead of a static smoothing factor, it dynamically adjusts sensitivity based on price momentum, relative strength, volatility, fractal roughness, or volume pressure. This makes the oscillator more responsive in trending markets while filtering noise in choppy ranges.
#### 📌 Key Features
1. Dual Adaptive Structure: The oscillator uses two adaptive moving averages to form its convergence-divergence line, with EMA/RMA as signal line:
* Primary Adaptive (MA): Fast line, reacts quickly to changes.
* Following Adaptive (FAMA): Slow line, with half-alpha smoothing for confirmation.
2. Adaptive MA Types
* ACMO: Adaptive CMO (momentum)
* ARSI: Adaptive RSI (relative strength)
* FRMA: Fractal Roughness (volatility + fractal dimension)
* VOLA: Volume adaptive (volume pressure)
3. PPO Option: Switch between classic MACD or Percentage Price Oscillator (PPO) style calculation.
4. Signal Smoothing: Choose between EMA or Wilder’s RMA.
5. Visuals: Colored oscillator, signal line, histogram with adaptive transparency.
6. Alerts: Bullish/Bearish crossovers built-in.
#### 🔑 How to Use
1. Add to chart: Works on any timeframe and asset.
2. Choose MA Type: Experiment with ACMO, ARSI, FRMA, or VOLA depending on market regime.
3. Crossovers:
* Bullish (🐂): Oscillator crosses above signal → potential long entry.
* Bearish (🐻): Oscillator crosses below signal → potential short entry.
4. Histogram: expansion = strengthening trend; contraction = weakening trend.
5. Divergences:
* Bullish (hidden strength): Price pushes lower, but ACD turns higher = potential upward reversal.
* Bearish (hidden weakness): Price pushes higher, but ACD turns lower = potential downward reversal.
6. Customize: Adjust lengths, smoothing type, and PPO/MACD mode to match your style.
7. Set Alerts:
* Enable Bullish or Bearish crossover alerts to catch momentum shifts in real time.
#### 💡 Tips
* PPO mode normalizes values across assets, useful for cross-asset analysis.
* Wilder’s smoothing is gentler than EMA, reducing whipsaws in sideways conditions.
* Adaptive smoothing helps reduce false divergence signals by filtering noise in choppy ranges.

MACD H4 on M15 ChartThis script displays the MACD from the H4 (4-hour) timeframe while viewing the chart in M15 (15-minute). It shows the H4 MACD line, signal line, and histogram for multi-timeframe (MTF) analysis. Use it to anticipate trend shifts on lower timeframes with confirmation from the higher timeframe MACD structure.

MACD + SMA 200 Indicator v6🔹 Overview
This advanced indicator combines MACD components with a 200-period SMA to identify high-probability trend directions. It provides:
✅ Multi-timeframe trend analysis (Fast, Slow, and Very Slow MAs)
✅ Visual alerts when the 200 SMA changes direction (bullish/bearish)
✅ Customizable display options (toggle MAs on/off individually)
✅ Clean, professional visuals with color-coded trend confirmation
Perfect for swing traders and investors who want to align with the dominant trend while avoiding false signals.
📊 Key Features
1. Triple Moving Average System
Fast MA (12-period) – Short-term momentum
Slow MA (26-period) – Medium-term trend
Very Slow MA (200-period) – Long-term trend filter (bullish/bearish market)
2. Smart Trend Detection
200 SMA Color Shift: Automatically changes color when trend reverses (green = bullish, red = bearish).
Visual Labels ("BU" / "SD"): Marks where the 200 SMA confirms a new trend direction.
3. Fully Customizable
Toggle each MA on/off (reduce clutter if needed).
Enable/disable colors for cleaner charts.
Adjustable lengths for all moving averages.
4. Built-in Alerts
🔔 "Very Slow MA Turned Green" – Signals potential bullish reversal.
🔔 "Very Slow MA Turned Red" – Signals potential bearish reversal.
🎯 How to Use This Indicator
📈 Bullish Confirmation (Long Setup)
✔ Price above 200 SMA (Very Slow MA turns green)
✔ Fast MA (12) > Slow MA (26) (MACD momentum supports uptrend)
✔ "BU" label appears (confirms trend shift)
📉 Bearish Confirmation (Short Setup)
✔ Price below 200 SMA (Very Slow MA turns red)
✔ Fast MA (12) < Slow MA (26) (MACD momentum supports downtrend)
✔ "SD" label appears (confirms trend shift)
⚙️ Settings & Customization
MA Visibility: Turn individual MAs on/off.
Colors: Disable if you prefer a minimal chart.
Alerts: Enable to get notifications when the 200 SMA changes trend.
📌 Why This Indicator?
Avoid false signals by combining MACD with the 200 SMA.
Clear visual cues make trend identification effortless.
Works on all timeframes (best on 1H, 4H, Daily for swing trades).
🔗 Try it now and trade with the trend! 🚀
📥 Get the Indicator
👉 Click "Add to Chart" and customize it to your trading style!
💬 Feedback? Let me know in the comments how it works for you!
Market DirectionThe "Market Direction" indicator combines four advanced sub-indicators to provide a comprehensive and multi-dimensional analysis of market trends, momentum, and potential reversals. This innovative approach leverages different aspects of price action, volume, and market sentiment, offering traders an in-depth view of market conditions.
1. Fractal Indicator: Multi-Scale Price Action Analysis
The Fractal Indicator identifies significant highs and lows over six different pivot lengths, offering a nuanced view of price action across multiple timeframes. By comparing distances from current closing prices to these key fractal points, the indicator determines potential trend reversals and market direction. This approach enables traders to adapt their strategies to various market conditions, capturing both short-term fluctuations and long-term trends.
2. Volume MACD Indicator: Enhanced Market Momentum
The Volume MACD Indicator goes beyond traditional MACD analysis by incorporating volume-weighted movement and the structural attributes of candlesticks (such as body length and wicks). This hybrid model offers a more comprehensive understanding of market momentum by integrating both price action and trading volume. The use of Smoothed Moving Averages (SMMA) reduces noise and ensures more stable signals, helping traders focus on sustainable trends and longer-term investment opportunities.
3. Cumulative Volume Momentum Indicator: Volume Dynamics Insight
The Cumulative Volume Momentum Indicator evaluates the momentum of cumulative buying and selling volumes, offering a clear picture of market strength and potential reversals. By comparing the relationship between open, close, high, and low prices, and applying a MACD approach to these volume dynamics, this indicator helps traders identify momentum shifts that often precede price movements. The visualization through histograms adds clarity to bullish and bearish volume momentum, enhancing decision-making in volatile markets.
4. POC-Price Momentum Indicator: Market Depth and Sentiment
The POC-Price Momentum Indicator assesses the difference between the Point of Control (POC) and closing prices, providing insights into underlying market sentiment. Positive differences indicate a buildup of upward momentum, while negative differences suggest a bearish tilt. By calculating moving averages of these differences, the indicator highlights the strength and sustainability of ongoing trends, helping traders align their strategies with the broader market direction.
Unified Rating for Confirming Market Direction
The "Market Direction" indicator consolidates the outputs of these four sub-indicators into a single, aggregated sentiment score. This score helps traders confirm the prevailing market trend by weighing the combined insights from fractal analysis, volume momentum, price action, and POC dynamics. A positive score suggests a bullish market, while a negative score indicates bearish conditions.

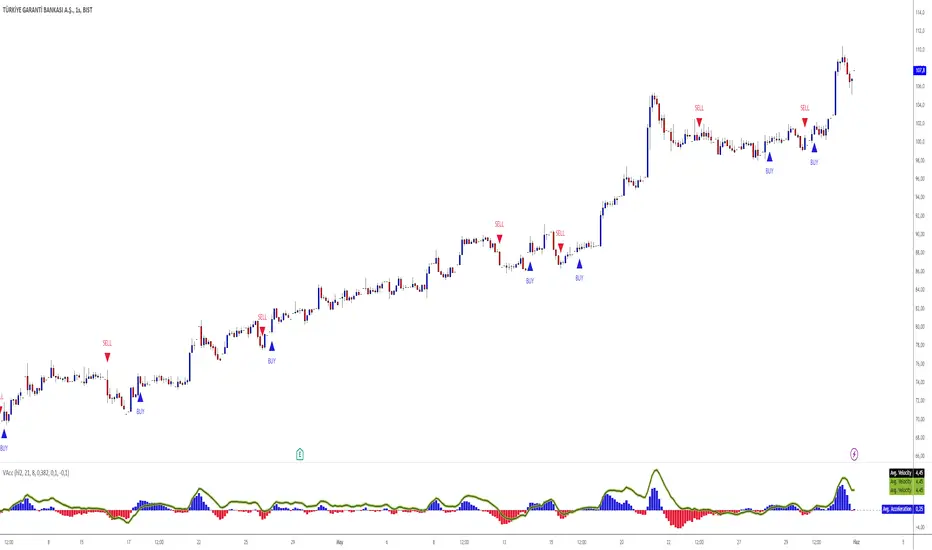
Velocity And Acceleration with Strategy: Traders Magazine◙ OVERVIEW
Hi, Ivestors and Traders... This Indicator, the focus is Scott Cong's article in the Stocks & Commodities September issue, “VAcc: A Momentum Indicator Based On Velocity And Acceleration”. I have also added a trading strategy for you to benefit from this indicator. First of all, let's look at what the indicator offers us and what its logic is. First, let's focus on the logic of the strategy.
◙ CONCEPTS
Here is a new indicator based on some simple physics concepts that is easy to use, responsive and precise. Learn how to calculate and use it.
The field of physics gives us some important principles that are highly applicable to analyzing the markets. In this indicator, I will present a momentum indicator. Scott Cong developed based on the concepts of velocity and acceleration this indicator. Of the many characteristics of price that traders and analysts often study, rate and rate of change are useful ones. In other words, it’s helpful to know: How fast is price moving, and is it speeding up or slowing down? How is price changing from one period to the next? The indicator I’m introducing here is calculated using the current bar (C) and every bar of a lookback period from the current bar. He named the indicator the VAcc since it’s based on the average of velocity line (av) and acceleration line (Acc) over the lookback period. For longer periods, the VAcc behaves the same way as the MACD, only it’s simpler, more responsive, and more precise. Interestingly, for shorter periods, VAcc exhibits characteristics of an oscillator, such as the stochastics oscillator.
◙ CALCULATION
The calculation of VAcc involves the following steps:
1. Relatively weighted average where the nearer price has the largest influence.
weighted_avg (float src, int length) =>
float sum = 0.0
for _i = 1 to length
float diff = (src - src ) / _i
sum += diff
sum /= length
2. The Velocity Average is smoothed with an exponential moving average. Now it get:
VAcc (float src, int period, int smoothing) =>
float vel = ta.ema(weighted_avg(src, period), smoothing)
float acc = weighted_avg(vel, period)
3. Similarly, accelerations for each bar within the lookback period and scale factor are calculated as:
= VAcc(src, length1, length2)
av /= (length1 * scale_factor)
◙ STRATEGY
In fact, Scott probably preferred to use it in periods 9 and 26 because it was similar to Macd and used the ratio of 0.5. However, I preferred to use the 8 and 21 periods to provide signals closer to the stochastic oscillator in the short term and used the 0.382 ratio. The logic of the strategy is this
Long Strategy → acc(Acceleration Line) > 0.1 and av(Velocity Average Line) > 0.1(Long Factor)
Short strategy → acc(Acceleration Line) < -0.1 and av(Velocity Average Line) < -0.1(Long Factor)
Here, you can change the Short Factor and Long Factor as you wish and produce more meaningful results that are closer to your own strategy.
I hope you benefits...
◙ GENEL BAKIŞ
Merhaba Yatırımcılar ve Yatırımcılar... Bu Gösterge, Scott Cong'un Stocks & Emtia Eylül sayısındaki “VAcc: Hız ve İvmeye Dayalı Bir Momentum Göstergesi” başlıklı makalesine odaklanmaktadır. Bu göstergeden faydalanabilmeniz için bir ticaret stratejisi de ekledim. Öncelikle göstergenin bize neler sunduğuna ve mantığının ne olduğuna bakalım. Öncelikle stratejinin mantığına odaklanalım.
◙ KAVRAMLAR
İşte kullanımı kolay, duyarlı ve kesin bazı basit fizik kavramlarına dayanan yeni bir gösterge. Nasıl hesaplanacağını ve kullanılacağını öğrenin.
Fizik alanı bize piyasaları analiz etmede son derece uygulanabilir bazı önemli ilkeler verir. Bu göstergede bir momentum göstergesi sunacağım. Scott Cong bu göstergeyi hız ve ivme kavramlarına dayanarak geliştirdi. Yatırımcıların ve analistlerin sıklıkla incelediği fiyatın pek çok özelliği arasında değişim oranı ve oranı yararlı olanlardır. Başka bir deyişle şunu bilmek faydalı olacaktır: Fiyat ne kadar hızlı hareket ediyor ve hızlanıyor mu, yavaşlıyor mu? Fiyatlar bir dönemden diğerine nasıl değişiyor? Burada tanıtacağım gösterge, mevcut çubuk (C) ve mevcut çubuktan bir yeniden inceleme döneminin her çubuğu kullanılarak hesaplanır. Göstergeye, yeniden inceleme dönemi boyunca hız çizgisinin (av) ve ivme çizgisinin (Acc) ortalamasına dayandığı için VAcc adını verdi. Daha uzun süreler boyunca VACc, MACD ile aynı şekilde davranır, yalnızca daha basit, daha duyarlı ve daha hassastır. İlginç bir şekilde, daha kısa süreler için VAcc, stokastik osilatör gibi bir osilatörün özelliklerini sergiliyor.
◙ HESAPLAMA
VAcc'nin hesaplanması aşağıdaki adımları içerir:
1. Yakın zamandaki fiyatın en büyük etkiye sahip olduğu göreceli ağırlıklı ortalamayı hesaplatıyoruz.
weighted_avg (float src, int length) =>
float sum = 0.0
for _i = 1 to length
float diff = (src - src ) / _i
sum += diff
sum /= length
2. Hız Ortalamasına üstel hareketli ortalamayla düzleştirme uygulanır. Şimdi bu şekilde aşağıdaki kod ile bunu şöyle elde ediyoruz:
VAcc (float src, int period, int smoothing) =>
float vel = ta.ema(weighted_avg(src, period), smoothing)
float acc = weighted_avg(vel, period)
3. Benzer şekilde, yeniden inceleme süresi ve ölçek faktörü içindeki her bir çubuk için fiyattaki ivmelenler yada momentum şu şekilde hesaplanır:
= VAcc(src, length1, length2)
av /= (length1 * scale_factor)
◙ STRATEJİ
Aslında Scott muhtemelen Macd'e benzediği ve 0,5 oranını kullandığı için 9. ve 26. periyotlarda kullanmayı tercih etmişti. Ancak kısa vadede stokastik osilatöre daha yakın sinyaller sağlamak için 8 ve 21 periyotlarını kullanmayı tercih ettim ve 0,382 oranını kullandım. Stratejinin mantığı şu
Uzun Strateji → acc(İvme Çizgisi) > 0,1 ve av(Hız Ortalama Çizgisi) > 0,1(Uzun Faktör)
Kısa strateji → acc(İvme Çizgisi) < -0,1 ve av(Hız Ortalama Çizgisi) < -0,1(Uzun Faktör)
Burada Kısa Faktör ve Uzun Faktör' ü dilediğiniz gibi değiştirip, kendi stratejinize daha yakın, daha anlamlı sonuçlar üretebilirsiniz.
umarım faydasını görürsün...
MACD HIstgramMA signl CrossingThis indicator highlights points where the MACD's Signal and Simple Moving Average of Histogram cross as entry points.
By incorporating the Simple Moving Average of the Histogram, it aims to avoid false entries during MACD and Signal crosses when volatility is low.
However, since it employs the Simple Moving Average of the Histogram, the appearance of entry points is less frequent and lagging compared to the cross of MACD and Signal.
Rob Booker Reversal Tabs StrategyRob Booker Reversal Tabs Strategy is an updated version of Rob Bookers Reversal Tab study: Rob Booker Reversal Tabs
While the original is a Pinescript study, this version can be switched between strategy and indicator mode.
Rob Bookers script generates reversal signal based on MACD and Stochastics, it is not a true reversal system, default pyramiding value is set to 5.
Inputs determine MACD and Stochastics settings. The only additional input is the "Strategy Mode" checkbox.
This script works well on its own for some tickers, but like any reversal pattern generating scripts, traders will profit from looking at overall price action and trend strength before making a trade.
From the original:
A simple reversal pattern indicator that uses MACD and Stochastics.
Created by Rob Booker and programmed by Andrew Palladino.
Please note that I only updated the original to V5 and edited it to be a strategy, which was a grand total of 5 minutes of work. I updated it because I wanted to see how the script performs as a strategy and I'm publishing it in case others would like to use it. I take no credit whatsoever for the original and WILL take this version down if Rob Booker or his Team ask me to or decide to release their own strategy version of the original.
Check out Rob Bookers scripts and ideas on his Tradingview account: robbooker

MACD frontSide backSide + TTM Squeeze by bangkokskaterDark Mode is enabled by default for black theme
disable Dark Mode for white theme
MACD frontSide backSide
===================
an elegant, much better way to use MACD
for trend following momentum ( aka momo) style
MACD with default settings of 12/26 smoothing of 9
✔️ but without histogram
✔️ only has MACD and signal "lines"
green = frontSide momentum impulse
take longs only
red = backSide momentum impulse
take shorts only
black area = exit (once green or red is no longer showing)
or keep holding till next bigger TP
PS: credits to Warrior Trading Ross Cameron for this idea
youtu.be
TTM Squeeze
===================
white dots = incoming pump / dump (monitor for entry)
PS: credits to John Carter's TTM Squeeze & Greeny for PineScript adaptation
5 Minute Scalping StrategyTaking entrys based on the 1 minute timeframe MACD
only taking longs when all emas are in the correct order and there is a bigger than usual MACD downtick and the RSI is above 51
only taking shorts when all emas are in the opposite order and there is a bigger than usual uptick on the MACD and the RSI is bellow 49
bigger than usual ticks are defined by bollinger bands around the Macd and the ticks have to be higher than 35 and lower than -10
you can change whatever setting you like to make the strategy more profitible. pls share when you find a more profitible setting than me
the stoploss doesnt work correct if it would be hit in the same candle you enter the trade. pls share when you have a solution for this
the stratagy is profitible when i backtested it for the last month, but i dont know how it will play out in the future, so you enter the signals at your own risk

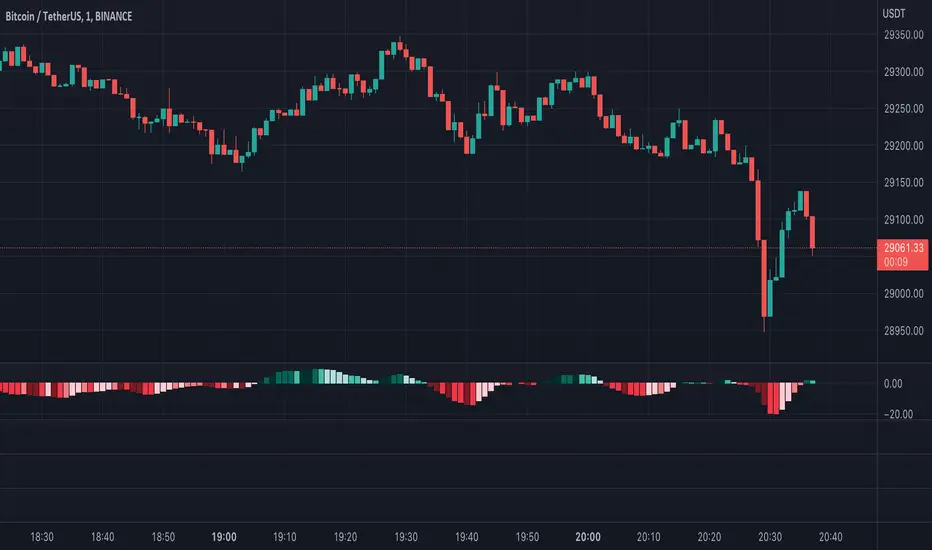
Moving Average Convergence Divergence with Rate of Change
Purpose - MACD is an awesome indicator. However, I felt I could improve the existing MACD indicator by also letting it visualize the rate of change (ROC) of the histogram (whether rate of change is increasing or decreasing - just like a derivative). By doing so, the indicator will better show the rate of change of the trend.
How It's Done - To the original MACD indicator, I have added a bit more conditional statements that automatically calculates the ROC in MACD histogram and visualizes through 8 different colors.
Interpretation - While the histogram is above 0, darker color indicates the stronger up trend, and lighter the color, weaker the up trend and potentially indicates the bears are overtaking, and vice versa for the case where the histogram is below 0.
AMACD - All Moving Average Convergence DivergenceThis indicator displays the Moving Average Convergane and Divergence ( MACD ) of individually configured Fast, Slow and Signal Moving Averages. Buy and sell alerts can be set based on moving average crossovers, consecutive convergence/divergence of the moving averages, and directional changes in the histogram moving averages.
The Fast, Slow and Signal Moving Averages can be set to:
Exponential Moving Average ( EMA )
Volume-Weighted Moving Average ( VWMA )
Simple Moving Average ( SMA )
Weighted Moving Average ( WMA )
Hull Moving Average ( HMA )
Exponentially Weighted Moving Average (RMA) ( SMMA )
Symmetrically Weighted Moving Average ( SWMA )
Arnaud Legoux Moving Average ( ALMA )
Double EMA ( DEMA )
Double SMA (DSMA)
Double WMA (DWMA)
Double RMA ( DRMA )
Triple EMA ( TEMA )
Triple SMA (TSMA)
Triple WMA (TWMA)
Triple RMA (TRMA)
Linear regression curve Moving Average ( LSMA )
Variable Index Dynamic Average ( VIDYA )
Fractal Adaptive Moving Average ( FRAMA )
If you have a strategy that can buy based on External Indicators use 'Backtest Signal' which returns a 1 for a Buy and a 2 for a sell.
'Backtest Signal' is plotted to display.none, so change the Style Settings for the chart if you need to see it for testing.

MACD Support ResistanceThis script is dynamic support & resistance based on MACD cross.
Resistance= Highest value of candle looks back when MACD crossunder.
Support= Lowest value of candle looks back when MACD crossover.
Middle line is average of Resistance and Support.
Buy when close, LSMA and SMMA crossover middle line. Please use Green Trend Line as SL or Trailing.
Sell when close, LSMA and SMMA crossunder middle line. Please use Red Trend Line as SL or Trailing.
Let me know if its useful for you in the comments and by giving Like (means a lot to me). Also share your feedback and ideas to improve this script further.
