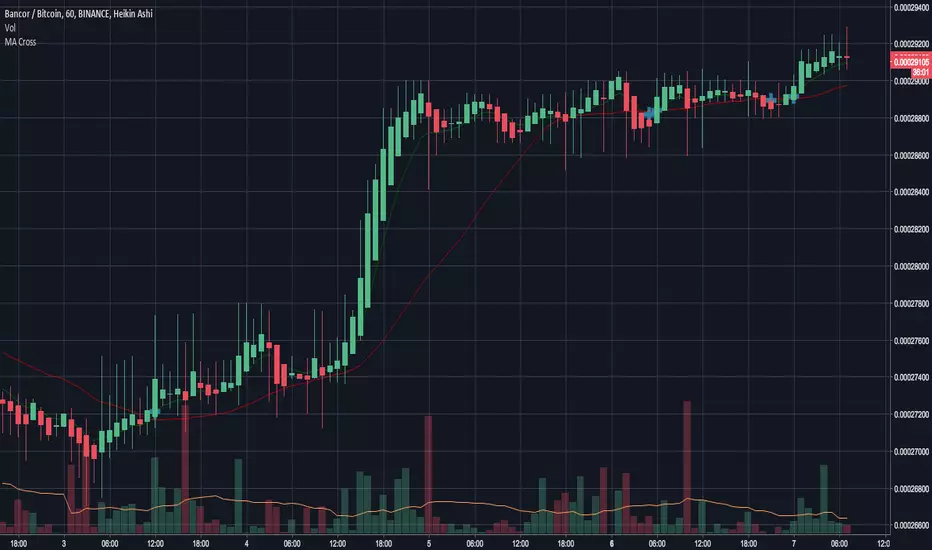
VWAP and MA Crossover SignalsDescription: The VWAP and 20 MA Crossover Indicator is a powerful trading tool designed to capitalize on trend reversals and momentum shifts. This indicator overlays two key technical analysis tools on the price chart: the Volume Weighted Average Price (VWAP) and the 20-period Moving Average (MA).
Functionality:
VWAP: Represents the average price a security has traded at throughout the day, based on volume and price. It is a measure of the market's trend and trading volume.
20 MA: Offers a smoothed average of the closing prices over the last 20 periods, providing a glimpse of the underlying trend.
Signals:
Buy Signal: Generated when the VWAP crosses above the 20-period MA, suggesting an upward momentum and a potential bullish trend reversal.
Sell Signal: This occurs when the VWAP crosses below the 20-period MA, indicating a downward momentum and a potential bearish trend reversal.
Usage: This indicator is ideal for traders focusing on intraday and swing trading strategies, providing clear visual cues for entry and exit points based on the interaction between VWAP and the 20 MA. By identifying key crossover points, traders can make informed decisions about potential bullish or bearish movements in the market.
Application: To use this indicator, simply add it to your TradingView chart setup. The buy and sell signals will be displayed directly on the chart, allowing for easy interpretation and quick action. Adjust the settings to fit your specific trading strategy or market conditions.
"MA Cross" için komut dosyalarını ara

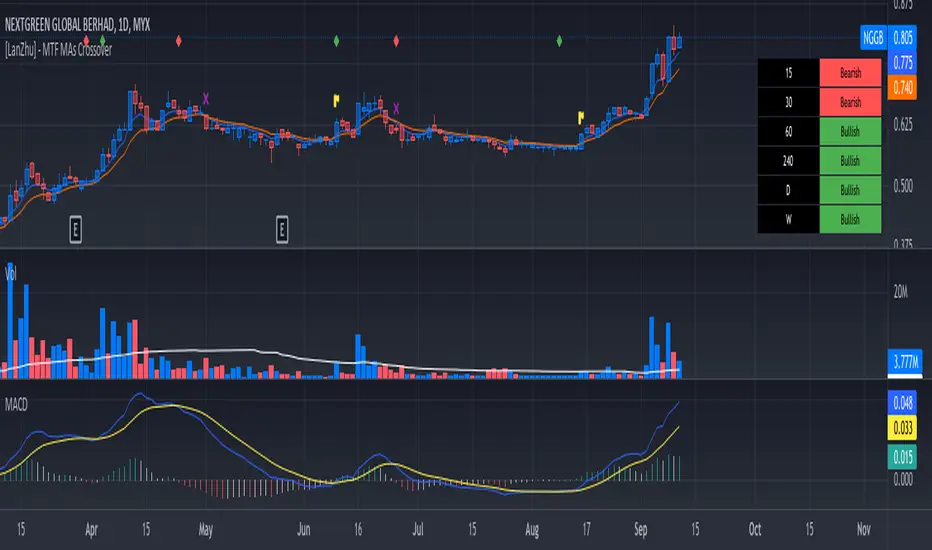
[LanZhu] - MTF MAs CrossoverCredited to ChrisMoody's script ==> _CM_Ultimate_MA_MTF_V4 :)
I have modified a bit his indicator to include more MTF fast MA and slow MA crossover. I have added table to show MTF bullish and bearish status. Fast MA above Slow MA is considered Bullish and vice versa
Kindly refer to chart to see explanation of this indicator. Hopefully you guys will enjoy :)
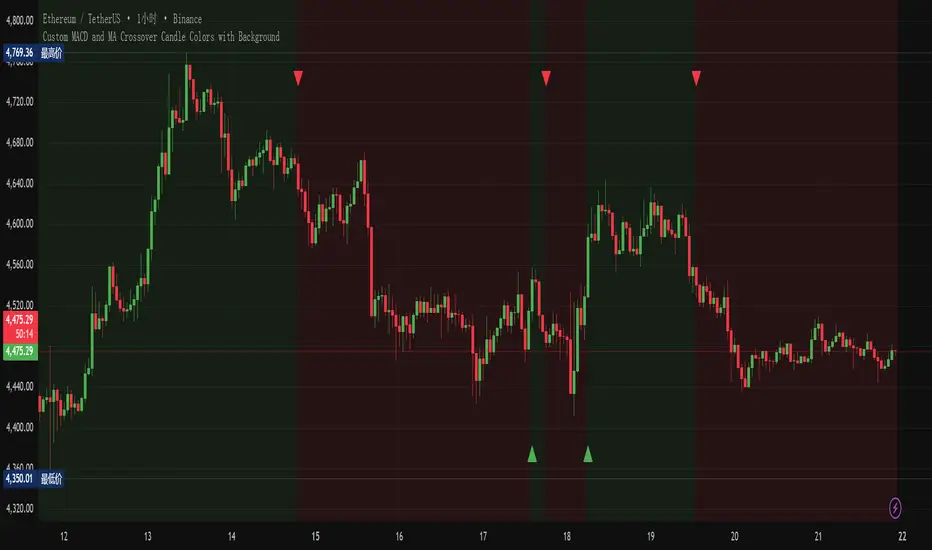
Custom MACD and MA Crossover with Background(ZWYZJNWHJ)Custom MACD and MA Crossover with Background indicator is applied to the main chart. Color blocks are marked according to when MACD crosses the 0 axis. The color of the K-line changes according to the changes in the MACD volume column. The color of the K-line will also change when it crosses multiple moving averages at the same time.
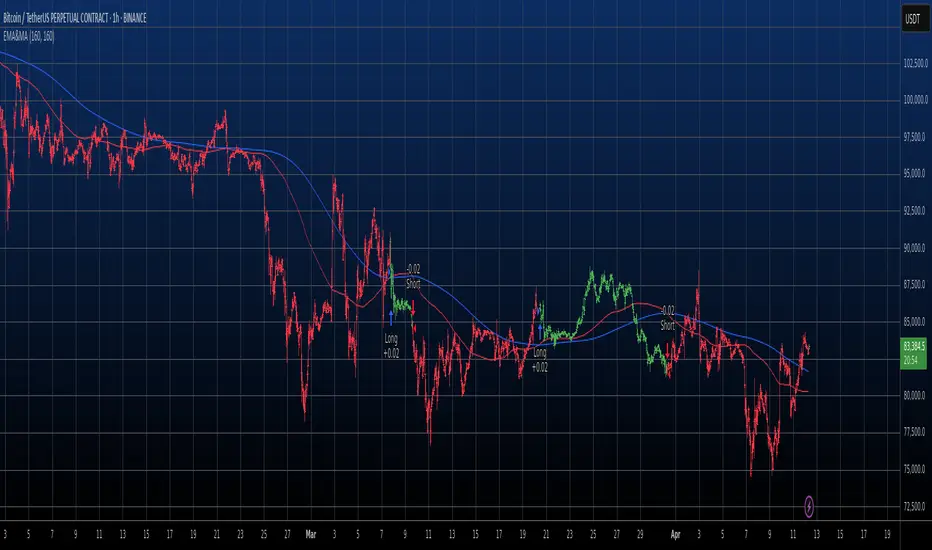
EMA & MA Crossover StrategyGuys, you asked, we did. Strategy for crossing moving averages .
The Moving Average Crossover trading strategy is possibly the most popular
trading strategy in the world of trading. First of them were written in the
middle of XX century, when commodities trading strategies became popular.
This strategy is a good example of so-called traditional strategies.
Traditional strategies are always long or short. That means they are never
out of the market. The concept of having a strategy that is always long or
short may be scary, particularly in today’s market where you don’t know what
is going to happen as far as risk on any one market. But a lot of traders
believe that the concept is still valid, especially for those of traders who
do their own research or their own discretionary trading.
This version uses crossover of moving average and its exponential moving average.
Strategy parameters:
Take Profit % - when it receives the opposite signal
Stop Loss % - when it receives the opposite signal
Current Backtest:
Account: 1000$
Trading size: 0.01
Commission: 0.05%
WARNING:
- For purpose educate only
- This script to change bars colors.
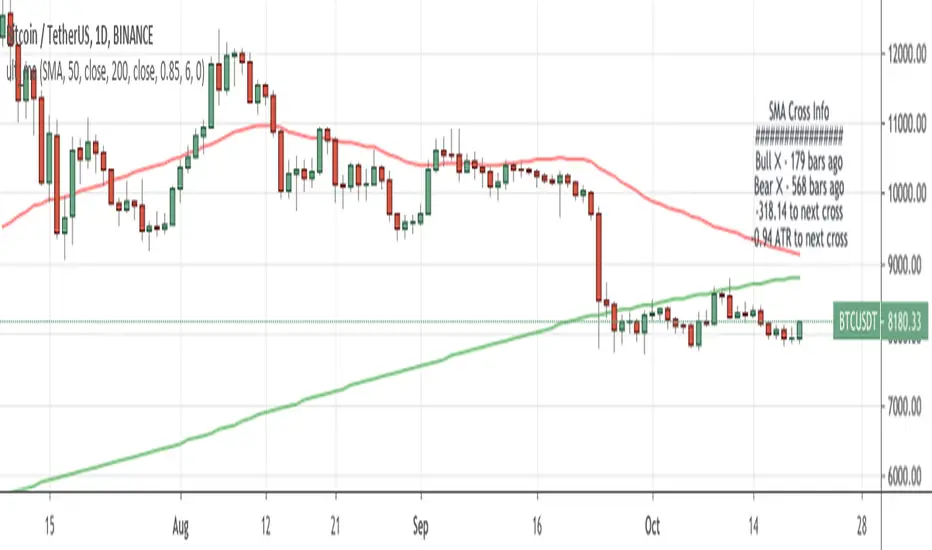
Ultimate MA Cross IndicatorContinue to experiment with new labels functionality in TradingView. Created ma cross script with 9 different types of MA wit additional information box. In that box, I included the bars passed from the previous bull/bear cross.
Also you cand find there live distance between moving averages in price and ATRs , so you track how close are you from the next close.
Do you think this concept is useful? What information do you want to see in this kind of boxes?
These ma types are included in this indicator:
Simple Moving Average ( SMA )
Exponential Moving Average ( EMA )
Weighted Moving Average ( WMA )
Arnaud Legoux Moving Average ( ALMA )
Hull Moving Average ( HMA )
Volume-weighted Moving Average ( VWMA )
Least Square Moving Average ( LSMA )
Smoothed Moving Average ( SMMA )
Double Exponential Moving Average ( DEMA )
OKX: MA CrossoverEXAMPLE Scripte from my stream , how to use OKX webhooks for create strategy on Pine with real\demo trading on your OKX account. This strategy only for test the functional forward orders to OKX. The backtest not included commisions and other.
OKX MA Crossover. This strategy generate JSONs for place orders on the exchange by alerts and webhooks.
In the script 2 function to generate entry and exit orders, and input parameters that needed for setup exchange.
Use it for test this stack and to write you own strategy for trade on the OKX Exchange.

BEST MA Cross/MACD ScreenerHello traders
Continuing deeper and stronger with the screeners' educational serie one more time
I - Concept
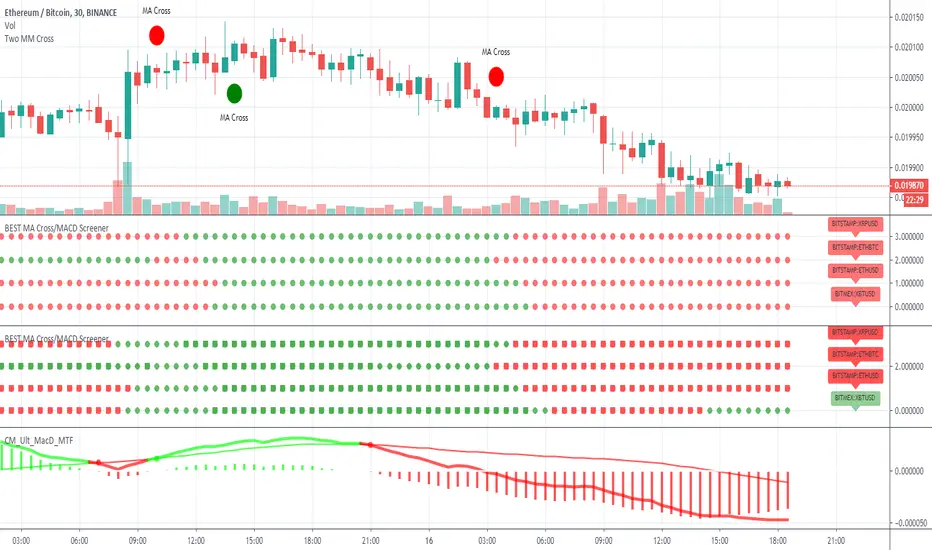
This is the first flexible screener I'm releasing. Screener detecting a convergence whenever the MACD and MM cross are giving a signal in the same direction.
Those who know me from TradingView ... are aware that I'm big on convergences. I totally think that 1 indicator isn't enough - whatever the timeframe.
But building my own convergence detection systems has been fruitful for me
II - How did I set the screener
The visual signals are as follow:
- square: MACD + MA cross convergence.
- diamond: Only MACD is selected
- circle: Only MA cross is selected
Then the colors are:
- green when bullish
- red when bearish
Example
Below, I highlighted why we see diamonds on the top screener panel. This is because I only selected the MACD filter
Cool Hacks
Don't forget that you can add the same indicator multiple times on your chart :)
Wishing you all the BEST trading
Dave
KH MA Cross, Very basic script, my first actually.
8, 21, 50 MA,
Crosses of MAs both bullish and or bearish will print a rectangle,
Enjoy,
Kurt Hennig,
28, 10, 22 Build
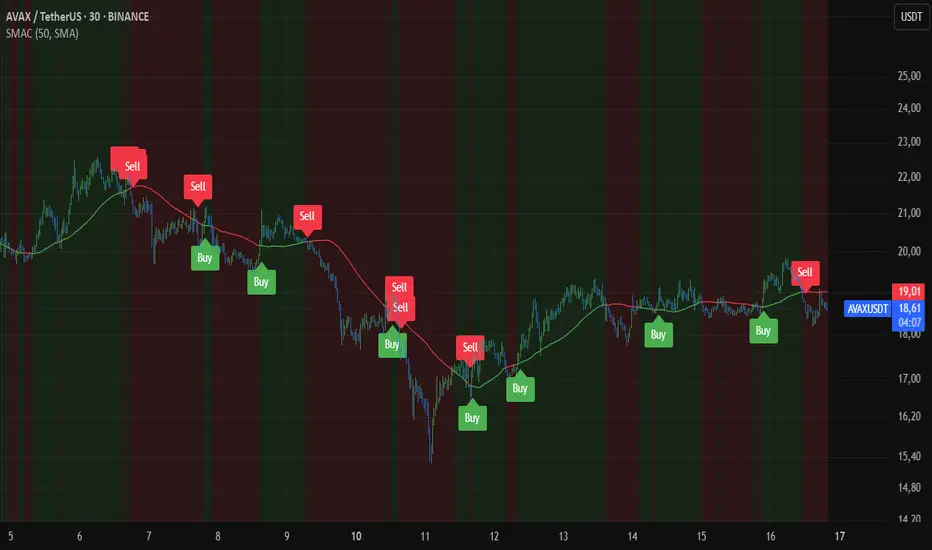
Smart MA CrossoverThe Smart MA Crossover indicator is a trend-following tool designed to help traders identify high-probability buy and sell signals based on a dynamic moving average and volume confirmation.
This indicator allows traders to customize the moving average type (SMA, EMA, HMA, WMA, VWMA, SMMA, or VWAP) while incorporating an ATR-based filter for better signal clarity.
How It Works
The script analyzes price movements in relation to a selected moving average and volume conditions to generate trend-based trade signals:
🟢 Buy Signal:
- Price is trading above the moving average for at least two bars.
- A sudden upward momentum is detected (price > open * 1.005).
- Volume is higher than the 50-period SMA of volume.
- The price was trading below the moving average three bars ago.
🔴 Sell Signal:
- Price is trading below the moving average for at least two bars.
- A sudden downward movement is detected (price < open * 0.995).
- Volume is higher than the 50-period SMA of volume.
- The price was trading above the moving average three bars ago.
- When these conditions are met, a label appears on the chart, marking the potential trade signal.
Key Features
- Customizable Moving Averages – Choose between SMA, EMA, HMA, WMA, VWMA, SMMA, or VWAP.
- Dynamic Trend Detection – Moving average color changes based on trend direction.
- Volume Confirmation – Avoid false signals by filtering trades using SMA-based volume analysis.
- ATR-Based Signal Placement – Labels are positioned dynamically based on ATR values to improve visibility.
- Background Trend Highlighting – The background changes color depending on whether price is above (green) or below (red) the moving average.
- Alerts for Buy & Sell Signals – Get real-time notifications when a trade signal is generated.
How to Use
- This indicator is best suited for trend-following strategies and works across different markets, including stocks, forex, and crypto.
- It can be used on multiple timeframes, but traders should combine it with additional analysis to refine trade decisions.
- ATR-based signal placement ensures that buy/sell labels do not clutter the chart.
Important Notes
- This indicator does not predict future price movements—it is a trend-based tool meant to assist with trade decisions.
- No financial advice – Always use risk management when trading.
- TradingView users who do not read Pine Script can still fully utilize this script thanks to clear labels and alerts.
Versatile MA Cross [Lysergik][Dark Mode]An easy to use MA-Cross that is easily configured for any kind of TA scenario
v1.0
Features:
- 7-period MA Prediction
- Individually configurable MA types
- Optional dark-mode and custom colors for quick adaptation to your custom chart appearance
- Fill color between MA's for support / resistance clouds
- Comes with with four optional presets as well as the custom mode
Dark Mode On (top) || Dark Mode Off (bottom)

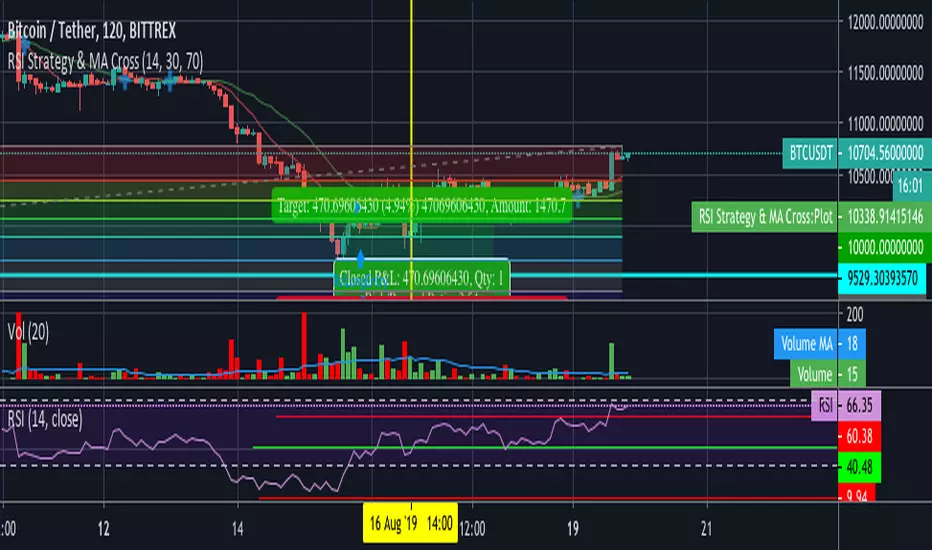
RSI Strategy & MA CrossCombination of two strategy.
MA Cross strategy is using 2 sma at 9 & 21. It can be configured through the source code.
RSI strategy to decide whether the stock/crypto is currently overbought/oversold.
Useful for quick entry and exit trade.

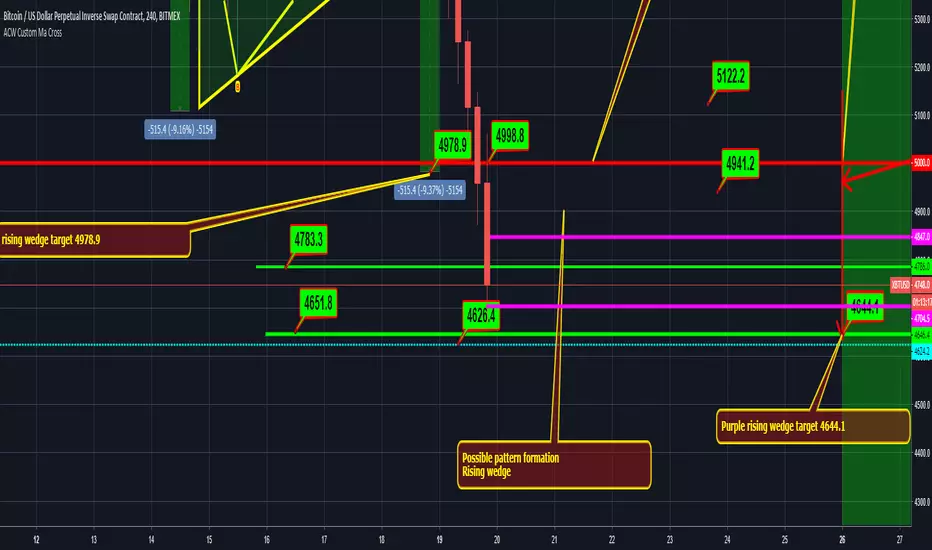
ACW Custom Ma Cross SHORT and CLOSEACW Custom Ma Cross SHORT and CLOSE
Optimized for alpha capital wealth


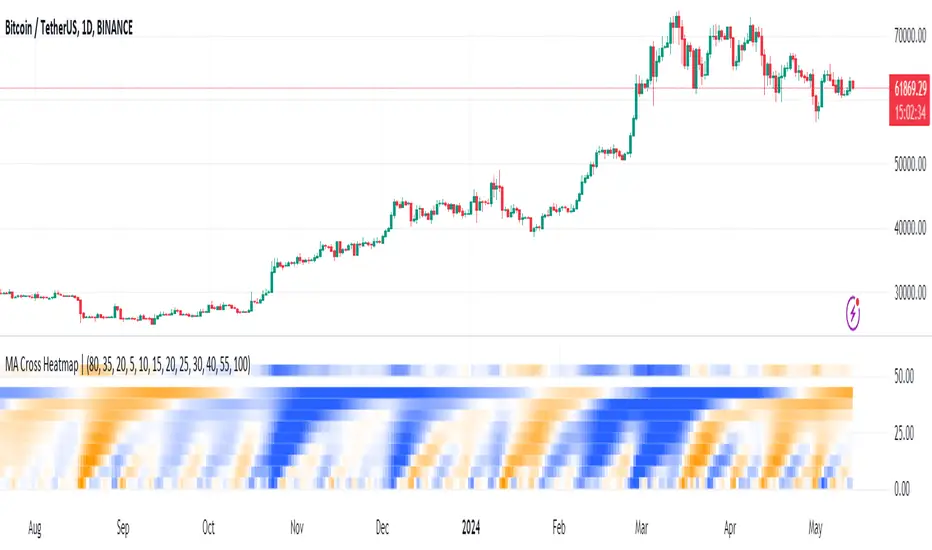
MA Cross HeatmapThe Moving Average Cross Heatmap Created by Technicator , visualizes the crossing distances between multiple moving averages using a heat map style color coding.
The main purpose of this visualization is to help identify potential trend changes or trading opportunities by looking at where the moving averages cross over each other.
Key Features:
Can plot up to 9 different moving average with their cross lengths you set
Uses a heat map to show crossing distances between the MAs
Adjustable settings like crossing length percentage, color scheme, color ceiling etc.
Overlay style separates the heat map from the price chart
This is a unique way to combine multiple MA analysis with a visual heat map representation on one indicator. The code allows you to fine-tune the parameters to suit your trading style and preferences. Worth checking out if you trade using multiple moving average crossovers as part of your strategy.
MA Crossover TypeDraws the up and down crossovers of a specified MA Type.
# Inputs
- MA Type: "sma", "ema", "swma", "vwma", "wma"
- Length >=1
- Source
- Offset >= 0
- Show cross Up?
- Show cross Down?
# Open Source
The code is open source @ github.com and uses the commonpine library github.com

MA Cross by RealmixTwo Moving Average with crossmarker when both indicators are crossing for a possible position

MA Crossover Strategy with TP/SL (5 EMA Filter)How the Strategy Works on a 5-Minute Chart:
Data Input (5-Minute Candles):
Every single data point (candle) on your chart will represent 5 minutes of price action (Open, High, Low, Close for that 5-minute period).
All calculations (MAs, EMA, signals) will be based on these 5-minute price data points.
Moving Average Calculations:
Fast MA (10-period SMA): This will be the Simple Moving Average of the closing prices of the last 10 five-minute candles. It reacts relatively quickly to recent price changes.
Slow MA (30-period SMA): This will be the Simple Moving Average of the closing prices of the last 30 five-minute candles. It represents a slightly longer-term trend compared to the Fast MA.
5 EMA (5-period EMA): This is the Exponential Moving Average of the closing prices of the last 5 five-minute candles. Being an EMA, it gives more weight to the most recent 5-minute prices, making it very responsive to immediate price action.
Signal Generation (Entry Conditions):
Long Entry Signal:
The 10-period SMA crosses above the 30-period SMA (indicating a potential bullish shift in the short-to-medium term trend).
AND the current 5-minute candle's closing price is above the 5-period EMA (confirming that the immediate price momentum is also bullish and supporting the crossover).
If both conditions are met at the close of a 5-minute candle, a "Buy" signal is generated.
Short Entry Signal:
The 10-period SMA crosses below the 30-period SMA (indicating a potential bearish shift).
AND the current 5-minute candle's closing price is below the 5-period EMA (confirming immediate bearish momentum).
If both conditions are met at the close of a 5-minute candle, a "Sell" signal is generated.
Trade Execution:
When a signal is triggered, the strategy enters a trade (long or short) at the closing price of that 5-minute candle.
Immediately upon entry, it places two contingent orders:
Take Profit (Target): Set at 2% (by default) away from your entry price. For a long trade, it's 2% above; for a short trade, 2% below.
Stop Loss: Set at 1% (by default) away from your entry price. For a long trade, it's 1% below; for a short trade, 1% above.
The trade will remain open until either the Take Profit or Stop Loss price is hit by subsequent 5-minute candles.
Implications for Trading on a 5-Minute Chart:
Increased Trade Frequency: You will likely see many more signals and trades compared to higher timeframes (like 1-hour or daily charts). This means more potential opportunities but also more transaction costs (commissions, slippage).
Sensitivity to Noise: Lower timeframes are more prone to "market noise" – small, random price fluctuations that don't indicate a true trend. While the 5 EMA filter helps, some false signals might still occur.
Faster Price Action: Price movements can be very rapid on a 5-minute chart. Your take profit or stop loss levels might be hit very quickly, sometimes within the same or next few candles.
Parameter Optimization is Crucial: The default MA lengths (10, 30) and EMA (5) might not be optimal for every asset or market condition on a 5-minute chart. You'll need to backtest extensively and potentially adjust these lengths, as well as the targetPerc and stopPerc, to find what works best for the specific instrument you're trading.
Risk Management: The fixed percentage stop loss is vital on a 5-minute chart due to its volatility. Without it, a few unfavorable moves could lead to significant losses.

MA Cross 50/100, 100/50 Moving Average Cross tool using MA 50 / MA 100 / MA 200
I have found these settings useful on Bitcoin & other markets
Alerts Added,
Breakout = MA 50 crossing above MA 100
Breakdown = MA 100 crossing under MA 50
MA 200 added as a useful area for overall support
No repaint.