Jurik MacD & Leader NCMhey everyone,
While there are some Invite-Only Jurik MacDs, there are no free/open ones, so I thought I'd create one and publish it. It has most of the bells and whistles you'd want (I hope!).
You can see one with the bells and whistles all turned on in the first, and a 'quieter' one in the second.
//-----------------////-----------------////-----------------//
Why Jurik?
The Jurik MA is a quicker and smoother Exponential MA, and the best of all MAs, according to Jurik Research (lol). To be fair. I have found it to be excellent, and that is why I'm publishing this.
Power can be changed, recommended from 1-4: increasing it pulls it closer to the current price (almost like reducing the period), and decreasing: vice versa.
Phase increases the inertia of the line, how quickly it will respect price changes. It is usual to have less inertia on the fast JMA, and more on the slower (but remember the MACD line is the FastJMA minus the SlowJMA, so you may find adjusting power and phase on Signal line more effective). Search online for JurikRes (or Jurik Research) for more detailed information about the Jurik.
In the coding I have included a list of four different ways to set up the JMAs: however, you should probably tune this to your preferred asset (as with almost all indicators). If you find a good setup, please let me know!
You could trade with a MacD a number of ways. Entries could be:
- MacD crossing the zero line
- MacD crossing over the Signal line
- Histogram crossing above zero line.
Vice versa for exits. If this isn't enough, please google 'trading with a MacD'.
No indicator is perfect for trading, and that includes this one! Don't trade unless you know what you're doing.
//-----------------////-----------------////-----------------//
Please let me know if I can improve this script, or you have any other feedback. I can post code for colour palette as well if that is something anyone is keen on.
//-----------------////-----------------////-----------------//
Thanks to the many excellent coders that publish freely their code. I have learned so much from this community, and this code is based on the work of others (Chris Moody and everget).
Shout out to StevieMagg as well, who has helped me develop (and didn't want to charge me!). The Pine Script Community on Discord has been brilliant - lots of knowledge, ideas, support - thanks guys.
If you are new and interested in pine coding, I suggest you check out some of the masters (in no order):
ChrisMoody
Everget
RedKTrader
LonesomeDove
LazyBear
KivancOzbilgic
and more that I am missing. It is not necessarily the popular scripts that are the best.
//-----------------////-----------------////-----------------//
Kind regards,
Nelson
"LazyBear" için komut dosyalarını ara

Bollys Perfect Candle EntryThis source code is subject to the terms of the Mozilla Public License 2.0 at mozilla.org
This indicator is a combination of multiple open sources indicators
Squeeze Momentum Indicator SQZMOM_LB
Improved Linear Regression Bull and Bear Power v02 BBP_NM_v02
Cheezus by matheaufx
INDIGO - Cloud System ©INDIGO Cloud System ©
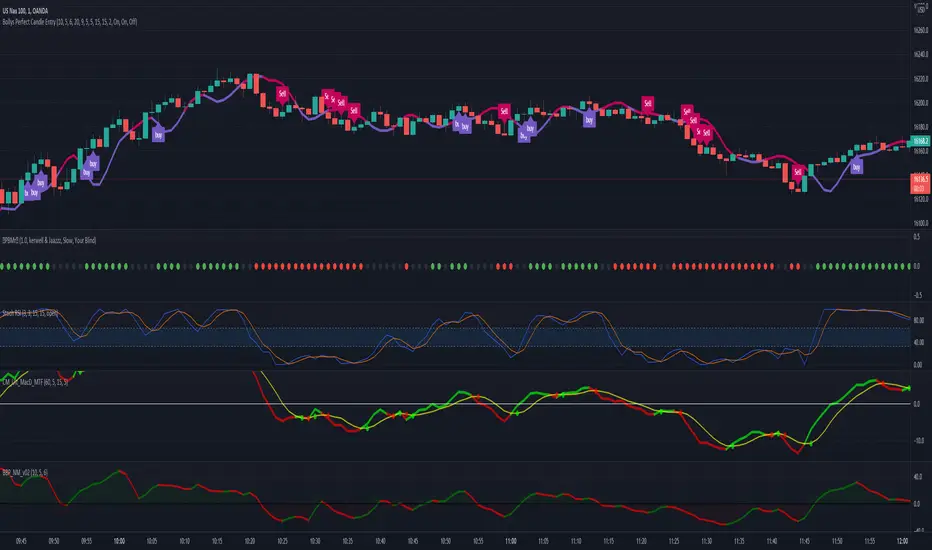
This script shows the monthly dip and peak zones and the daily highs & lows.
The green zone is the dip zone. It's the place to enter a long position if you think there is or will be a reversal.
The red zone is the peak zone. It's the place to enter a short position if you think there is or will be a reversal.
The script uses the INDIGO Cloud System ©, the Ultimate RSI and the Market Direction Indicator to find an entry at the most optimal point in space and time.
The exit for the long trade is on the purple line and the exit for the short trade is on the blue line.
It also has an RSI exit to minimize the risk of a sudden reversal in the wrong direction while in trade.
You can set TP and SL to see the effects of it on the chart. Be aware that these change a lot of trades so use it wisely.
The labels are connected to alerts to notify you of a possible entry or exit.
This script uses the Ultimate RSI by ChrisMoody, thanks for creating this Chris !
This script also uses the Market Direction Indicator by LazyBear, great script !
You can use the MD Filter to filter out some bad trades. It decreases losses but also some profits.
Experiment with the settings, each pairing needs different settings.
--> Use this script at your own risk. Do your own research, never invest money you're not willing to lose and never put your trust in one indicator !
To my best knowledge this script doesn't repaint. I never use the close and only use high/low when value can't be untrue again. If you find repainting in this script PLEASE let me know !
Feel free to contact me for questions or feedback.
Enjoy the script :)

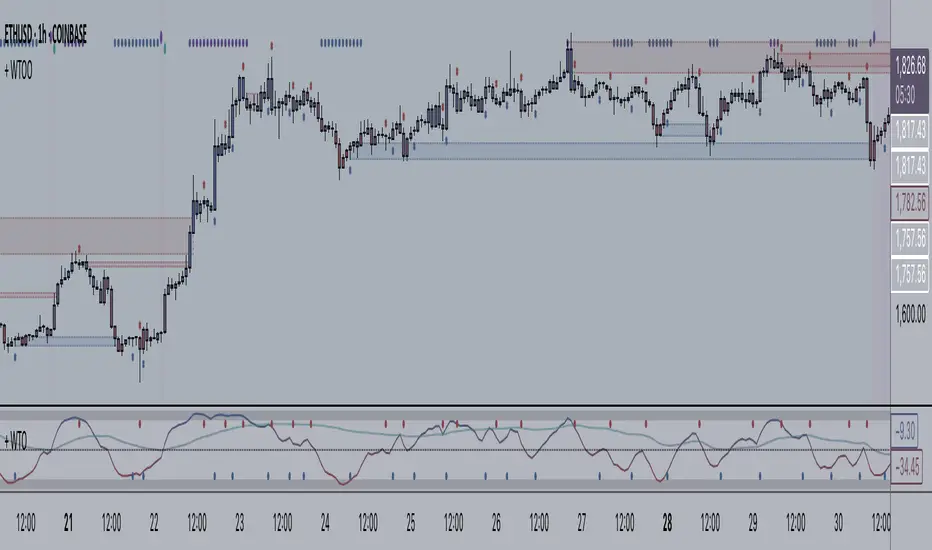
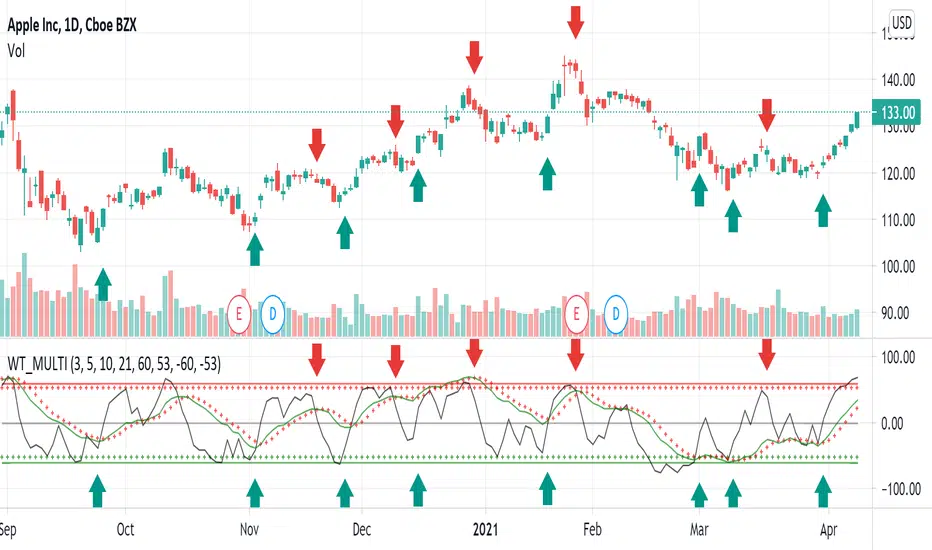
+ WaveTrend Oscillator OverlayAn overlay version of pertinent signals from my version of LazyBear's Wavetrend Oscillator.
Shows momentum of long period WTO as either background colors or symbols.
Shows continuation and reversal trade signals.
If Secondary WTO is above the center line (momentum is long), then symbols print across the top of the chart when the primary (faster) WTO comes into "oversold," a number associated with a horizontal line on the off-chart indicator. This number is selectable via a drop-down menu. Same thing for bearish momentum.
Conversely, reversal signals are printed along the bottom when conditions are met. Ex: if the Secondary WTO is showing momentum is bullish, then symbols will print along the bottom when the primary WTO is at "overbought" (or whatever number you deem overbought--again, via a similar drop-down menu).
Also, symbols are printed above and below candles for when the moving average of the primary WTO is crossed.
You could use these for taking profits, exiting a trade, or entering a trade.
Includes a moving average that is an average of the 200 EMA, SMA and Kijun.
Alerts.
Enjoy.
//p.s. I recommend using this in conjunction with my "+ Wavetrend Oscillator" at least starting out. Helps to have a visual
//reference when picking reversal and continuation numbers.
SQZ Multiframe StrategyThis is a first attempt to automate what my current strategy when trading is.
It uses 2 timeframes: the one you are currently using to see the chart and an "anchor trend" which is a higher order frame.
Supported timeframes are: 1m, 5m, 15m, 30m, 1H, 4H, 1D, 1W
The Strategy relies on two indicators:
Squeeze Momentum Indicator
CMF
How does it works?
It looks for a moment when the following conditions are met.
For Long:
Positive directionality in SQZM monitor in anchor timeframe
Positive directionality in SQZM monitor in current timeframe
Recent minimum in CMF
For Short:
Negative directionality in SQZM monitor in anchor timeframe
Negative directionality in SQZM monitor in current timeframe
Recent maximum in CMF
After a BUY or SELL order is executed the plot will start showing two lines: A TP line, and a SL line.
The TP and SL move dynamically based on a greedy algorithm based on 3 input parameters.
Min Profit to Start Moving SL (%): Sets an initial target for the trade.
Maximum Possible of SL (%): This is the maximum amount possible for SL. If volatility is not too high, a shorter SL will be chosen based on Kaufman's Stops method
Take profit factor: Is how much portion of the target I am taking as profit once the target is reached
Example for 5% Min profit:
When the first target is reached (+5%), the SL will be updated to 2.5% over the enter price.
When the second target is reached (+10%), the SL will be updated to 5% over the enter price.
Note: The strategy might abandon the position prematurely if a contrary signal is received while the trade is opened, and will change direction.
The Strategy has been backtested mostly for crypto. It might be good for stocks too, but the parameters mentioned might need some adjustments since price moves at a different rate.
Recommended timeframe is 4H for BTC , and 30min/1H for alts.
Comments and ideas are more than welcome!

CM_Twiggs Money FlowFull Credit goes to LazyBear for publishing Original Code.
I added:
Threshold lines that changes the color of Histogram based on if it exceeds Threshold lines. Ability to turn off and on.
Ability to Turn Histogram Off/On
Ability to turn Twiggs Money Flow Line Off/On

MTF VWAPA simple wavetrend oscillator based off WaveTrend Oscillator by @LazyBear to visualise 4 different timeframe vwap under 1 chart.
Timeframe can be changed in indicator settings in minutes. Unnecessary waves can be removed by unchecking said TF wave in Style settings.

Premier Stochastic Oscillator (PSO) [andre_007]This is a improved version of Premier Stochastic Oscillator (PSO), coded by "LazyBear".
"The indicator was first introduced by technical analyst Lee Leibfarth in the August 2008 issue of the journal Technical Analysis of Stocks & Commodities".
Inprovements:
The script was update to version 4 of PineScript.
Added support for diferents times frames.
For example, now it's possible to stay in intraday and at same time see a weekly version of this indicator.
Possibility to customize the thresholds.
Introduction to indicator:
"Stochastic oscillators have long been used to help traders and investors identify areas where trend changes are likely.
Leibfarth developed the PSO to take advantage of a standard stochastic oscillator's strengths while enhancing it to become more reactive to market activity.
The result is a faster indicator that provides earlier signals for potential trend changes".
More info:
www.investopedia.com

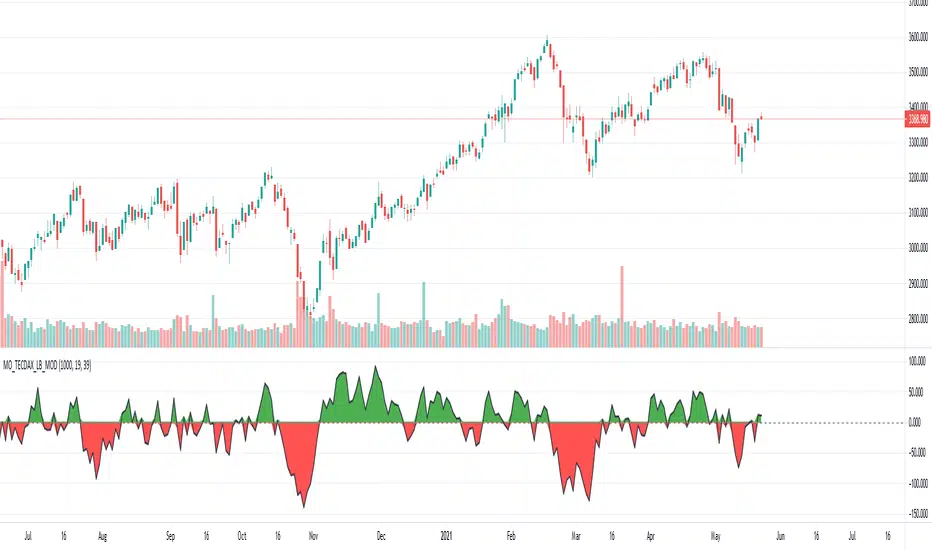
[Unxi]McClellan Oscillator for TECDAX [modified]This version is for use with the German TecDax index only!
About McClellan Oscillator
Developed by Sherman and Marian McClellan, the McClellan Oscillator is a breadth indicator derived from Net Advances, the number of advancing issues less the number of declining issues. Subtracting the 39-day exponential moving average of Net Advances from the 19-day exponential moving average of Net Advances forms the oscillator.
As the formula reveals, the McClellan Oscillator is a momentum indicator that works similar to MACD .
McClellan Oscillator signals can be generated with breadth thrusts, centerline crossovers, overall levels and divergences.
About my version
This version here is a modification, though:
- It can only be used on the German TECDAX index
- It only considers the TECDAX stocks
- The data window will provide a summary about rising and declining stocks
- The data window will output the last change for each of the 30 stocks
The script is pretty slow because it has to calculate the change for each bar individually (instead of receiving a complete calculation from the stock exchange).
This script will work on any time period. Just use whatever timeperiod you are comfortable with, the indicator will automatically adjust accordingly. It is recommended to use it with timeperiod = 1d, though.
DISCLAIMER
This script was mainly written for educational purposes (training myself how to write custom indicatotors).
As you can see, the code is really messy. Feel free to provide your feedback in the comments!
Credits
Based on the simple version of aftabmk
You can find the original version by searching for McClellan Oscillator for nifty 50.
Also got some inspiration from lazybear's version and from danarn's "Crypto McClellan Oscillator".
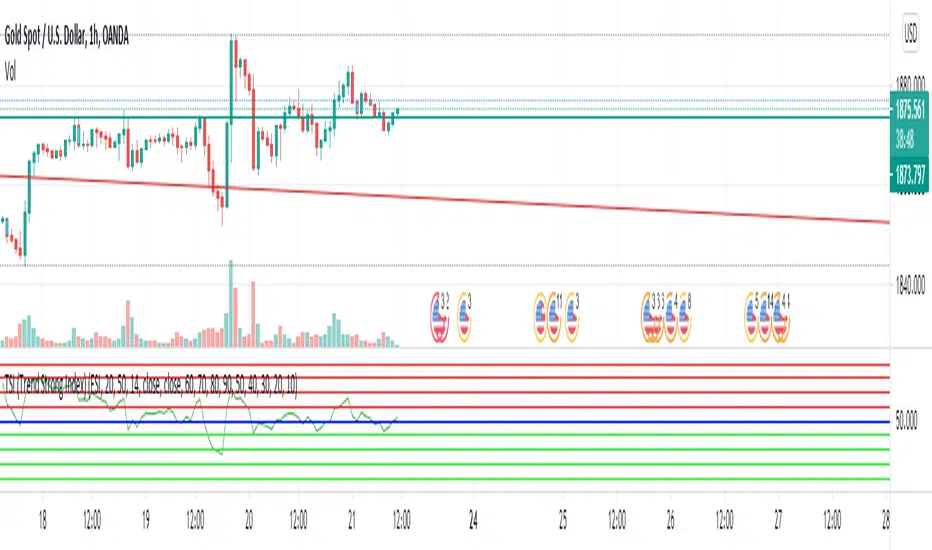
TSI (Trend Strong Index) I use LazyBear's WT_cross indicator to confirm signal. I thing your should use this indicator with Divergence or Fibonacci to open order.
Squeeze Momentum Indicator MTF with alerts [lazy bear]MTF version of the popular squeeze momentum indicator, created and shared by Lazy Bear

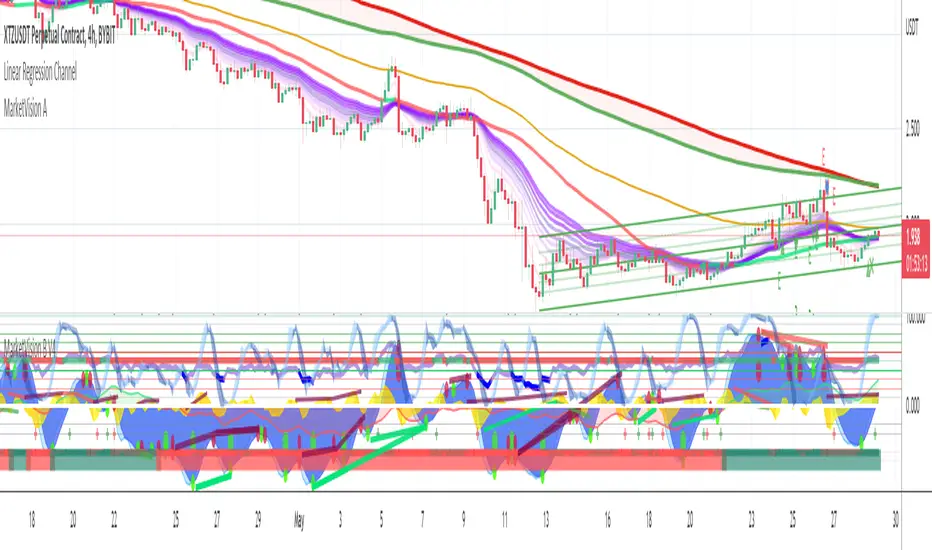
MarketVision AWith Special Thanks to Everyone who has gone before me, and who have both allowed me and given me Permission to bring my version of Market Cipher to the World
Especially LazyBear for his amazing Wave Trend Oscillator and for Aevir, falconCoin, vumanchu, Crypto_Spike and others who have freely brought MarketCipher to the Tradingview Community and Also JustUncleL for his Multiple MA Variations / types
MarketVision A - My take on MarketCipher A / Market Cipher A But with a few Additions
A Combination of;
Different Types of Moving Averages including a Ribbon which can be switched off
MA Cross Over Signals &
Signals Obtained from Wave Trend and Trend Meter
Lots Of Alerts
Use Stand Alone or In Combination with MarketVision B Aswell As Support and Resistance
PS All the Signals are defined in the menu
MarketVision BWith Special Thanks to Everyone who has gone before me, and who have both allowed me given me permission to bring my version of Market Cipher to the World
Especially LazyBear for his amazing Wave Trend Oscillator and for Aevir, falconCoin, vumanchu, Crypto_Spike and others who have freely brought MarketCipher to the Tradingview Community
Also special mention to RicardoSantos for his Divergence script
MarketVision B - My take on MarketCipher B / Market Cipher B, Ive just put outlines on the Wave Trend to add to the Visual Appeal and Added a Trend Meter and a few more options for the Oscillators
Nice To Look At
Oscillator 1 Choose Between - RSI, MFI and Ultimate Oscillator
For Stochastics Choose Between Standard and RSI Stochastics and for the source you can choose On Balance Volume
Wave Trend
Money Flow
Trend Meter & Signals Bar
Divergences are marked, However they are easy to spot and it is better to train your eyes to spot them before the indicator marks them out
Lots of Alerts and Loads of ways to trade using MarketVision
PS: You can make this look like the original by adjusting the parameters in the menu

Best Volume Indicator - BTCIn order to make more sense of trading volume in crypto …
Based on the Better Volume Indicator (curtesy of Emini-Trading (emini-watch.com) and the TradingView Adaption by LazyBear ().
My tweaks/adaptations:
- altered the calculation of low volume (c11) in the LB adaptation since it represents the original code better (in my opinion)
- takes volume of multiple exchanges into consideration
- added standard-deviation bands in order to identify peak amount of trading volume
- added three EMA's in order to assess the amount of trading volume even better
- changed the color coding of the original Better Volume Indicator (my preference)
volume climax up = green (instead of red)
volume climax down = red (instead of white)
low volume = yellow
churn = blue (instead of green)
climax + churn = purple
"normal" volume = gray (instead of cyan)

WaveTrend MultiEMAThis is a modification of LazyBear's WaveTrend. The SMA trend has been removed and a shorter time frame EMA has been added in black. The idea is to buy when the shorter time frame starts to curl up and the longer time frame, green, has started to either flatten out or curl up too. Sell when the shorter time frame has started down and green has either flattened or bottomed out as well. The black line will generate some noise so the key is to use the two in combination. My final goal would be to have the green line looking at daily candles and the black line looking at a 2 or 4 hour candle, but I haven't figured out how to do that.
All in one [Liubam]Hey tradingviewers!
This is an All in one Indicator for those who can't add too many indicators on your charts. Inspired by ©LonesomeTheBlue "Indicators all in one" script. I found a lot of very interesting scripts on the public library and I decided to make a tool with some of the greatest IMO, adding some modifications to improve the indicators. With this tool you can plot 1 of 6 different indicators by selecting it from a drop-down list (on the indicator settings).
All the credit goes to it's respective owners (taggeds).
THIS INDICATOR INCLUDES:
1. Classic RSI with some OB/OS tools:
The relative strength index (RSI) is a popular momentum indicator displayed as an oscillator (a line graph that moves between two extremes) that measures the magnitude of recent price changes to evaluate overbought or oversold conditions, in other words it shows signals about bullish and bearish price momentum. I added some visual improvements to help you finding the OB/OS zones.
2. Classic CCI with some OB/OS tools.
The Commodity Channel Index (CCI) is a momentum-based oscillator used as market indicator to help determine market movements that may indicate buying or selling. Added some vistual improvements to the chart.
3. ADX and DMI oscillator with the keylevel coded by @console:
The Average Directional Index (ADX) is non-directional indicator used by some traders to determine the strength of a trend. When the ADX line is rising (Above the keylevel) trend strength is increasing, and the price moves in the direction of the trend whether up or down. Otherwise, low ADX (Below the keylevel) is usually a sign of accumulation or distribution (Range). Non-trending doesn't mean the price isn't moving. It may not be, but the price could also be making a trend change or is too volatile for a clear direction to be present.
Suggested settings of the keylevel is 23-25.... REMEMBER: The trend may be your friend.
4. MFI
The Money Flow Index (MFI) is a technical oscillator for identifying overbought or oversold signals in an asset. Unlike conventional oscillators such as the RSI, the Money Flow Index incorporates both price and volume data, as opposed to just price. It can also be used to spot divergences which warn of a trend change in price.
5. Stochastic:
A stochastic oscillator is range-bound, meaning it is always between 0 and 100. This makes it a useful indicator of overbought and oversold conditions. Traditionally, readings over 80 are considered in the overbought range, and readings under 20 are considered oversold. However, these are not always indicative of impending reversal; very strong trends can maintain overbought or oversold conditions for an extended period. Instead, traders should look to changes in the stochastic oscillator for clues about future trend shifts. I added some features for this popular indicator to show the stochastic crosses.
6. The famous Squeeze momentum Indicator made by @Lazybear:
This is derivate of John Carter's "TTM Squeeze" volatility indicator and its very strong when using with trending indicator such a ADX. Black line (or no-line) on the midline show that the market just entered a squeeze ( Bollinger Bands are with in Keltner Channel). This signifies low volatility , market preparing itself for an explosive move (up or down). Gray line signify "Squeeze release". Mr.Carter suggests waiting till the gray line after a blackline, and taking a position in the direction of the momentum (for ex., if momentum value is above zero, go long). Exit the position when the momentum changes.
------------------------------------------------------------------------------------------------------------------------------------------------------------------------------------------------------------------------------------------------
This script is source code protected, but you can add to your favorite list to use it. Also you can add twice to use 2 different indicators at the same time (E.g. Squeeze Momentum Indicator + ADX)
An additional indicator I made (MA Hunterz + InfoPanel) is needed to not miss good entry points.
Your valuable comment and feedback is much appreciated...
And remember indicators can be really helpfull but always use Price Action.

BOSCILLATOR. A BOSS OSCILLATORI would like to first say I do not the indicator pieces. Would like to personally give thanks and credit to @MarkBench for coding this indicator and helping to get my vision for this system finally able to be published and used by anyone. I would also like the thank @lazy bear and @ChrisMoody for their bringing the Firefly oscillator and the SCHAFF TREND and the PPO price percentage oscillator to trading view. and @scilentor for his version of Godmode with LSMA . Thanks to @Shizaru for bringing Frama moving average (which we have adopted into the PPO as one of the base selections for the first time, as well as the ALMA ). Divergences have also been added. and components of the firefly have been removed such as the histogram. I have added two oscillators in the picture. The bottom is the standard settings. The above is how I prefer mine to look after tweaking the settings.
Before I get into explaining how its used. I want to say all the indicators are open and none privately owned or at least owned by indivduals who brought them to trading view. Any due permission is granted at my disclocsure. I also want to say this is not your typical mashup of indicators as the is a very clear way to view and use this specifically. Also I want to say original tools from their original scripts are also improved. For example the PPO being used we have added the FRAMA and ALMA moving average basis option which it did not have before. And now everything has clear divergences and some other minor changers. but here are the rules and examples.
THE BOSCILLATOR - A MULTI-LEVEL CONFLUENCE/CONFIRMATION FILTER VISUALIZATION
Some shorthand
(Main oscillator - firefly)
(background wave thing - PPO )
(the red vertical up and down line with red and green dots - STC )
(the blue, yellow and red dots - warning dots)
WHO IS THIS INDICATOR FOR? - This indicator itself is not meant to be a signal giver to buy or sell right now even though it could be and some of the original scripts are used as such. This indicator is actually meant to be a VISUAL CONFIRMATION & FILTER for trades taken in other methods outside of this indicator. What are some of those methods that may benefit from having this? Pivot point traders, FIB traders, Bollinger band traders, Moving average traders.. just to name a few. This indicator itself is meant to in a quick glance allow the trade to see the condition of many different elements outside of the main price and chart, and determine if that trade looks like it has too much risk, or if that trade looks suitable. It also provides a series of confirmations that could be used for adding to a position at different levels at the trade's discretion.
OPTIMAL CONDITIONS FOR CONSIDERING A SHORT = The PPO is orange/red + the STC is at the TOP + the Firefly is above the midline. The warning dots are being printed at the top. There is regular or hidden bearish divergence present.
OPTIMAL CONDITIONS FOR CONSIDERING A LONG = The PPO is light/dark green + the STC is at the BOTTOM + the Firefly is below the midline. The warning dots are being printed at the bottom. There is regular or hidden bullish divergence present.
Triggers for scaling/adding into your position = Keeping in mind that this oscillator on its own is not meant to be the sole reason for taking a trade, here are some triggers you will see for getting into position (preferably with the optimal conditions being met) The firefly flips from a green line into a red slide and vise versa. The firefly crosses the midline up or down. The STC begins going up/down and triggers a green or red dot while crossing one of the levels at 20 or 80. The warning dots being made begin to be printed lower/higher than the dot before last. The PPO shift from one color to the next in the favored direction of the trade you wish to make.
Signs for taking profit and protecting your trade = The Dots begin to print, the PPO changes colors at the top or bottom. the STC arrived are the top.
FILTER SITUATIONS TO AVOID TRADES = Wise to not take a trade if the PPO and the firefly do not agree. For example - if the PPO is showing green yet the firefly is still red may be an indication that it is getting a bit late for you to enter the trade. Same with opposing divergences and warning dots contradicting the trade you are looking at. The STC being already on the bottom or top may be a small indication that trade may already have been a little too ripe, but on its own is not always the case.
When selecting the PPO settings and moving average you are going to want it to be in favor of what you are trying to accomplish.IF you are one low time frames and trying to swing or scalp trade... chances are you want a reactive MA setting that iss responsive. Iwould recommend the HULL, ALMA, TEMA DEMA. For the Higher time frame the EMA or the T3 WDma can be wuite patient and helpful for a constant reminder of caution
Some notes - for the swing and scalp trading... in my experience the PPO moving average basis sees more responsive changes with the FRAMA , ALMA , HULL settings. for entering a trade, at least a couple of your triggers being present increases the success rate by a lot.
This chart illustrates the usefullness of having a Zero lag function for the firefly. The firefly should not be taken for signals or trades itself. However it is the most precise finder of divergences within the system. It is aways good to flip on and off zero lag just to take a quick look for divergences you might have mixed.
In this chart illustrates the general visual look and order of events to guide you along your way. Starts with the PPO turning green or red or orange which is potentially time to get out of your current trade. Then it switched colors when reversal begins and that is when you want to at the same time see the STC, the firefly, and lower caution dots coming in around the same area (highlighted in blue squares). Now near the end you see a red box. This is a filter aspect. The PPO is green, yet the others are saying down/short. This does not mean it must be a long, however it is great warning to maybe avoid getting to bearish for the downside in that time. You want the PPO and line up with the others and it should be visually apparent that they all want to go the same way.
Here is a list of some key elements (before changes this script made) of parts this oscillator includes. My original publication of my oscillation setup was blocked by the mods here.. this one however includes a large variety of items that have been altered from their original formats and a well-explained trading system to use it with.
// Firefly
Firefly Oscillator
// PPO
PPO PercentileRank Mkt Tops & Bottoms (@PuppyTherapy)
// Divergence
Divergence Indicator (any oscillator)
// Godmode
Godmode3.2+LSMA
// Schaff
Schaff Trend Cycle
// Frama
(FRAMA) Fractal Adaptive Moving Average

Woodfield Edit on [LazyBear]I have added some coloring and flow changes which makes it easy to view the data points.

Squeeze Momentum Indicator v4_pine [By Lazy Bear]This is the famous Squeeze Momentum Indicator made by @LazyBear in v4 version if someone wants to test some strategies, as the original code was in v2 version the code converter couldn't convert to v4.


WaveTrend Oscillator v2 [Aspenforest]This is your regular WaveTrend Oscillator, which was originally scripted by LazyBear, but I updated the source code to Pine Script version 4, refactored the logic, and made the indicator more aesthetically pleasing.

Pip collector ModThis modification of LazyBear's popular script called Pip collector features custom signal generation and information section displaying elapsed bar time useful for timing trades.

CHOP Zone Entry Strategy + DMI/PSAR ExitThis is a Strategy with associated visual indicators and Long/Short and Reverse/Close Position Alerts for the Choppiness Index (CHOP) . It is used to determine if the market is choppy (trading sideways) or not choppy (trading within a trend in either direction). CHOP is not directional, so a DMI script was ported into this strategy to allow for trend confirmation and direction determination; it consists of an Average Directional Index (ADX) , Plus Directional Indicator (+DI) and Minus Directional Indicator (-DI) . In addition, a Parabolic SAR is also included to act as a trailing stop during any strong trends.
Development Notes
---------------------------
This indicator, and most of the descriptions below, were derived largely from the TradingView reference manual. Feedback and suggestions for improvement are more than welcome, as well are recommended Input settings and best practices for use.
www.tradingview.com
www.tradingview.com
www.tradingview.com
Recommend using the below DMI and PSAR indicators in conjunction with this script to fully visualize and understand how entry and exit conditions are chosen. Variable inputs should correlate between the scripts for uniformity and visual compatibility.
THANKS to LazyBear and his Momentum Squeeze script for helping me quickly develop a momentum state model for coloring the Chop line by trend.
Strategy Description
---------------------------
CHOP produces values that determine whether the market is choppy or trending . The closer the value is to 100 , the higher the choppiness levels , while the closer it is to 0 , the stronger the market is trending . Territories for both levels, and their associated upper and lower thresholds, are popularly defined using the Fibonacci Retracements, 61.8 and 38.2.
Basic Use
---------------------------
CHOP is often used to confirm the market condition to help you stay out of sideways markets and only enter when there is movement or imminent explosions. When readings are above the upper threshold, continued sideways movement may be expected, while readings below the lower threshold are typically indicative of a continuing trend. It is also used to anticipate upcoming trendiness changes, with the general belief that extended periods of consolidation (sideways movement) are followed by extended periods of strong, trending, directional movement, and vice versa.
One limitation in this index is that you must be cautious in deciding whether the range or trend will likely continue, or if it will reverse.
Confidence in price action and trend is higher when two or more indicators are in agreement -- while this strategy combines CHOP with both DMI and PSAR, we would still recommend pairing with other indicators to determine entry or exit trade opportunities.
Recommend also choosing 'Once Per Bar Close' when creating alerts.
Inputs
---------------------------
Strategy Direction - an option to only trade Short, Long, Both, or only in the direction of the Trend (Follow Trend is the Default).
Sensitivity - an incremental variable to test whether the past n candles are in the same trend state before triggering a delayed long or short alert (1 is the Default). Can help filter out noise and reduces active alerts.
Show Chop Index - two visual styles are provided for user preference, a visible Chop line with a background overlay, or a compact column and label only view.
Chop Lookback Period - the time period to be used in calculating CHOP (14 is the Default).
Chop Offset - changing this number will move the CHOP either forwards or backwards relative to the current market (0 is the Default).
Smooth Chop Line and Length - if enabled, the entered time period will be used in calculating a smooth average of the index (Enabled and 4 are the Defaults).
Color Line to Trend Direction - toggles whether the index line is colored to visually depict the current trend direction (Enabled is the Default).
Color Background - toggles the visibility of a background color based on the index state (Enabled is the Default).
Enable DMI Option - if enabled, then entry will be confirmed by and dependent on the ADX Key Level, with any close or reversal confirmed by both ADX and +/-DI to determine whether there is a strong trend present or not (Enabled is the Default).
ADX Smoothing - the time period to be used in calculating the ADX which has a smoothing component (14 is the Default).
DI Length - the time period to be used in calculating the DI (14 is the Default).
ADX Key Level - any trade with the ADX above the key level is a strong indicator that it is trending (23 to 25 is the suggested setting).
Enable PSAR Option - enables trailing stop loss orders (Enabled is the Default).
PSAR Start - the starting value for the Acceleration Force (0.015 is our chosen Default, 0.02 is more common).
PSAR Increment - the increment in which the Acceleration Force will move (0.001 is our chosen Default, 0.02 is more common).
PSAR Max Value - the maximum value of the Acceleration Factor (0.2 is the Default).
Color Candles Option - an option to transpose the CHOP condition levels to the main candle bars. Note that the outer red and green border will still be distinguished by whether each individual candle is bearish or bullish during the specified timeframe.
Note too that if both DMI and PSAR are deselected, then close determinations will default to a CHOP reversal strategy (e.g., close long when below 38.2 and close short when above 61.8). Though if either DMI or PSAR are enabled, then the CHOP reversal for close determination will automatically be disabled.
Indicator Visuals
---------------------------
For the candle colors, black indicates tight chop (45 to 55), yellow is loose chop (38.2 to 45 and 55 to 61.8), dark purple is trending down (< 38.2), and dark blue is trending up (> 61.8).
The background color has additional shades to differentiate a wider range of more levels…
• < 30 is dark purple
• 30 to 38.2 is purple
• 38.2 to 45 is light purple
• 45 to 55 is black
• 55 to 61.8 is light blue
• 61.8 to 70 is blue
• > 70 is dark blue
Long, Short, Close, and Reverse labels are plotted on the Chop line, which itself can be colored based on the trend. The chop line can also be hidden for a clean and compact, columnar view, which is my preferred option (see example image below).
Visual cues are intended to improve analysis and decrease interpretation time during trading, as well as to aid in understanding the purpose of this strategy and how its inclusion can benefit a comprehensive trading plan.
DMI and Trend Strength
---------------------------
To analyze trend strength, the focus should be on the ADX line and not the +DI or -DI lines. An ADX reading above 25 indicates a strong trend , while a reading below 20 indicates a weak or non-existent trend . A reading between those two values would be considered indeterminable. Though what is truly a strong trend or a weak trend depends on the financial instrument being examined; historical analysis can assist in determining appropriate values.
DMI exits trade when ADX is below the user selected key level (e.g., default is 25) and when the +/- DI lines cross (e.g., -DI > +DI exits long position and +DI > -DI exits short position).
PSAR and Trailing Stop
---------------------------
PSAR is a time and price based indicator that excels at measuring direction and duration, though not the actual strength of a trend, which is why we use this in conjunction with DMI. It is also included in this script as a trailing stop option to maximize gains during strong trends and to mitigate any false ADX strengthening signals.
This creates a parabola that is located below the candle during a Bullish trend and above during a Bearish trend. A buy or reversal is signaled when the price crosses above or below the Parabolic SAR.
Long/Short Entry
---------------------------
1. CHOP must be over 61.8 (long) or under 38.2 (short).
2. If DMI is enabled, then the ADX signal line must be above the user selected Key Level (default is 25).
3. If Sensitivity is selected, then that past candle must meet the criteria in step 1, as well as all the intermediate candles in between.
4. If "Follow Trend" is selected and PSAR is enabled, then a long position can only open when the momentum and PSAR are in an uptrend, or short when both are in a downtrend, to include all intermediate candles if the Sensitivity option is set on a past candle.
Close/Reverse
---------------------------
1. If DMI is enabled, then a close flag will be raised when the ADX signal drops below the Key Level (of 25), and -DI crosses over +DI (if long), or +DI crosses over -DI (if short).
2. If PSAR is enabled, then a close flag will be raised when the current trend state is opposite the last state.
3. If both DMI and PSAR are disabled, then a close flag will be raised if the Chop line drops under 38.2 (if long) or goes over 61.8 (if short).
4. If a Long or Short Entry is triggered on the same candle as any of the above close flags, then the position will be reversed, else the position will be closed.
Strategy Alerts
---------------------------
1. Long Entry
2. Short Entry
3. Reverse
4. Close
The provided backtest result is based on a position sizing of 10% equity with 100k initial capital. When testing SPX, disabling the DMI performed the best, but EURUSD performed poorly without it enabled, and TSLA had a small reduction in net profit. Timeframe likewise differed between commodities with TSLA performing best at 30M, SPX at 15M, and EURUSD at 4H. I do not plan on using this as a standalone strategy, but I also was expecting better results with the inclusion of EMI and PSAR to compliment the CHOP. Key elements of this script will likely be included in future, more holistic strategies.
Disclaimer
---------------------------
Past performance may not be indicative of future results. Due to various factors, including changing market conditions, the strategy may no longer perform as well as in historical backtesting. This post and the script are not intended to provide any financial advice. Trade at your own risk.
No known repainting, though there may be if an offset is introduced in the Inputs. I did my best not to code any other variables that repaint, but cannot fully attest to this fact.
