Oscillators Overlay w/ Divergencies/Alerts by DGTAn oscillator is a technical analysis tool that, simply said, gauge momentum, determine market trend direction and duration. For some oscillators, fluctuations are bounded by some upper and lower band, and traders use them to discover short-term overbought or oversold conditions.
Oscillators are often combined with moving average indicators to signal trend breakouts or reversals
Histogram, is the difference between the oscillator and signal lines, which oscillates above and below a center line and is used as a good indication of an asset's momentum
What to look for
- Signal Line Crossover is the most common signal produced by the oscillators
- Zero Line Crossovers have a very similar premise to Signal Line Crossovers
- Divergence , when the oscillator and actual price are not in agreement, is another signal created by the oscillators
- Overbought and Oversold , with any range-bound oscillator, conditions are a primary signal generated
Oscillators Overlay study
* Presents oscillators on top of the mian chart (price chart)
* A single indicator for many well known and custom oscillators
* Divergence detection
* Alerts for various condtions
The list of oscillators included;
- Awesome Oscillator (AO)
- Chaikin Oscillator (Chaikin Osc)
- Commodity Channel Index (CCI)
- Distance Oscillator
- Elder-Ray Bear and Bull Power
- Elliott Wave Oscillator (EWO)
- Klinger Oscillator
- Money Flow Index (MFI)
- Moving Average Convergence Divergence (MACD)
- Rate Of Change (ROC)
- Relative Strength Index (RSI)
- Stochastic (Stoch)
- Stochastic RSI (Stoch RSI)
- Volume Oscillator (Volume Osc)
- Wave Trend
In technical analysis, investors find oscillators to be important technical tools and consider them more effective when used in conjunction with other means of technical analysis
Disclaimer : Trading success is all about following your trading strategy and the indicators should fit within your trading strategy, and not to be traded upon solely
The script is for informational and educational purposes only. Use of the script does not constitutes professional and/or financial advice. You alone the sole responsibility of evaluating the script output and risks associated with the use of the script. In exchange for using the script, you agree not to hold dgtrd TradingView user liable for any possible claim for damages arising from any decision you make based on use of the script
Komut dosyalarını "LazyBear" için ara

Honey CypherHoney Cypher Aims to do 4 things
Momentum
Trend Strength
Overbought and oversold zones
Being the most beautiful indicator you ever see
Momentum
The big yellow honey waves primary use is to see the momentum of the market, they can be used in a similar way you would use a MACD or Chaikin Money Flow
On this image you see the honey waves being plotted to the 30 minute timeframe while on the 5 minute chart to have an understanding of longer time momentum in the chart.
Trend Strength
Most tools of the indicator can be used for that but the yellow and purple slope strength lines are made specificaly for this. When you see them curl down you know trend is strengthening towards the downside.
The candle color is based on the amount of Honey waves sloping in one direction. This might be the best tool in the indicator to find Trend Strength. Bright yellow candles mean strong bears while the bright blue candles mean strong bulls.
Overbought and oversold zones
By analysing the waves on a chart you start to learn how big waves can get before a reversal or consolidation period arrives.
You can become profitable with the indicator. But to be honest, my primary focus in making this indicator was find ways to visualise alot of data in a clear and beautiful way.
You should use the indicator with some out of the box ideas instead of just trusting the signals.
examples:
Find a head and shoulders pattern on the top of a huge honey wave.
Find a bottom small wave while the others honey waves are in the opposite direction for entering a pullback.
Use the honey for direction but the yellow and purple slope line crosses for entrys.
Comment your own strategys, I made this open source to be able to get community feedback.
The Honey Cypher waves are calculated in a similar way as the MACD histogram. I've combined MACD formula with some of the lazybear formula. It looks for the distance between 2 moving averages to find trend strength. After that the end results get's smoothed out. It is very satisfying to change that as you can see the honey waves create a melting like motion on each change of smoothing.
Below a preview of the honey cypher moving average lines, all lines have a length that is based on the fibonacci number sequence. Honey cypher measures the distance between for example length 5-8 averages.
I hope this inspires coders to create very beautiful scripts.

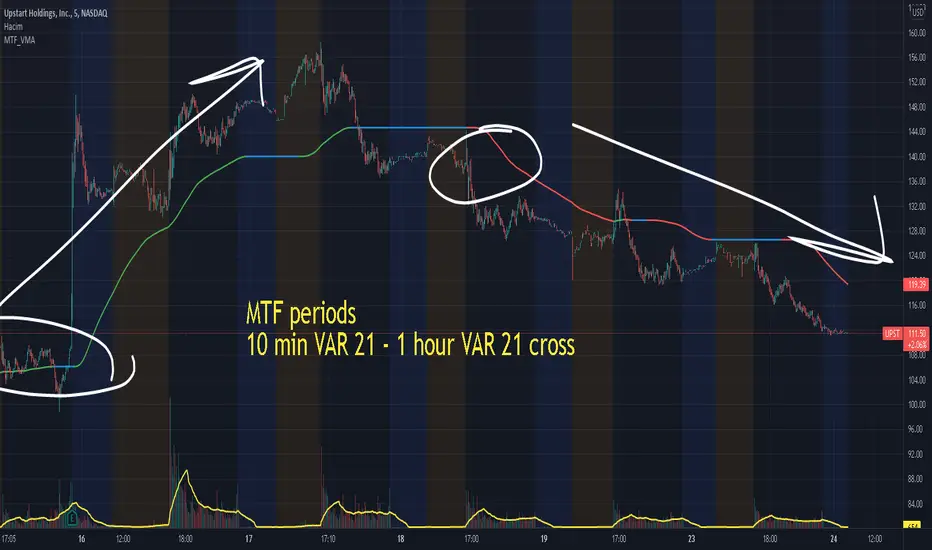
Multiple MTF Variable Moving Average by HassonyaVMA(Variable Moving Average) automatically adjusts its smoothing constant on the basis of Market Volatility.
Use VMA like other Moving Averages. This indicator lazybear's variable moving average has been upgraded and arranged in multi-time frame.
There are 5 variable moving averages whose periods can be changed.
Trend Direction Colors: GREEN COLOR = UpTrend, BLUE COLOR = Potential Congestion, RED COLOR = DownTrend.
If you want, you can use multi-time frame period breakouts
If you want, you can use moving average breakouts of different lengths in the same period.
In this way, you can use 5 moving moving averages in the same period or in different periods.
To activate, go to settings and activate the box to the left of the name. If you uncheck the box, the moving average will disappear.
Stay with the trade and investment. I wish you abundance.
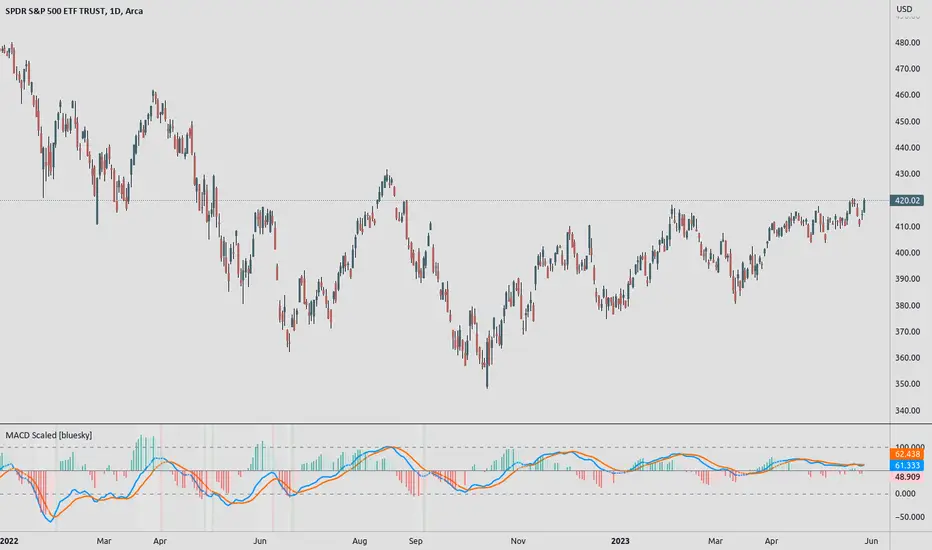
MACD ScaledMACD scaled and re-centered for 0-100 range (user adjustable)
+ Leader
+ Stochastic RSI
Details: A simple MACD re-centered to 50 lines rather than 0 line. Also added MACD Leader and Stochastic RSI to show possible usefulness of re-scaling the MACD.
NOTE: Due to nature of MACD, could not get the lines cannot be contained within top/bottom borders without excess distortion.
Credit to lazybear for leader formula.
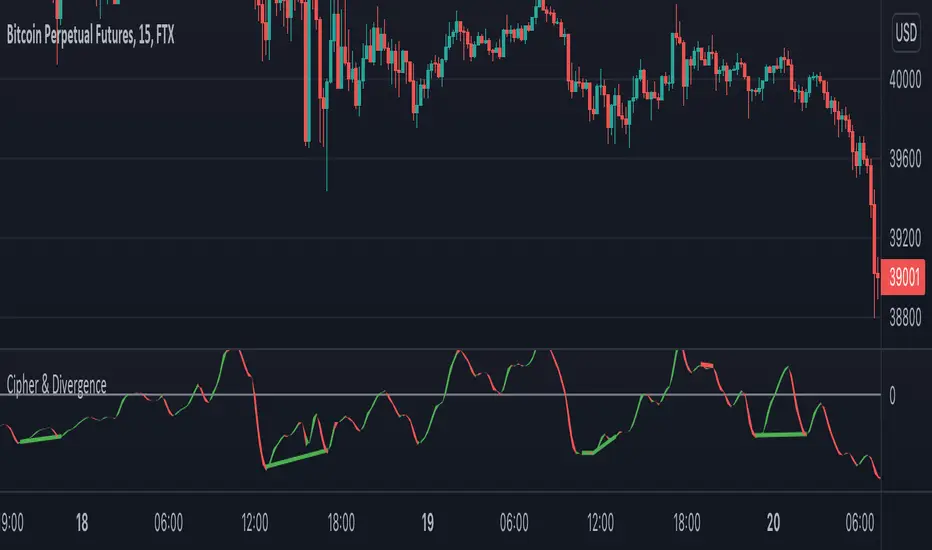
Cipher & DivergenceFor a long time I've been using complicated script with too much informations in it.
In this one I try to have just the bare minimum information to be able to analyse and find a potential reversal zone.
It is inspired from different wave trend / cipher script but has been tuned after months of backtest.
Extending the usage of the wave trend oscillator, which can be used with overbuy & oversell zone it might be better to wait for a confirmation of the movement. This confirmation can be identified by a pull back of the wave trend & price.
We can even confort ourself by waiting for reversal indicators.
Reversal may occurs after a divergence, wait for it, a cross of zero line followed by a PB to find your entry.
You can setup alert on bear / bull divergence but also when the wave trend cross the zero line to never miss a potential trade.
Huge thanks to LazyBear for his wave trend
And thanks vumanchu for his huge cipher script which was very useful for divergence finder
Multi-Timeframe Squeeze Pro/DIM/Momentum/MAIMPORTANT NOTE:
-> The table will not display any timeframes lower than the current one
-> This indicator combine multiple popular indicators and give ability to use them on Multiple timeframes (MFT)
-> Indicators used for the MFT are: Squeeze / Momentum / 10X DIM and Stacked MA (or EMA)
-> Give at glance a good way to see the trend all different timeframes
-> If you are using in combination with squeeze pro please use the one from @Beardy_Fred since it matches the colours and condition used
Credits :
-> J. Welles Wilder creating the Directional Movement System (DMS) (1978); and
-> John Carter applying the DMS to create the popular Simpler Trading 10X Bars indicator.
-> @Beardy_Fred creating a first version including MOM and SQZ
-> Makit0's evolution of Lazybear's script to factor in the TTM Squeeze Pro upgrades - Squeeze PRO Arrows
I have adapted the version from @Beardy_Fred to provide a more complete and customisable indicator while including also the Stacked EMA/MA for further validation
Explanation:
You can learn more about each indicators following those links:
Squeeze Pro:
10X:
Momentum Histogram:
The stacked EMA/MA highlights when the MA/EMA are in order:
Red when they are stacked from the highest to the lowest
Green when they are stacked from the lowest to the highest
Yellow when they are stacked without a clear order
Customisation:
You can customise:
Timeframes
Settings for each indicators (10X/MA/Momentum/Squeeze)
Colors
Visibility
Trade Signals:
If you are going Long, Since this is a combination ideally on the timeframe you are trading you should have all green + green on the above timeframes (those colors are the default ones but can be changed)
-> Green on 10X indicator meaning you are in an uptrend
-> EMA or MA (depending on the configuration of the indicator) Green meaning EMA or MA
-> Squeeze should be Orange or Red ideally (indicating an high or medium Squeeze)
-> Momentum should be Cyan indicating an increase in momentum (while Dark Blue could indicate a reversal)
Standalone indicators:
- Squeeze Pro
- 10X Bar
- Stacked MA
- Momentum

Leonidas Squeeze Momentum SystemThis indicator is based on LazyBear SQ Momentum Indicator and SQ Plus Indicator.
This indicator is using ADX and Squeeze Momentum Indicator.
When you see the ADX above 0 line and the slop is positive that means the trend is strong
When the ADX is below 0 line and the trend is weak you will see the slop negative and the color gray
When we see the SQ changing the color from Red to Yellow that means the sell pressure is decreasing this could be a potential buy signal
When we see the color changing from blue to dark blue that means the buy pressure is decreasing this could be a a potential sell signal
Bull/Bear divergences supported
Added SQ signal
this signal is an exponential moving average following the SQ main signal useful for filtering fake signals.
This indicator is very powerful but offers many fake signals it is recommended using this indicator with other indicators to confirm the entries

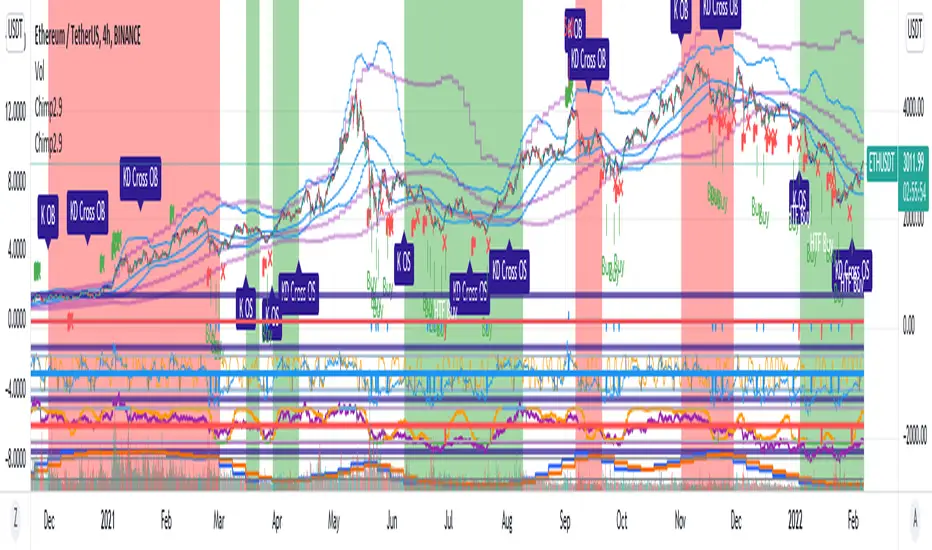
Chimpanzee V2.5 part A by joylay83Hi everyone, I am an amateur pinecoder. I would like to share my script which is coded with the intention of generating signals to send to 3commas webhook. It is still in development and revision.
This collection of indicators use:
Chart: 15m.
Inverse Fisher Transformation of the RSI to detect dips in the 15m timeframe.
Bollinger band (4H) to filter out false signals.
Triple EMA 21: to mimic price action for easier coding alerts. Currently not involved in generating signals. will be incorporated in the future.
StochRSI: As a visual filter. Currently not involved in generating signals. will be incorporated in the future.
Background will be green if stochRSI is low and red if stockRSI is high.
Candlesticks will be marked with a flag is TEMA breached BB.
One would need to play around with timeframes, BB settings and IFTRSI threshold for different signals.
There are 2 Signal Modes (with regards to IFTRSI):
Threshold: When price action falls below BB and IFTRSI hits buy threshold, a buy/sell signal is generated. Eg if IFTRSI buy threshold is set to -0.9, the buy signal will remain continuously positive as long as IFTRSI is < 0.9.
Cross: When price action falls below BB and IFTRSI hits threshold, nothing happens. It will wait until the IFTRSI cross back over the threshold before firing a signal.
There is another identical set of indicators running on a higher time frame (IFTRSI: 4H, BB: D or 3D, TEMA 21 4H) but on the same chart. This tend to generate less signals but are more reliable. A usage example would be to send a larger buy order if the signal comes from this higher time frame, or execute a sell order after multiple buys from the lower time frame.
It comes in 2 parts:
Part A: Contains overlay display. This displays BB, Triple EMA, buy/sell and StochRSI in labels. the labels are self explanatory.
Part B (please search for it): which is actually the same code but contain non-overlay display. You may also put part B overlay=true but scale to LEFT. The advantage of using overlay=true is that you can move the signal right over the candlesticks (mainly for troubleshooting/debugging). This part contains Inverse Fisher RSI, %B, Signal Line. %B is supposedly idential to Bollinger Bands in Part A.
By default, when there is a buy/sell signal:
lower time frame 15m: Signal Line in Part B will turn blue with a value 1 or -1 which corresponds to a buy or sell label in Part A
higher time frame 4H: Signal Line in Part B will turn red with a value 2 or -2 which corresponds to a HTF buy or sell label in Part A
Part A or B may be used to send signal to the webhook. You have to make sure that the settings of Part A and B are identical.
You may choose to un-display some items to reduce clutter.
Current problems:
1. Still too many buy signals
Although many times it will generate excellent buy signal at many swing lows, but there are many buy signals prior to a major swing low. This can be observed in the picture above. It also generate a couple of buy signals prior to the swing lows. I am currently experimenting with 20m and hourly timeframe to address this issue. More filters are needed eg an oscillator or detecting candlestick patterns.
2. Premature sell signals.
The sell signal is often generated at the beginning of a major bull run. My idea to solve this problem is to move to a higher timeframe and sell only when TEMA crossunder the upper bollinger band.
3. Lack of a backtester that can test multiple concurrent deals.
Buy -> Buy (average down) -> Buy (average down) -> Buy (average down) -> Sell
4. Lack of the ability to calculate average purchase price
Probably have to code it as a strategy
5. Display lag
As the browser is running 2 copies of the idential script, it tends to lag when you drag your chart around. So far there are no timeouts or delay in firing alerts to 3commas.
I do welcome any suggestion for improvement and constructive criticism. tqvm.
Credits : Thank you for doing an awesome job. I learnt a lot from your codes and tutorials.
Credits not listed in any order. If your code is used here and did not receive due credit, kindly drop me a note. tq.
Blessing 3 by JTA Today
@ZenAndTheArtOfTrading (extremely-easy-to-understand tutorials eg fixing repainting)
@LazyBear (various codes)
@Galactus-B Argo I
@TheTradingParrot (Inverse Fisher RSI and Gavin's backtester)
@zendog123 (backtester and various codes)
@ydeniz2000 (Bollinger Bands)
TradingView built-in scripts
EMA MTF PlusI like trading the 1 minute and 3 minutes time-frames. I'm what is commonly called a "scalper". Long term investments yes, I have some, but for trading, I don't have neither the time,
nor the patience to wait hours or days for my trade to be complete.
This doesn't mean I discount the higher time-frames, no, I actually rely heavily on them. I found that EMAs do a decent job as support/resistance, sometimes to a tick level of precision. And this is important for a 1 minute trader.
As such, I made this script that tracks the higher time-frames EMAs and displays the last value as a line.
I do not need the whole EMA, I'm not interested in crossovers or crossunders, these are anyway late signals for me.
What's with the triangles? These are local tops/bottoms , candles that have a have decent size of the wick. These tops and bottoms are by no means "final", they are merely a rejection at certain levels of price. Due to markets complexities (and human erratic behaviors hehe) these levels could be breached at the very next candle. For a more "final" version (nothing is really final but..) I added Schaff Trend Cycle as filter, so a triangle will pop only when a trend is mature enough ( STC with a value near 0 or near 100).
Colored bars. When the body of the candle is big, it shows strength. Strong bars tend to have follow through, especially when breaking key levels. The script looks at the body of the candle and compares it with ATR (Average True Range), if it's at least 0.8 of ATR it changes the bar color to yellow (bull candles) or fuchsia(bear candles).
Range identifier. This code is copied from Lazy Bear (if there are any issues please let me know), it's very useful in conjunction with colored bars.
I look for breakout candles that go outside of the range as a signal for a trade.
There are many ways in which this script can be useful, like trading mean reversions or momentum trades (breakouts) or simply trend following trades.
I hope you guys find it useful, you can play with default values and change them as you like, these are what I found to be working best for me and my trading universe (mostly crypto).
Special thanks for the original work of:
LazyBear
everget
Jim8080

Indicators Combination Framework v3 IND [DTU]Hello All,
This script is a framework to analyze and see the results by combine selected indicators for (long, short, longexit, shortexit) conditions.
I was designed this for beginners and users to facilitate to see effects of the technical indicators combinations on the chart WITH NO CODE
You can improve your strategies according the results of this system by connecting the framework to a strategy framework/template such as Pinecoder, Benson, daveatt or custom.
This is enhanced version of my previous indicator "Indicators & Conditions Test Framework "
Currently there are 93 indicators (23 newly added) connected over library. You can also import an External Indicator or add Custom indicator (In the source)
It is possible to change it from Indicator to strategy (simple one) by just remarking strategy parts in the source code and see real time profit of your combinations
Feel free to change or use it in your source
Special thanks goes to Pine wizards: Trading view (built-in Indicators), @Rodrigo, @midtownsk8rguy, @Lazybear, @Daveatt and others for their open source codes and contributions
SIMPLE USAGE
1. SETTING: Show Alerts= True (To see your entries and Exists)
2. Define your Indicators (ex: INDICATOR1: ema(close,14), INDICATOR2: ema(close,21), INDICATOR3: ema(close,200)
3. Define Your Combinations for long & Short Conditions
a. For Long: (INDICATOR1 crossover INDICATOR2) AND (INDICATOR3 < close)
b. For Short: (INDICATOR1 crossunder INDICATOR2) AND (INDICATOR3 > close)
4. Select Strategy/template (Import strategy to chart) that you export your signals from the list
5. Analyze the best profit by changing Indicators values
SOME INDICATORS DETAILS
Each Indicator includes:
- Factorization : Converting the selected indicator to Double, triple Quadruple such as EMA to DEMA, TEMA QEMA
- Log : Simple or log10 can be used for calculation on function entries
- Plot Type : You can overlay the indicator on the chart (such ema) or you can use stochastic/Percentrank approach to display in the variable hlines range
- Extended Parametes : You can use default parameters or you can use extended (P1,P2) parameters regarding to indicator type and your choice
- Color : You can define indicator color and line properties
- Smooth : you can enable swma smooth
- indicators : you can select one of the 93 function like ema(),rsi().. to define your indicator
- Source : you can select from already defined indicators (IND1-4), External Indicator (EXT), Custom Indicator (CUST), and other sources (close, open...)
CONDITION DETAILS
- There are are 4 type of conditions, long entry, short entry, long exit, short exit.
- Each condition are built up from 4 combinations that joined with "AND" & "OR" operators
- You can see the results by enabling show alerts check box
- If you only wants to enter long entry and long exit, just fill these conditions
- If "close on opposite" checkbox selected on settings, long entry will be closed on short entry and vice versa
COMBINATIONS DETAILS
- There are 4 combinations that joined with "AND" & "OR" operators for each condition
- combinations are built up from compare 1st entry with 2nd one by using operator
- 1st and 2nd entries includes already defined indicators (IND1-5), External Indicator (EXT), Custom Indicator (CUST), and other sources (close, open...)
- Operators are comparison values such as >,<, crossover,...
- 2nd entry include "VALUE" parameter that will use to compare 1st indicator with value area
- If 2nd indicator selected different than "VALUE", value are will mean previous value of the selection. (ex: value area= 2, 2nd entry=close, means close )
- Selecting "NONE" for the 1st entry will disable calculation of current and following combinations
JOINS DETAILS
- Each combination will join wiht the following one with the JOIN (AND, OR) operator (if the following one is not equal "NONE")
CUSTOM INDICATOR
- Custom Indicator defines harcoded in the source code.
- You can call it with "CUST" in the Indicator definition source or combination entries source
- You can change or implement your custom indicator by updating the source code
EXTERNAL INDICATOR
- You can import an external indicator by selecting it from the ext source.
- External Indicator should be already imported to the chart and it have an plot function to output its signal
EXPORTING SIGNAL
- You can export your result to an already defined strategy template such as Pine coders, Benson, Daveatt Strategy templates
- Or you can define your custom export for other future strategy templates
ALERTS
- By enabling show alerts checkbox, you can see long entry exits on the bottom, and short entry exits aon the top of the chart
ADDITIONAL INFO
- You can see all off the inputs descriptions in the tooltips. (You can also see the previous version for details)
- Availability to set start, end dates
- Minimize repainting by using security function options (Secure, Semi Secure, Repaint)
- Availability of use timeframes
-
Version 3 INDICATORS LIST (More to be added):
▼▼▼ OVERLAY INDICATORS ▼▼▼
alma(src,len,offset=0.85,sigma=6).-------Arnaud Legoux Moving Average
ama(src,len,fast=14,slow=100).-----------Adjusted Moving Average
accdist().-------------------------------Accumulation/distribution index.
cma(src,len).----------------------------Corrective Moving average
dema(src,len).---------------------------Double EMA (Same as EMA with 2 factor)
ema(src,len).----------------------------Exponential Moving Average
gmma(src,len).---------------------------Geometric Mean Moving Average
highest(src,len).------------------------Highest value for a given number of bars back.
hl2ma(src,len).--------------------------higest lowest moving average
hma(src,len).----------------------------Hull Moving Average.
lagAdapt(src,len,perclen=5,fperc=50).----Ehlers Adaptive Laguerre filter
lagAdaptV(src,len,perclen=5,fperc=50).---Ehlers Adaptive Laguerre filter variation
laguerre(src,len).-----------------------Ehlers Laguerre filter
lesrcp(src,len).-------------------------lowest exponential esrcpanding moving line
lexp(src,len).---------------------------lowest exponential expanding moving line
linreg(src,len,loffset=1).---------------Linear regression
lowest(src,len).-------------------------Lovest value for a given number of bars back.
mcginley(src, len.-----------------------McGinley Dynamic adjusts for market speed shifts, which sets it apart from other moving averages, in addition to providing clear moving average lines
percntl(src,len).------------------------percentile nearest rank. Calculates percentile using method of Nearest Rank.
percntli(src,len).-----------------------percentile linear interpolation. Calculates percentile using method of linear interpolation between the two nearest ranks.
previous(src,len).-----------------------Previous n (len) value of the source
pivothigh(src,BarsLeft=len,BarsRight=2).-Previous pivot high. src=src, BarsLeft=len, BarsRight=p1=2
pivotlow(src,BarsLeft=len,BarsRight=2).--Previous pivot low. src=src, BarsLeft=len, BarsRight=p1=2
rema(src,len).---------------------------Range EMA (REMA)
rma(src,len).----------------------------Moving average used in RSI. It is the exponentially weighted moving average with alpha = 1 / length.
sar(start=len, inc=0.02, max=0.02).------Parabolic SAR (parabolic stop and reverse) is a method to find potential reversals in the market price direction of traded goods.start=len, inc=p1, max=p2. ex: sar(0.02, 0.02, 0.02)
sma(src,len).----------------------------Smoothed Moving Average
smma(src,len).---------------------------Smoothed Moving Average
super2(src,len).-------------------------Ehlers super smoother, 2 pole
super3(src,len).-------------------------Ehlers super smoother, 3 pole
supertrend(src,len,period=3).------------Supertrend indicator
swma(src,len).---------------------------Sine-Weighted Moving Average
tema(src,len).---------------------------Triple EMA (Same as EMA with 3 factor)
tma(src,len).----------------------------Triangular Moving Average
vida(src,len).---------------------------Variable Index Dynamic Average
vwma(src,len).---------------------------Volume Weigted Moving Average
volstop(src,len,atrfactor=2).------------Volatility Stop is a technical indicator that is used by traders to help place effective stop-losses. atrfactor=p1
wma(src,len).----------------------------Weigted Moving Average
vwap(src_).------------------------------Volume Weighted Average Price (VWAP) is used to measure the average price weighted by volume
▼▼▼ NON OVERLAY INDICATORS ▼▼
adx(dilen=len, adxlen=14, adxtype=0).----adx. The Average Directional Index (ADX) is a used to determine the strength of a trend. len=>dilen, p1=adxlen (default=14), p2=adxtype 0:ADX, 1:+DI, 2:-DI (def:0)
angle(src,len).--------------------------angle of the series (Use its Input as another indicator output)
aroon(len,dir=0).------------------------aroon indicator. Aroons major function is to identify new trends as they happen.p1 = dir: 0=mid (default), 1=upper, 2=lower
atr(src,len).----------------------------average true range. RMA of true range.
awesome(fast=len=5,slow=34,type=0).------Awesome Oscilator is an indicator used to measure market momentum. defaults : fast=len= 5, p1=slow=34, p2=type: 0=Awesome, 1=difference
bbr(src,len,mult=1).---------------------bollinger %%
bbw(src,len,mult=2).---------------------Bollinger Bands Width. The Bollinger Band Width is the difference between the upper and the lower Bollinger Bands divided by the middle band.
cci(src,len).----------------------------commodity channel index
cctbbo(src,len).-------------------------CCT Bollinger Band Oscilator
change(src,len).-------------------------A.K.A. Momentum. Difference between current value and previous, source - source . is most commonly referred to as a rate and measures the acceleration of the price and/or volume of a security
cmf(len=20).-----------------------------Chaikin Money Flow Indicator used to measure Money Flow Volume over a set period of time. Default use is len=20
cmo(src,len).----------------------------Chande Momentum Oscillator. Calculates the difference between the sum of recent gains and the sum of recent losses and then divides the result by the sum of all price movement over the same period.
cog(src,len).----------------------------The cog (center of gravity) is an indicator based on statistics and the Fibonacci golden ratio.
copcurve(src,len).-----------------------Coppock Curve. was originally developed by Edwin Sedge Coppock (Barrons Magazine, October 1962).
correl(src,len).-------------------------Correlation coefficient. Describes the degree to which two series tend to deviate from their ta.sma values.
count(src,len).--------------------------green avg - red avg
cti(src,len).----------------------------Ehler s Correlation Trend Indicator by
dev(src,len).----------------------------ta.dev() Measure of difference between the series and its ta.sma
dpo(len).--------------------------------Detrended Price OScilator is used to remove trend from price.
efi(len).--------------------------------Elders Force Index (EFI) measures the power behind a price movement using price and volume.
eom(len=14,div=10000).-------------------Ease of Movement.It is designed to measure the relationship between price and volume.p1 = div: 10000= (default)
falling(src,len).------------------------ta.falling() Test if the `source` series is now falling for `length` bars long. (Use its Input as another indicator output)
fisher(len).-----------------------------Fisher Transform is a technical indicator that converts price to Gaussian normal distribution and signals when prices move significantly by referencing recent price data
histvol(len).----------------------------Historical volatility is a statistical measure used to analyze the general dispersion of security or market index returns for a specified period of time.
kcr(src,len,mult=2).---------------------Keltner Channels Range
kcw(src,len,mult=2).---------------------ta.kcw(). Keltner Channels Width. The Keltner Channels Width is the difference between the upper and the lower Keltner Channels divided by the middle channel.
klinger(type=len).-----------------------Klinger oscillator aims to identify money flow’s long-term trend. type=len: 0:Oscilator 1:signal
macd(src,len).---------------------------MACD (Moving Average Convergence/Divergence)
mfi(src,len).----------------------------Money Flow Index s a tool used for measuring buying and selling pressure
msi(len=10).-----------------------------Mass Index (def=10) is used to examine the differences between high and low stock prices over a specific period of time
nvi().-----------------------------------Negative Volume Index
obv().-----------------------------------On Balance Volume
pvi().-----------------------------------Positive Volume Index
pvt().-----------------------------------Price Volume Trend
ranges(src,upper=len, lower=-5).---------ranges of the source. src=src, upper=len, v1:lower=upper . returns: -1 source=upper otherwise 0
rising(src,len).-------------------------ta.rising() Test if the `source` series is now rising for `length` bars long. (Use its Input as another indicator output)
roc(src,len).----------------------------Rate of Change
rsi(src,len).----------------------------Relative strength Index
rvi(src,len).----------------------------The Relative Volatility Index (RVI) is calculated much like the RSI, although it uses high and low price standard deviation instead of the RSI’s method of absolute change in price.
smi_osc(src,len,fast=5, slow=34).--------smi Oscillator
smi_sig(src,len,fast=5, slow=34).--------smi Signal
stc(src,len,fast=23,slow=50).------------Schaff Trend Cycle (STC) detects up and down trends long before the MACD. Code imported from
stdev(src,len).--------------------------Standart deviation
trix(src,len) .--------------------------the rate of change of a triple exponentially smoothed moving average.
tsi(src,len).----------------------------The True Strength Index indicator is a momentum oscillator designed to detect, confirm or visualize the strength of a trend.
ultimateOsc(len.-------------------------Ultimate Oscillator indicator (UO) indicator is a technical analysis tool used to measure momentum across three varying timeframes
variance(src,len).-----------------------ta.variance(). Variance is the expectation of the squared deviation of a series from its mean (ta.sma), and it informally measures how far a set of numbers are spread out from their mean.
willprc(src,len).------------------------Williams %R
wad().-----------------------------------Williams Accumulation/Distribution.
wvad().----------------------------------Williams Variable Accumulation/Distribution.
HISTORY
v3.01
ADD: 23 new indicators added to indicators list from the library. Current Total number of Indicators are 93. (to be continued to adding)
ADD: 2 more Parameters (P1,P2) for indicator calculation added. Par:(Use Defaults) uses only indicator(Source, Length) with library's default parameters. Par:(Use Extra Parameters P1,P2) use indicator(Source,Length,p1,p2) with additional parameters if indicator needs.
ADD: log calculation (simple, log10) option added on indicator function entries
ADD: New Output Signals added for compatibility on exporting condition signals to different Strategy templates.
ADD: Alerts Added according to conditions results
UPD: Indicator source inputs now display with indicators descriptions
UPD: Most off the source code rearranged and some functions moved to the new library. Now system work like a little bit frontend/backend
UPD: Performance improvement made on factorization and other source code
UPD: Input GUI rearranged
UPD: Tooltips corrected
REM: Extended indicators removed
UPD: IND1-IND4 added to indicator data source. Now it is possible to create new indicators with the previously defined indicators value. ex: IND1=ema(close,14) and IND2=rsi(IND1,20) means IND2=rsi(ema(close,14),20)
UPD: Custom Indicator (CUST) added to indicator data source and Combination Indicator source.
UPD: Volume added to indicator data source and Combination Indicator source.
REM: Custom indicators removed and only one custom indicator left
REM: Plot Type "Org. Range (-1,1)" removed
UPD: angle, rising, falling type operators moved to indicator library

[5F] Multi clocks📋 Description :
This script displays three customizable clocks.
You can use it on chart too.
Works only in real time, not for replay.
🛠 Options :
Activate or not each clock
Time zone
Color and size in % of text and background
The script can be placed on the chart and in this case it is possible to change the position of each clock
Thanks to all Pinecoders who share their work with the community, in particular (non exhaustive list) :
LonesomeTheBlue, RafaelZioni, dgtrd, allanster, JayRogers , ChuckBanger, cheatcountry, NeoButane, ChrisMoody, QuantTherapy, J-Streak, makit0, john_everist, JustUncleL, everget, Duyck, KivancOzbilgic, LucF, HammondB3, blackcat1402, alexgrover, Mohamed3nan, DonovanWall, RicardoSantos, LazyBear, PRO_Indicators, theheirophant, midtownsk8rguy, e2e4mfck, SeaSide420, xel_arjona, RagingRocketBull, yatrader2, racer8, xdecow, Daveatt, QuantNomad, ceyhun, BigBitsIO, tista, aamonkey, rthomson, bgeraghty, pAulseperformance, rumpypumpydumpy
Another example :

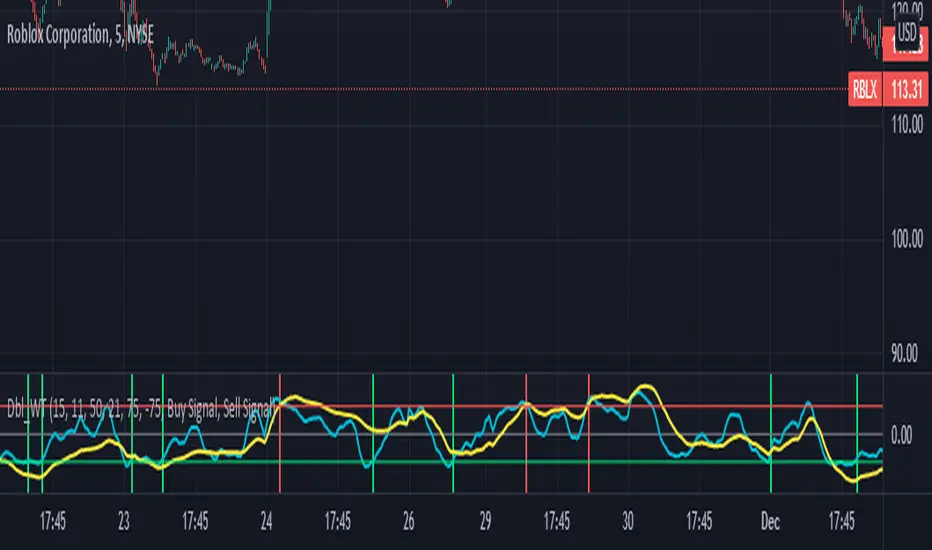
Double wave-trend Oscillator Buy/Sell signalsBINANCE:ROSEUSDT
This script attempts to use Wave Trend Oscillator's of different lengths in order to identify trade entries and exits for bullish trades. This indicator is strongly recommended to be used with volatile assets or on large time interval charts. You use this script by entering a trade when it signals a green block and exiting when it signals red although these signals could potentially be used as trend reversal signals instead. The script uses two wave trend oscillator's the lengths of which can be edited in the settings, but the general idea is that one is fast and one is slow and these indicate when to buy/sell when they crossover the overbought/sold lines. In the setting you can choose whether the fast or the slow line will be used for buy signal and the other is then used to signal selling. By default this will be ticked on indicating that the fast line crossing over the oversold level will be used for buy signals, if it is ticked off the slow line will be used. The other tickbox is for whether the line used for selling will signal when it first crosses over the overbought line or whether it should signal then it crosses back under the overbought line after having crossed over it, the default value is off indicating that it will signal when it crosses back under the overbought level. The overbought/sold levels should be tweaked on a per asset basis to get the best quality signals.
The original code for the Wave Trend Oscillator comes from LazyBear and was modified and built on to create this indicator.
Jurik MacD & Leader NCMhey everyone,
While there are some Invite-Only Jurik MacDs, there are no free/open ones, so I thought I'd create one and publish it. It has most of the bells and whistles you'd want (I hope!).
You can see one with the bells and whistles all turned on in the first, and a 'quieter' one in the second.
//-----------------////-----------------////-----------------//
Why Jurik?
The Jurik MA is a quicker and smoother Exponential MA, and the best of all MAs, according to Jurik Research (lol). To be fair. I have found it to be excellent, and that is why I'm publishing this.
Power can be changed, recommended from 1-4: increasing it pulls it closer to the current price (almost like reducing the period), and decreasing: vice versa.
Phase increases the inertia of the line, how quickly it will respect price changes. It is usual to have less inertia on the fast JMA, and more on the slower (but remember the MACD line is the FastJMA minus the SlowJMA, so you may find adjusting power and phase on Signal line more effective). Search online for JurikRes (or Jurik Research) for more detailed information about the Jurik.
In the coding I have included a list of four different ways to set up the JMAs: however, you should probably tune this to your preferred asset (as with almost all indicators). If you find a good setup, please let me know!
You could trade with a MacD a number of ways. Entries could be:
- MacD crossing the zero line
- MacD crossing over the Signal line
- Histogram crossing above zero line.
Vice versa for exits. If this isn't enough, please google 'trading with a MacD'.
No indicator is perfect for trading, and that includes this one! Don't trade unless you know what you're doing.
//-----------------////-----------------////-----------------//
Please let me know if I can improve this script, or you have any other feedback. I can post code for colour palette as well if that is something anyone is keen on.
//-----------------////-----------------////-----------------//
Thanks to the many excellent coders that publish freely their code. I have learned so much from this community, and this code is based on the work of others (Chris Moody and everget).
Shout out to StevieMagg as well, who has helped me develop (and didn't want to charge me!). The Pine Script Community on Discord has been brilliant - lots of knowledge, ideas, support - thanks guys.
If you are new and interested in pine coding, I suggest you check out some of the masters (in no order):
ChrisMoody
Everget
RedKTrader
LonesomeDove
LazyBear
KivancOzbilgic
and more that I am missing. It is not necessarily the popular scripts that are the best.
//-----------------////-----------------////-----------------//
Kind regards,
Nelson

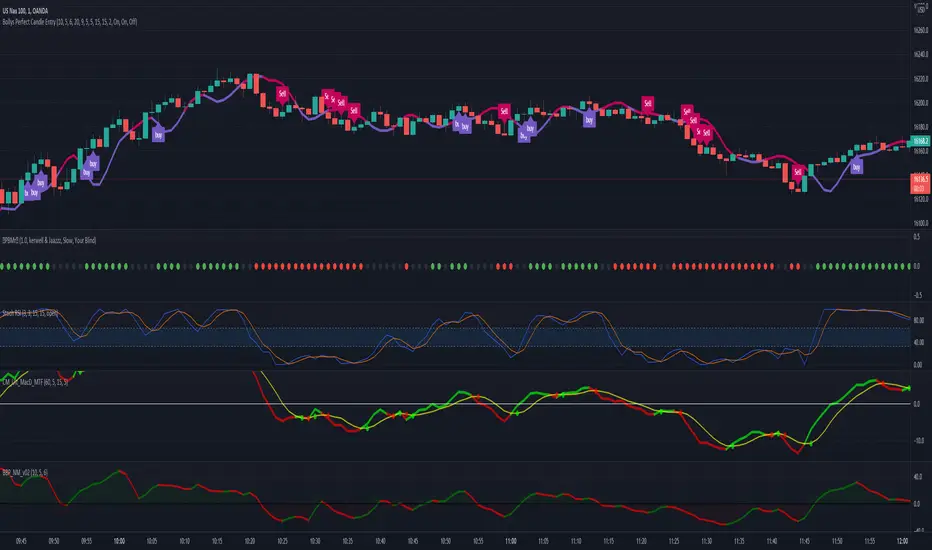
Bollys Perfect Candle EntryThis source code is subject to the terms of the Mozilla Public License 2.0 at mozilla.org
This indicator is a combination of multiple open sources indicators
Squeeze Momentum Indicator SQZMOM_LB
Improved Linear Regression Bull and Bear Power v02 BBP_NM_v02
Cheezus by matheaufx
INDIGO - Cloud System ©INDIGO Cloud System ©
This script shows the monthly dip and peak zones and the daily highs & lows.
The green zone is the dip zone. It's the place to enter a long position if you think there is or will be a reversal.
The red zone is the peak zone. It's the place to enter a short position if you think there is or will be a reversal.
The script uses the INDIGO Cloud System ©, the Ultimate RSI and the Market Direction Indicator to find an entry at the most optimal point in space and time.
The exit for the long trade is on the purple line and the exit for the short trade is on the blue line.
It also has an RSI exit to minimize the risk of a sudden reversal in the wrong direction while in trade.
You can set TP and SL to see the effects of it on the chart. Be aware that these change a lot of trades so use it wisely.
The labels are connected to alerts to notify you of a possible entry or exit.
This script uses the Ultimate RSI by ChrisMoody, thanks for creating this Chris !
This script also uses the Market Direction Indicator by LazyBear, great script !
You can use the MD Filter to filter out some bad trades. It decreases losses but also some profits.
Experiment with the settings, each pairing needs different settings.
--> Use this script at your own risk. Do your own research, never invest money you're not willing to lose and never put your trust in one indicator !
To my best knowledge this script doesn't repaint. I never use the close and only use high/low when value can't be untrue again. If you find repainting in this script PLEASE let me know !
Feel free to contact me for questions or feedback.
Enjoy the script :)

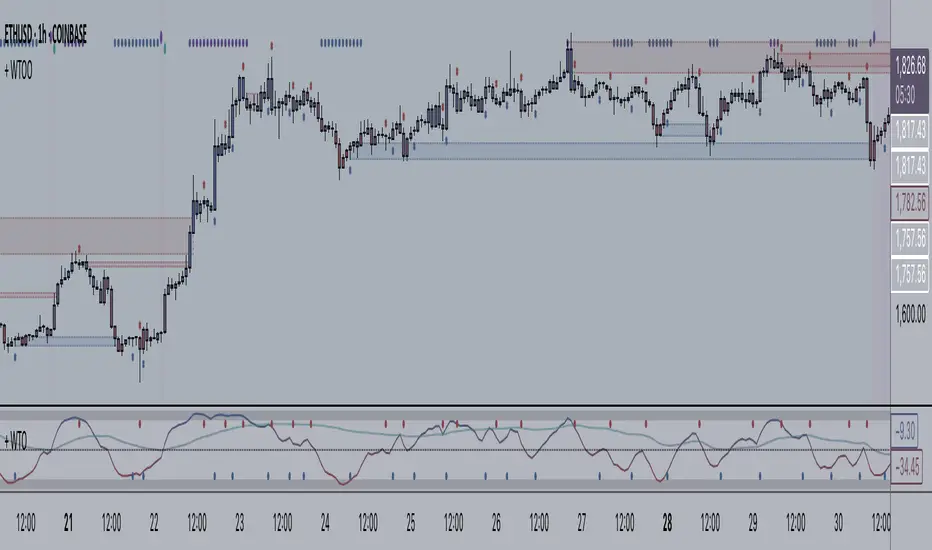
+ WaveTrend Oscillator OverlayAn overlay version of pertinent signals from my version of LazyBear's Wavetrend Oscillator.
Shows momentum of long period WTO as either background colors or symbols.
Shows continuation and reversal trade signals.
If Secondary WTO is above the center line (momentum is long), then symbols print across the top of the chart when the primary (faster) WTO comes into "oversold," a number associated with a horizontal line on the off-chart indicator. This number is selectable via a drop-down menu. Same thing for bearish momentum.
Conversely, reversal signals are printed along the bottom when conditions are met. Ex: if the Secondary WTO is showing momentum is bullish, then symbols will print along the bottom when the primary WTO is at "overbought" (or whatever number you deem overbought--again, via a similar drop-down menu).
Also, symbols are printed above and below candles for when the moving average of the primary WTO is crossed.
You could use these for taking profits, exiting a trade, or entering a trade.
Includes a moving average that is an average of the 200 EMA, SMA and Kijun.
Alerts.
Enjoy.
//p.s. I recommend using this in conjunction with my "+ Wavetrend Oscillator" at least starting out. Helps to have a visual
//reference when picking reversal and continuation numbers.
SQZ Multiframe StrategyThis is a first attempt to automate what my current strategy when trading is.
It uses 2 timeframes: the one you are currently using to see the chart and an "anchor trend" which is a higher order frame.
Supported timeframes are: 1m, 5m, 15m, 30m, 1H, 4H, 1D, 1W
The Strategy relies on two indicators:
Squeeze Momentum Indicator
CMF
How does it works?
It looks for a moment when the following conditions are met.
For Long:
Positive directionality in SQZM monitor in anchor timeframe
Positive directionality in SQZM monitor in current timeframe
Recent minimum in CMF
For Short:
Negative directionality in SQZM monitor in anchor timeframe
Negative directionality in SQZM monitor in current timeframe
Recent maximum in CMF
After a BUY or SELL order is executed the plot will start showing two lines: A TP line, and a SL line.
The TP and SL move dynamically based on a greedy algorithm based on 3 input parameters.
Min Profit to Start Moving SL (%): Sets an initial target for the trade.
Maximum Possible of SL (%): This is the maximum amount possible for SL. If volatility is not too high, a shorter SL will be chosen based on Kaufman's Stops method
Take profit factor: Is how much portion of the target I am taking as profit once the target is reached
Example for 5% Min profit:
When the first target is reached (+5%), the SL will be updated to 2.5% over the enter price.
When the second target is reached (+10%), the SL will be updated to 5% over the enter price.
Note: The strategy might abandon the position prematurely if a contrary signal is received while the trade is opened, and will change direction.
The Strategy has been backtested mostly for crypto. It might be good for stocks too, but the parameters mentioned might need some adjustments since price moves at a different rate.
Recommended timeframe is 4H for BTC , and 30min/1H for alts.
Comments and ideas are more than welcome!

CM_Twiggs Money FlowFull Credit goes to LazyBear for publishing Original Code.
I added:
Threshold lines that changes the color of Histogram based on if it exceeds Threshold lines. Ability to turn off and on.
Ability to Turn Histogram Off/On
Ability to turn Twiggs Money Flow Line Off/On

MTF VWAPA simple wavetrend oscillator based off WaveTrend Oscillator by @LazyBear to visualise 4 different timeframe vwap under 1 chart.
Timeframe can be changed in indicator settings in minutes. Unnecessary waves can be removed by unchecking said TF wave in Style settings.

Premier Stochastic Oscillator (PSO) [andre_007]This is a improved version of Premier Stochastic Oscillator (PSO), coded by "LazyBear".
"The indicator was first introduced by technical analyst Lee Leibfarth in the August 2008 issue of the journal Technical Analysis of Stocks & Commodities".
Inprovements:
The script was update to version 4 of PineScript.
Added support for diferents times frames.
For example, now it's possible to stay in intraday and at same time see a weekly version of this indicator.
Possibility to customize the thresholds.
Introduction to indicator:
"Stochastic oscillators have long been used to help traders and investors identify areas where trend changes are likely.
Leibfarth developed the PSO to take advantage of a standard stochastic oscillator's strengths while enhancing it to become more reactive to market activity.
The result is a faster indicator that provides earlier signals for potential trend changes".
More info:
www.investopedia.com

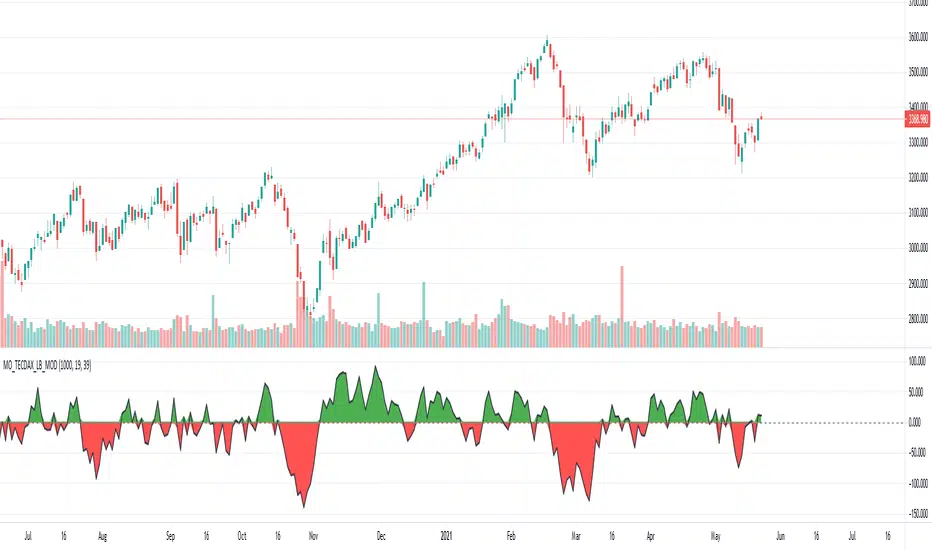
[Unxi]McClellan Oscillator for TECDAX [modified]This version is for use with the German TecDax index only!
About McClellan Oscillator
Developed by Sherman and Marian McClellan, the McClellan Oscillator is a breadth indicator derived from Net Advances, the number of advancing issues less the number of declining issues. Subtracting the 39-day exponential moving average of Net Advances from the 19-day exponential moving average of Net Advances forms the oscillator.
As the formula reveals, the McClellan Oscillator is a momentum indicator that works similar to MACD .
McClellan Oscillator signals can be generated with breadth thrusts, centerline crossovers, overall levels and divergences.
About my version
This version here is a modification, though:
- It can only be used on the German TECDAX index
- It only considers the TECDAX stocks
- The data window will provide a summary about rising and declining stocks
- The data window will output the last change for each of the 30 stocks
The script is pretty slow because it has to calculate the change for each bar individually (instead of receiving a complete calculation from the stock exchange).
This script will work on any time period. Just use whatever timeperiod you are comfortable with, the indicator will automatically adjust accordingly. It is recommended to use it with timeperiod = 1d, though.
DISCLAIMER
This script was mainly written for educational purposes (training myself how to write custom indicatotors).
As you can see, the code is really messy. Feel free to provide your feedback in the comments!
Credits
Based on the simple version of aftabmk
You can find the original version by searching for McClellan Oscillator for nifty 50.
Also got some inspiration from lazybear's version and from danarn's "Crypto McClellan Oscillator".
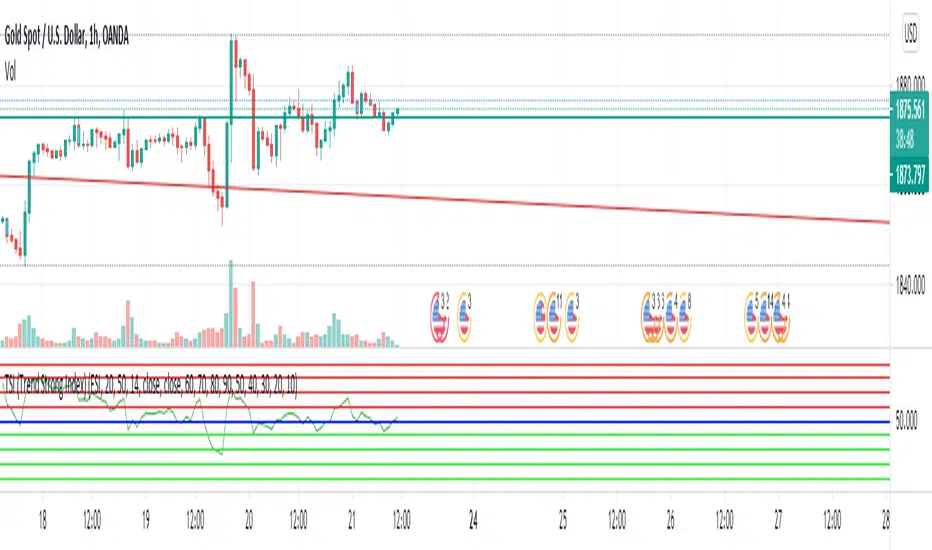
TSI (Trend Strong Index) I use LazyBear's WT_cross indicator to confirm signal. I thing your should use this indicator with Divergence or Fibonacci to open order.
Squeeze Momentum Indicator MTF with alerts [lazy bear]MTF version of the popular squeeze momentum indicator, created and shared by Lazy Bear
