ICT Institutional Order Flow (Riz)This indicator implements Inner Circle Trader (ICT) institutional order flow concepts to identify high-probability entry points where smart money is actively participating in the market. It combines volume analysis, market structure, and price action patterns to detect institutional accumulation and distribution zones.
Core Concepts & Methodology
1. Institutional Order Blocks Detection
Order blocks represent the last opposing candle before a strong directional move, indicating institutional accumulation (bullish) or distribution (bearish) zones.
How it works:
⦁ Identifies the final bearish candle before bullish expansion (accumulation)
⦁ Identifies the final bullish candle before bearish expansion (distribution)
⦁ Validates with volume spike (2x average) to confirm institutional participation
⦁ Requires minimum 0.5% price displacement to filter weak moves
⦁ Tracks these zones as future support/resistance levels
2. Fair Value Gap (FVG) Analysis
FVGs are price inefficiencies created by aggressive institutional orders that leave gaps in price action.
Detection method:
⦁ Bullish FVG: When current low > high from 2 bars ago
⦁ Bearish FVG: When current high < low from 2 bars ago
⦁ Minimum gap size filter (0.1% default) eliminates noise
⦁ Monitors gap fills with volume for entry signals
⦁ Gaps act as magnets drawing price back for "rebalancing"
3. Liquidity Hunt Detection
Institutions often trigger retail stop losses before reversing direction, creating liquidity for their positions.
Algorithm:
⦁ Calculates rolling 20-period highs/lows as liquidity pools
⦁ Detects wicks beyond these levels (0.1% sensitivity)
⦁ Identifies rejection back inside range (liquidity grab)
⦁ Volume spike confirmation ensures institutional involvement
⦁ These reversals often mark significant turning points
4. Volume Profile Integration
Analyzes volume distribution across price levels to identify institutional interest zones.
Components:
⦁ Point of Control (POC): Price level with highest volume (institutional consensus)
⦁ Value Area: 70% of volume range (institutional comfort zone)
⦁ Uses 50-bar lookback to build volume histogram
⦁ 20 price levels for granular distribution analysis
5. Market Structure Analysis
Determines overall trend bias using pivot points and swing analysis.
Process:
⦁ Identifies swing highs/lows using 3-bar pivots
⦁ Bullish structure: Price above last swing high
⦁ Bearish structure: Price below last swing high
⦁ Filters signals to trade with institutional direction
Signal Generation Logic
BUY signals trigger when ANY condition is met:
1. Order Block Formation: Bearish-to-bullish transition + volume spike + strong move
2. Liquidity Grab Reversal: Sweep below lows + recovery + volume spike
3. FVG Fill: Price fills bullish gap with institutional volume (within 3 bars)
4. Order Block Respect: Price bounces from previous bullish OB + volume
SELL signals trigger when ANY condition is met:
1. Order Block Formation: Bullish-to-bearish transition + volume spike + strong move
2. Liquidity Grab Reversal: Sweep above highs + rejection + volume spike
3. FVG Fill: Price fills bearish gap with institutional volume (within 3 bars)
4. Order Block Respect: Price rejects from previous bearish OB + volume
Additional filters:
⦁ Signals align with market structure (no counter-trend trades)
⦁ No new signals while position is active
⦁ All signals require volume confirmation (institutional fingerprint)
Trading Style Auto-Configuration
The indicator features intelligent preset configurations for different trading styles:
Scalping Mode (1-5 min charts):
⦁ Volume multiplier: 1.5x (more signals)
⦁ Tighter parameters for quick trades
⦁ Risk:Reward 1.5:1, ATR multiplier 1.0
Day Trading Mode (15-30 min charts):
⦁ Volume multiplier: 1.7x (balanced)
⦁ Medium sensitivity settings
⦁ Risk:Reward 2:1, ATR multiplier 1.5
Swing Trading Mode (1H-4H charts):
⦁ Volume multiplier: 2.0x (quality focus)
⦁ Conservative parameters
⦁ Risk:Reward 3:1, ATR multiplier 2.0
Custom Mode:
⦁ Full manual control of all parameters
Visual Components
⦁ Order Blocks: Colored rectangles (green=bullish, red=bearish)
⦁ Fair Value Gaps: Orange boxes showing imbalances
⦁ Liquidity Levels: Dashed blue lines at key highs/lows
⦁ Volume Spikes: Yellow background highlighting
⦁ POC Line: Orange line showing highest volume price
⦁ Value Area: Blue shaded zone of 70% volume
⦁ Buy/Sell Signals: Triangle markers with text labels
⦁ Stop Loss/Take Profit: Dotted lines (red/green)
Information Panel
Real-time dashboard displaying:
⦁ Current trading mode
⦁ Volume ratio (current vs average)
⦁ Market structure (bullish/bearish)
⦁ Active order blocks count
⦁ Position status
⦁ Configuration details
How to Use
Step 1: Select Trading Style
Choose your style in settings - all parameters auto-adjust
Step 2: Timeframe Selection
⦁ Scalping: 1-5 minute charts
⦁ Day Trading: 15-30 minute charts
⦁ Swing: 1H-4H charts
Step 3: Signal Interpretation
⦁ Wait for BUY/SELL markers
⦁ Check volume ratio >2 for strong signals
⦁ Verify market structure alignment
⦁ Note automatic SL/TP levels
Step 4: Risk Management
⦁ Default 2:1 risk:reward (adjustable)
⦁ Stop loss: 1.5x ATR from entry
⦁ Position sizing based on stop distance
Best Practices
1. Higher probability setups occur when multiple conditions align
2. Volume confirmation is crucial - avoid signals without volume spikes
3. Trade with structure - longs in bullish, shorts in bearish structure
4. Monitor POC - acts as dynamic support/resistance
5. Confluence zones where OBs, FVGs, and liquidity levels overlap are strongest
Important Notes
⦁ Not a standalone system - combine with your analysis
⦁ Works best in trending markets with clear structure
⦁ Adjust settings based on instrument volatility
⦁ Backtest thoroughly on your specific markets
⦁ Past performance doesn't guarantee future results
Alerts Available
⦁ ICT Buy Signal
⦁ ICT Sell Signal
⦁ Volume Spike Detection
⦁ Liquidity Grab Detection
This indicator provides a systematic approach to ICT concepts, helping traders identify where institutions are entering positions through volume analysis and key price action patterns. The auto-configuration feature ensures optimal settings for your trading style without manual adjustment.
Disclaimer
This tool is for educational and research purposes only. It is not financial advice, nor does it guarantee profitability. All trading involves risk, and users should test thoroughly before applying live.
"Inner circle trader " için komut dosyalarını ara

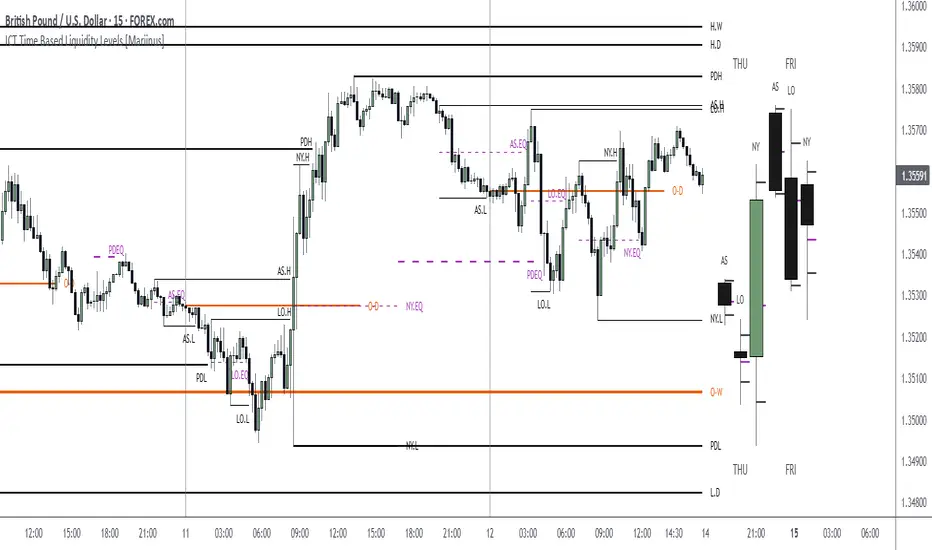
ICT Time Based Liquidity Levels [Mariinus]Indicator Overview – Inspired by ICT Concepts
This indicator helps you spot where liquidity rests and where major price moves are likely to begin or end — giving you clarity for both entries and exits.
Inspired by the teachings of the Inner Circle Trader (ICT), this tool builds on his philosophies and principles that have reshaped how traders view price action. One of the most powerful lessons that stuck with me personally is his quote:
"Time & Price, where it is Time first and then Price”
Another fundamental concept that underpins this tool is the idea that:
"Price is constantly moving in cycles from Premium to Equilibrium, from Equilibrium to Discount from Discount back to Premium."
With these core ideas in mind, this indicator was developed to help traders who are already using an ICT-based framework and focus on Kill Zones and by this on Time Based Liquidity.
In addition to plotting Session Highs and Lows on your chart, the ICT Time Based Liquidity Levels indicator also includes derived levels that provide deeper market insight. These include the Equilibrium of the full Session Range (High to Low) as well as the Equilibrium of the Wicks – offering a more nuanced view of price balance and potential turning points, in line with ICT’s core concepts.
To make sure your chart is not cluttered with lines, you can select which levels to show – and more importantly – you can plot Session Candles next to your Chart. Unlike standard time-based candles (e.g. 4H candles), these are “true” Session Candles that reflect the actual OHLC of trading Sessions, making it easier and clearer to see how Sessions interact with each other.
Next to Intraday Highs and Lows, the indicator will also plot Daily and Weekly Liquidity Pools above and below the Market, giving you insights to where Price is most likely heading towards.
You can set Alerts that trigger whenever one of these key levels is tagged, so you stay focused without staring at the screen all day.
⚠️ Important Disclaimer:
This is not a standalone trading plan.
This is not a buy or sell signal generator.
Instead, this tool is designed to support traders who follow ICT principles by helping them identify higher-probability PD Arrays – the key levels where setups are more likely to occur. If your trading plan includes looking for specific PD Arrays and structural frameworks taught by ICT, then this indicator is a visual aid to refine and focus your attention on the areas where your framework has a higher probability of playing out.
⚙️ Explanation of the Settings
You can combine up to 6 Sessions to monitor their respective levels while operating on a lower timeframe. You can define the timings and a long and short naming of those Sessions.
In the Days Section you can Set a lookback period to control how far back you want to calculate levels. Next to that you can select which Daily and or Weekly Levels you want to have shown on your Charts together with choosing their coloring, style and width.
In the Candles Section you can define how the Session Candles will look like which are plotted next to your Chart. When you have multiple Days of Session Candles it can come in handy to mirror image the Candles which will plot the Candles from right to left instead of the default left to right. In addition you can control how far the distance is between the Candles and your chart, the distance between Candles and Days and the thickness of those Candles. Next you can show or hide the Equilibrium of the total Session Range and the Equilibrium of the Wicks.
In the Lines Section you can specify which Session Levels you want to see on your Chart together with choosing their coloring, style and width.
In the Labels Section you can specify which Labels you want to show and how you want to show them.
In the Openings Section you can specify to show the Midnight Open and or Weekly Open. In addition you can add a divider to be able to distinguish between multiple Days or Weeks.
In the Alert Section you can specify for which Sessions you want to get notified when Key Levels are tagged. After setting this up, you need to set an alert via the Tradingview Alert function to really activate the Alert Function. Be aware that when you change your Alert setup, you need to setup the Tradingview Alert function again.
💡 Example Use Cases
These examples are for educational purposes only. This tool is not financial advice and should always be used in conjunction with your own trading plan—whether it involves Fair Value Gaps, Order Blocks, or a custom combination of ICT-based elements.
Custom Time Range HighlightThis indicator highlights specific time ranges on your TradingView chart with customizable background colors and labels, making it easier to identify key trading sessions and ICT (Inner Circle Trader) Killzones. It is designed for traders who want to mark important market hours, such as major sessions (Asia, New York, London) or high-volatility Killzones, with full control over activation, timing, colors, and transparency.
Features
Customizable Time Ranges: Define up to 9 different time ranges, including one custom range, three major market sessions (Asia, New York, London), and five ICT Killzones (Asia, NY Open, NY Close, London Open, London Close).
Individual Activation: Enable or disable each time range independently via checkboxes in the settings. By default, only the ICT Killzones are active.
Custom Colors and Transparency: Set unique background and label colors for each range, with adjustable transparency for both.
Labeled Time Ranges: Each active range is marked with a customizable label at the start of the period, displayed above the chart for easy identification.
Priority Handling: If multiple ranges overlap, the range with the higher number (e.g., Asia Killzone over Custom Range) determines the background color.
CET Time Zone: Time ranges are based on Central European Time (CET, Europe/Vienna). Adjust the hours and minutes to match your trading needs.
Settings
The indicator settings are organized into three groups for clarity:
Custom Range: A flexible range (default: 15:30–18:00 CET) for user-defined periods.
Session - Asia, NY, London: Major market sessions (Asia: 01:00–10:00, New York: 14:00–23:00, London: 09:00–18:00 CET).
ICT Killzones - Asia, NY, London: High-volatility periods (NY Open: 13:00–16:00, NY Close: 20:00–23:00, London Open: 08:00–11:00, London Close: 16:00–18:00, Asia: 02:00–05:00 CET).
For each range, you can:
Toggle activation (default: only ICT Killzones enabled).
Adjust start and end times (hours and minutes).
Customize the label text.
Choose background and label colors with transparency levels (0–100).
How to Use
Add the indicator to your chart.
Open the settings to enable/disable specific ranges, adjust their times, or customize colors and labels.
The chart will highlight active time ranges with the selected background colors and display labels at the start of each range.
Use it to focus on key trading periods, such as ICT Killzones for high-probability setups or major sessions for market analysis.
Notes
Ensure your time ranges align with your trading instrument’s session times.
Overlapping ranges prioritize higher-numbered ranges (e.g., Asia Killzone overrides London Session).
Ideal for day traders, scalpers, or ICT strategy followers who need clear visual cues for specific market hours.
Feedback
If you have suggestions for improvements or need help with customization, feel free to leave a comment or contact the author!

ICT KEY LEVELS (L3J)📊 Overview
The ICT KEY LEVELS (L3J) indicator is a tool designed to automatically identify and display key levels based on Inner Circle Trader (ICT) concepts.
This indicator combines session-based levels with multi-timeframe highs/lows analysis to provide traders with critical price zones for decision-making.
Developed by L3J - This indicator can be used in conjunction with other indicators I have developed for enhanced market analysis.
🎯 Key Features
Session-Based Levels
- Previous Day High/Low (PDH/PDL): Automatically identifies and displays the previous trading day's high and low levels
- Asian Session Levels: Tracks high and low during Asian trading hours (20:00-03:00 GMT+4)
- European Session Levels: Captures London session high and low levels (03:00-08:30 GMT+4)
Multi-Timeframe Analysis
- H1 Pivot Levels: Identifies 2-candle reversal patterns on 1-hour timeframe
- H4 Pivot Levels: Detects 4-hour pivot points using advanced pattern recognition
- Smart Visibility: Levels are only shown on appropriate timeframes (H1 levels on H1, H4 levels on H4)
Advanced Features
- Priority System: Automatically hides overlapping levels based on importance (Previous Day > Sessions > H4 > H1)
- Dynamic Labels: Real-time labels that update with price action
- Intelligent Cleanup: Removes crossed or outdated levels to maintain chart clarity
- Customizable Anchoring: Choose between precise timestamp anchoring or candle middle anchoring
- Performance Optimized: Built with efficient code structure for smooth chart performance
⚙️ Configuration Options
Note: Currently, the user interface settings are displayed in French. This will be updated to English in a future version.
General Settings
- Timezone: Configurable timezone for session calculations (default: GMT+4)
- Trading Days: Number of trading days to analyze (1-20 days)
- Extension: Right extension length for level lines
- Anchoring Mode: Precise timestamp or candle middle anchoring
Visual Customization
Each level type (Asia, Europe, Previous Day, H1, H4) includes:
- Color Selection: Separate colors for highs and lows
- Line Styles: Solid, Dotted, or Dashed lines
- Line Width: Adjustable thickness (1-4 pixels)
- Show/Hide Toggle: Individual control for each level type
🕒 Session Times
- Trading Day: 18:00-16:00 (CME session)
- Asian Session: 20:00-03:00 GMT+4
- European Session: 03:00-08:30 GMT+4
All times are configurable and timezone-aware
📈 How It Works
Level Detection
1. Session Levels: Continuously tracks price action during specific trading sessions
2. Pivot Detection: Uses 2-candle reversal patterns (bullish then bearish for highs, bearish then bullish for lows)
3. Multi-Timeframe Data: Requests higher timeframe data for H1 and H4 analysis
Smart Management
- Automatic Cleanup: Removes levels that have been crossed or are too old
- Priority Filtering: Hides duplicate levels based on importance hierarchy
- Dynamic Updates: Real-time adjustment of level positions and labels
🎨 Visual Elements
- Horizontal Lines: Extend from level creation point to the right
- Dynamic Labels: Show level type and session information
- Color Coding: Different colors for each session and timeframe
- Transparency: Automatically hides overlapping or less important levels
🔧 Technical Specifications
- Pine Script Version: v6
- Chart Overlay: True
- Max Lines: 500
- Max Labels: 50
- Performance: Optimized with intelligent memory management
📋 Usage Tips
1. Best Timeframe: Works on all timeframes, but H1 and lower provide optimal detail
2. Combine with Price Action: Use levels as confluence zones for entry/exit decisions
3. Risk Management: Levels can serve as stop-loss and take-profit targets
4. Market Structure: Helps identify key support/resistance in market structure analysis
🔄 Compatibility
This indicator is designed to work alongside other L3J indicators for comprehensive market analysis.
📞 Support & Updates
For questions, suggestions, or updates, please contact L3J through TradingView messaging.
---
Disclaimer : This indicator is for educational and analysis purposes. Always practice proper risk management and never risk more than you can afford to lose.
Version: 1.0
Author: L3J
Last Updated: 30/08/2025

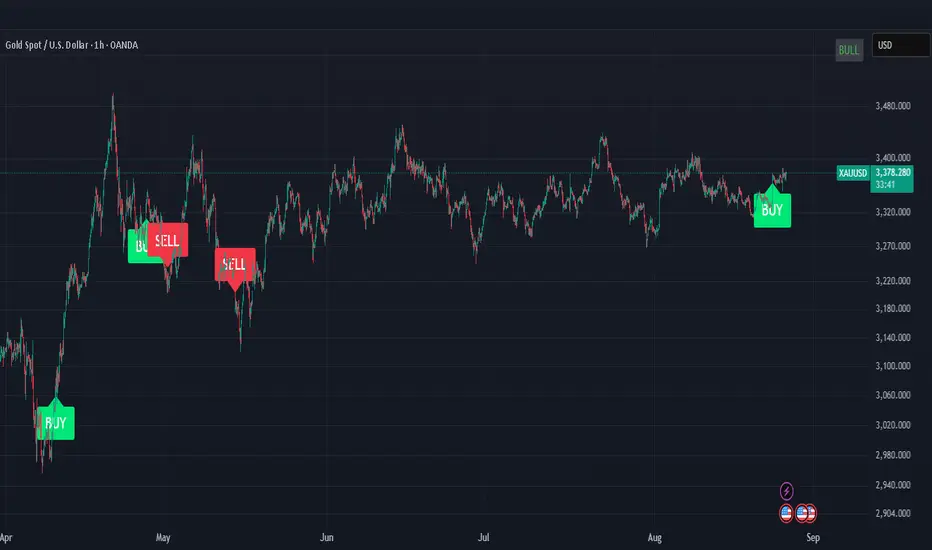
ICT OTE (Optimal Trade Entry) IndicatorWhat This Indicator Does:
This is an ultra-clean ICT (Inner Circle Trader) indicator that shows only ONE high-probability signal at a time when multiple confluences perfectly align. It eliminates chart clutter and focuses on the absolute best trading opportunities.
How It Takes Positions:
🔍 Signal Requirements (ALL Must Align):
Market Structure Break - Significant swing high/low break with volume confirmation
Fair Value Gap (FVG) - Large price imbalance/gap (minimum 0.5% size)
Order Block - Institutional supply/demand zone from recent rejection candle
OTE Sweet Spot - Price retraces to 70.5% Fibonacci level (optimal entry zone)
Volume Confirmation - 50% above 50-bar average volume
Rejection Candle - Proper candle formation showing rejection at the level
📊 Position Entry Logic:
BUY Signal Triggers When:
Price breaks above a significant swing high (bullish structure break)
Price retraces back down into a Fair Value Gap or Order Block
Retracement reaches exactly the 70.5% optimal level
Volume spike confirms institutional interest
Rejection candle forms (closes higher than it opened during retracement)
No other signal has been active in the last 50 bars (cooldown system)
SELL Signal Triggers When:
Price breaks below a significant swing low (bearish structure break)
Price retraces back up into a Fair Value Gap or Order Block
Retracement reaches exactly the 70.5% optimal level
Volume spike confirms institutional interest
Rejection candle forms (closes lower than it opened during retracement)
No other signal has been active in the last 50 bars (cooldown system)
⚡ Key Features:
Ultra-Strict Filtering: Only 2-4 signals per month on average (quality over quantity)
One Signal Rule: Only one active signal at a time - no confusion
50-Bar Cooldown: Prevents signal spam and overtrading
Perfect Confluence: Requires 3+ ICT concepts to align simultaneously
Clean Chart: No boxes, lines, or visual clutter - just clear BUY/SELL labels
🎯 Trading Strategy:
Wait for Signal: Large BUY or SELL label appears on chart
Entry: Enter immediately when signal appears (all confluences already confirmed)
Stop Loss: Place beyond the Fair Value Gap or Order Block (typically 1-2% risk)
Take Profit: Target previous swing high/low or major liquidity levels
Risk Management: Only trade when signal appears - no guessing or early entries
💡 Why It Works:
This indicator combines ICT's most powerful concepts (market structure, FVGs, order blocks, optimal retracements) into one confluence-based system. It only signals when institutional money is likely moving, giving you the highest probability entries with minimal noise.
Perfect for: Swing traders, day traders, and anyone wanting clean, high-probability ICT signals without chart clutter.
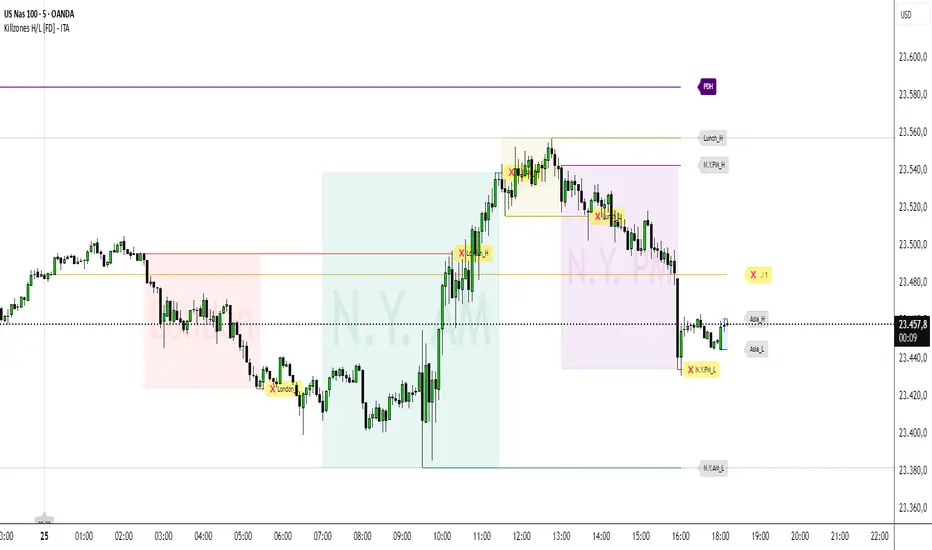
Killzones High/Low [FD] - ITADESCRIPTION ENGLISH - ITALIAN
Killzones High/Low - ITA - Indicator Description
Advanced Pine Script v5 indicator designed for ICT (Inner Circle Trader) strategies that identifies trading killzones, key support/resistance levels and midnight prices with granular controls for every element.
SETTINGS
General controls that affect all indicator elements:
Session Drawings Limit (1): Determines how many historical sessions to keep on chart for each element type. Higher values show more history but may slow performance
Timeframe Limit (30): Drawings disappear on timeframes equal or higher to avoid visual overload
Time Zone: Select reference timezone for sessions. America/New_York automatically adjusts for daylight saving, GMT options are fixed
Label Size: Controls global size of all labels (from Tiny to Huge)
Drawings Cutoff Time: Stops extension of all pivots at specified time (useful for end of trading day)
KILLZONES
Manages critical trading sessions with colored boxes and pivot lines:
General Controls
Show Boxes/Text: Enables visualization and texts in session boxes
Transparency: Controls opacity of boxes and text (0=opaque, 100=transparent)
Available Sessions
Five configurable sessions with individual controls for enabling, custom text, times and colors:
Asia (18:00-00:00): Blue by default
London (02:30-05:30): Red by default
N.Y. AM (07:00-11:30): Green by default
Lunch (11:30-13:00): Golden yellow, enabled by default
N.Y. PM (13:00-16:00): Purple by default
PDH / PDL
Manages Previous Day High and Previous Day Low levels:
Show PDH/PDL: Enables previous day's maximum/minimum
Extension: "Until Mitigation" (stops when broken) or "Most Recent Candle" (continues always)
Colors/Thickness: Visual customization of lines (dark purple by default, 1px thickness)
Labels: Shows "PDH"/"PDL" texts with customizable color (white by default)
PWH / PWL
Manages Previous Week High and Previous Week Low levels:
Show PWH/PWL: Enables previous week's maximum/minimum
Extension: Independent control of line extension
Colors/Thickness: Orange by default for both, 2px thickness
Labels: Configurable "PWH"/"PWL" texts
PMH / PML
Manages Previous Month High and Previous Month Low levels:
Show PMH/PML: Enables previous month's maximum/minimum using security()
Extension: Independent control like other systems
Colors/Thickness: Blue by default for both, 1px thickness
Labels: Customizable "PMH"/"PML" texts
MIDNIGHT PRICE LEVEL
Advanced system for multiple midnight prices:
Base Controls
Show Midnight Price: Enables line at pre-00:00 closing price (ICT strategy)
Midnight -2/-3 Days: Extends system to 2 and 3 days prior
Extension/Mitigation: "Until Mitigation" or "Most Recent Candle" with "Once" or "Multiple" mode
Customization
Separate Colors: D-1, D-2, D-3 with progressive transparency (gold by default)
Style/Thickness: Customizable lines (Solid, Dotted, Dashed)
Labels: Configurable texts (🌙1, 🌙2, 🌙3) with customizable background/text colors
Alerts: Alerts when mitigated during active killzones
KILLZONE LEVEL
Controls pivot lines and killzone labels:
Line Controls
Show Lines: Enables horizontal lines on killzone highs/lows
Break Alerts: Alerts when pivots are exceeded
Midpoints: Dashed lines at range center with stop option after mitigation
Label Offset: Moves labels ahead by 5 candles (0-20 configurable), rejoining when mitigated
Label Controls
Text Customization: Configurable labels for each session (Asia_H/L, London_H/L, etc.)
Background/Colors: Transparent or visible labels with customizable colors
Broken Labels: Additional text (❌ by default) and special colors when pivots mitigated
Extension: "Until Mitigation" or "Beyond Mitigation" with session filter ("Most Recent" or "All")
LABEL STYLES
Four dedicated sections to customize label graphic shapes:
Killzone Line Label Styles: Separate controls for killzone High/Low
PDH/PDL Label Styles: Customizable shapes for Previous Day levels
PWH/PWL Label Styles: Customizable shapes for Previous Week levels
PMH/PML Label Styles: Customizable shapes for Previous Month levels
Each section offers 15+ shape options (Arrows, Center, Circle, Square, Diamond, Triangles, Crosses, Flags, etc.)
MIDNIGHT LINES
System for vertical lines at 00:00:
Show Lines/Labels: Vertical lines with upward arrow labels
Customization: Color (gray by default), style, thickness of vertical lines
Labels: Configurable text ("00:00" by default) with customizable text color (black by default)
Label Offset: Percentage control (-10000% to +10000%) for vertical positioning
Extension: Configurable directions (None, Above, Below, Both)
Limit: Maximum number of lines maintained (4 by default, max 50)
The indicator offers granular control over every visual and functional aspect, making it possible to adapt it to any ICT trading strategy or personal setup.
---ITALIANO---
Killzones High/L ow - ITA
Indicatore avanzato per Pine Script v5 progettato per strategie ICT (Inner Circle Trader) che identifica killzones di trading, livelli chiave di supporto/resistenza e prezzi di mezzanotte con controlli granulari per ogni elemento.
IMPOSTAZIONI
Controlli generali che influenzano tutti gli elementi dell'indicatore:
-Limite Disegni Sessione (1): Determina quante sessioni storiche mantenere sul grafico per ogni tipo di elemento. Valori più alti mostrano più cronologia ma possono rallentare le prestazioni
-Limite Timeframe (30): I disegni scompaiono su timeframe uguali o superiori per evitare sovraccarico visivo
-Fuso Orario: Seleziona il fuso di riferimento per le sessioni. America/New_York si regola automaticamente per l'ora legale, le opzioni GMT sono fisse
-Dimensione Etichette: Controlla la dimensione globale di tutte le etichette (da Minuscola a Enorme)
-Orario Limite Disegni: Ferma l'estensione di tutti i pivot all'orario specificato (utile per fine giornata di trading)
KILLZONES
Gestisce le sessioni di trading critiche con riquadri colorati e linee pivot:
Controlli Generali
-Mostra Riquadri/Testo: Abilita visualizzazione e testi nei riquadri delle sessioni
-Trasparenza: Controlla opacità di riquadri e testo (0=opaco, 100=trasparente)
Sessioni Disponibili
Cinque sessioni configurabili con controlli individuali per abilitazione, testo personalizzato, orari e colori:
Asia (18:00-00:00): Blu di default
London (02:30-05:30): Rosso di default
N.Y. AM (07:00-11:30): Verde di default
Lunch (11:30-13:00): Giallo dorato, abilitata di default
N.Y. PM (13:00-16:00): Viola di default
PDH / PDL
Gestisce i livelli Previous Day High e Previous Day Low:
-Mostra PDH/PDL: Abilita massimo/minimo del giorno precedente
-Estensione: "Fino a Mitigazione" (si ferma quando rotto) o "Candela Più Recente" (continua sempre)
-Colori/Spessore: Personalizzazione visiva delle linee (viola scuro di default, spessore 1px)
-Etichette: Mostra testi "PDH"/"PDL" con colore personalizzabile (bianco di default)
PWH / PWL
Gestisce i livelli Previous Week High e Previous Week Low:
-Mostra PWH/PWL: Abilita massimo/minimo della settimana precedente
-Estensione: Controllo indipendente dell'estensione delle linee
-Colori/Spessore: Arancione di default per entrambi, spessore 2px
-Etichette: Testi "PWH"/"PWL" configurabili
PMH / PML
Gestisce i livelli Previous Month High e Previous Month Low:
-Mostra PMH/PML: Abilita massimo/minimo del mese precedente utilizzando security()
-Estensione: Controllo indipendente come gli altri sistemi
-Colori/Spessore: Blu di default per entrambi, spessore 1px
-Etichette: Testi "PMH"/"PML" personalizzabili
MIDNIGHT PRICE LEVEL
Sistema avanzato per prezzi di mezzanotte multipli:
Controlli Base
-Mostra Midnight Price: Abilita linea al prezzo di chiusura pre-00:00 (strategia ICT)
-Midnight -2/-3 Giorni: Estende il sistema a 2 e 3 giorni precedenti
-Estensione/Mitigazione: "Fino a Mitigazione" o "Candela Più Recente" con modalità "Una Volta" o "Multipla"
Personalizzazione
-Colori separati: D-1, D-2, D-3 con trasparenza progressiva (giallo oro di default)
-Stile/Spessore: Linee personalizzabili (Solida, Punteggiata, Tratteggiata)
-Etichette: Testi configurabili (🌙1, 🌙2, 🌙3) con colori sfondo/testo personalizzabili
-Avvisi: Alert quando mitigati durante killzones attive
KILLZONE LEVEL
Controlla linee pivot e etichette delle killzones:
Controlli Linee
-Mostra Linee: Abilita linee orizzontali sui massimi/minimi delle killzones
-Avvisi Rottura: Alert quando pivot vengono superati
-Punti Medi: Linee tratteggiate al centro del range con opzione di stop dopo mitigazione
-Offset Etichette: Sposta etichette avanti di 5 candele (0-20 configurabile), ricongiungendole quando mitigate
Controlli Etichette
-Personalizzazione Testi: Etichette configurabili per ogni sessione (Asia_H/L, London_H/L, ecc.)
-Sfondo/Colori: Etichette trasparenti o visibili con colori personalizzabili
-Etichette Rotte: Testo aggiuntivo (❌ di default) e colori speciali quando pivot mitigati
-Estensione: "Fino a Mitigazione" o "Oltre Mitigazione" con filtro sessioni ("Più Recente" o "Tutte")
STILI ETICHETTE
Tre sezioni dedicate per personalizzare la forma grafica delle etichette:
-Stili Etichette Linee Killzones: Controlli separati per High/Low delle killzones
-Stili Etichette PDH/PDL: Forme personalizzabili per Previous Day levels
-Stili Etichette PWH/PWL: Forme personalizzabili per Previous Week levels
-Stili Etichette PMH/PML: Forme personalizzabili per Previous Month levels
Ogni sezione offre 15+ opzioni di forma (Frecce, Centro, Cerchio, Quadrato, Diamante, Triangoli, Croci, Bandiere, ecc.)
LINEE MEZZANOTTE
Sistema per linee verticali alle ore 00:00:
-Mostra Linee/Etichette: Linee verticali con etichette freccia verso l'alto
-Personalizzazione: Colore (grigio di default), stile, spessore delle linee verticali
-Etichette: Testo configurabile ("00:00" di default) con colore testo personalizzabile (nero di default)
-Offset Etichette: Controllo percentuale (-10000% a +10000%) per posizionamento verticale
-Estensione: Direzioni configurabili (Nessuna, Sopra, Sotto, Entrambe)
-Limite: Numero massimo linee mantenute (4 di default, max 50)
L'indicatore offre controllo granulare su ogni aspetto visivo e funzionale, rendendo possibile adattarlo a qualsiasi strategia di trading ICT o setup personale.
Sunmool's Next Day Model FVG AlertNY Killzone FVG Alert - ICT Fair Value Gap Detection Indicator
This comprehensive Pine Script indicator is specifically designed for traders following ICT (Inner Circle Trader) methodology and Smart Money Concepts. The indicator automatically detects Fair Value Gaps (FVG) that occur during the New York Killzone session, providing real-time alerts when these critical market imbalances are identified.
Key Features:
🎯 Fair Value Gap Detection
Automatically identifies bullish and bearish Fair Value Gaps using the classic 3-candle pattern
Filters gaps based on customizable minimum size thresholds to avoid insignificant imbalances
Provides visual representation through colored boxes and labels for easy identification
⏰ New York Killzone Focus
Specifically monitors the NY Killzone session (default: 7:00 AM - 10:00 AM EST)
Fully customizable session times to accommodate different trading preferences
Only detects FVGs when all three candles forming the gap occur within the killzone timeframe
📅 ICT Next Day Model Compliance
Automatically excludes Mondays from FVG detection as per ICT Next Day Model principles
Optional Monday exclusion can be toggled on/off based on trading strategy
Ensures alignment with professional ICT trading methodologies
🔔 Advanced Alert System
Three distinct alert conditions: Bullish FVG, Bearish FVG, and Combined alerts
Customizable alert messages for different notification preferences
Compatible with TradingView's full alert system including email, SMS, and webhook notifications
🎨 Visual Customization
Adjustable colors for bullish and bearish FVG boxes
Configurable box extension length for better visualization
Optional background highlighting during killzone sessions
Clean, professional chart presentation that doesn't clutter your analysis
📊 Technical Specifications
Works on all timeframes, though most effective on intraday charts (1m, 5m, 15m)
Timezone-aware calculations ensure accurate session detection globally
Efficient code structure minimizes processing load and chart lag
Compatible with other indicators and doesn't interfere with existing chart setups
🎯 Ideal For:
ICT methodology traders seeking automated FVG detection
Smart Money Concepts practitioners
Scalpers and day traders focusing on NY session
Traders looking to identify high-probability entry zones
Anyone interested in market structure and liquidity concepts
📈 Trading Applications:
Fair Value Gaps often serve as areas where price may return to "fill" the imbalance, making them excellent zones for:
Potential reversal areas
Take profit targets
Stop loss placement reference points
Market structure analysis
Confluence with other ICT concepts
⚙️ Customizable Parameters:
FVG minimum size filter
Killzone session start/end times
Visual display options
Alert preferences
Color schemes and styling options
This indicator brings institutional trading concepts to retail traders, helping identify the same market inefficiencies that smart money targets. By focusing specifically on the New York Killzone - one of the most liquid and volatile trading sessions - it provides high-quality signals during optimal market conditions.
Whether you're new to ICT concepts or an experienced trader looking to automate your FVG detection, this indicator provides the precision and reliability needed for professional trading analysis.

IFVG by Toño# IFVG by Toño - Pine Script Indicator
## Overview
This Pine Script indicator identifies and visualizes **Fair Value Gaps (FVG)** and **Inverted Fair Value Gaps (IFVG)** on trading charts. It provides advanced analysis of price inefficiencies and their subsequent inversions when mitigated.
## Key Features
### 1. Fair Value Gap (FVG) Detection
- **Bullish FVG**: Detected when `low > high ` (gap between current low and high of 2 bars ago)
- **Bearish FVG**: Detected when `high < low ` (gap between current high and low of 2 bars ago)
- Visual representation using colored rectangles (green for bullish, red for bearish)
### 2. Inverted Fair Value Gap (IFVG) Creation
- **IFVG Formation**: When a FVG gets mitigated (price fills the gap with candle body), an IFVG is created
- **Color Inversion**: The IFVG takes the opposite color of the original FVG
- Mitigated bullish FVG → Creates red (bearish) IFVG
- Mitigated bearish FVG → Creates green (bullish) IFVG
- **Mitigation Logic**: Uses only candle body (not wicks) to determine when a FVG is filled
### 3. Customizable Display Options
- **Show Normal FVG**: Toggle visibility of regular Fair Value Gaps
- **Show IFVG**: Toggle visibility of Inverted Fair Value Gaps
- **Smart FVG Display**: Even when "Show Normal FVG" is disabled, FVGs that are part of IFVGs remain visible
- **Extension Control**: Option to extend FVGs until they are mitigated
### 4. IFVG Extension Methods
- **Full Cross Method**: IFVG remains active until price completely crosses through it (including wicks)
- **Number of Bars Method**: IFVG remains active for a specified number of bars (1-100)
### 5. Visual Mitigation Signals
- **Cross Markers**: Shows X-shaped markers when IFVGs are mitigated
- Green cross above bar: Bearish IFVG mitigated
- Red cross below bar: Bullish IFVG mitigated
### 6. Comprehensive Alert System
- **IFVG Formation Alerts**: Notifications when new IFVGs are created
- **IFVG Mitigation Alerts**: Notifications when IFVGs are filled/mitigated
- **Separate Controls**: Individual toggles for bullish and bearish IFVG alerts
## How It Works
### Step-by-Step Process:
1. **FVG Detection**: Script continuously scans for 3-bar patterns that create price gaps
2. **FVG Tracking**: Each FVG is stored with its coordinates, type, and status
3. **Mitigation Monitoring**: Script watches for candle bodies that fill the FVG
4. **IFVG Creation**: Upon mitigation, creates an IFVG with opposite polarity at the same location
5. **IFVG Management**: Tracks and extends IFVGs according to chosen method
6. **Visual Updates**: Dynamically updates colors and visibility based on user settings
## Use Cases
- **Support/Resistance Analysis**: IFVGs often act as strong support/resistance levels
- **Market Structure Understanding**: Helps identify how market inefficiencies get filled and reversed
- **Entry/Exit Timing**: Can be used to time entries around IFVG formations or mitigations
- **Confluence Analysis**: Combine with other technical analysis tools for stronger signals
## Configuration Parameters
- **Colors**: Customizable colors for bullish/bearish FVGs and IFVGs
- **Extension**: Choose how long to display gaps on the chart
- **Alerts**: Full control over notification preferences
- **Visual Clarity**: Options to show/hide different gap types for cleaner charts
## Technical Specifications
- **Pine Script Version**: 5
- **Overlay**: True (displays directly on price chart)
- **Max Boxes**: 500 (supports up to 500 simultaneous gaps)
- **Performance**: Optimized array management for smooth operation
This indicator is particularly valuable for traders who use **Smart Money Concepts (SMC)** and **Inner Circle Trader (ICT)** methodologies, as it provides clear visualization of how institutional order flow creates and fills market inefficiencies.

PreviousDayHLEQCME_MINI:NQ1!
Indicator Overview: The "PreviousDayHLEQ" indicator is an essential tool for traders employing Inner Circle Trader (ICT) methodologies, designed to plot the High (H), Low (L), Equilibrium (EQ, the midpoint between high and low), and Optimal Trade Entry (OTE) levels at 61.8%, 70%, and 79% of the previous trading day's range. It provides a clear visual reference for potential support, resistance, and entry zones based on the prior day's price action, helping traders anticipate continuations or reversals in the current day. This indicator stands out by incorporating directional OTE auto-detection, adjusting levels based on whether the previous day formed a new high or low relative to the day before, offering insights into market bias without manual recalculation.
Core Functionality: It tracks and displays the previous day's high and low, calculating the EQ as the average for balance points, and OTE levels as percentage retracements of the range. The script uses a user-defined trading day definition (with timezone support) to accurately capture the day's extremes, ensuring alignment with global market sessions. This core setup allows traders to quickly identify key ICT levels like fair value gaps or liquidity pools from the prior day.
Unique OTE Auto Detection: One of the indicator's most innovative features is its automatic detection of OTE direction. If the previous day made a new high compared to the day before, OTE levels are calculated downward from the high to the low (bearish bias), highlighting potential short entries. Conversely, a new low triggers upward OTE levels from the low to the high (bullish bias), signaling long opportunities. This auto-detection is unique, as it dynamically adapts to historical price expansion without user input, a capability not found in standard previous day indicators that typically use fixed directions. It empowers ICT traders to gauge carry-over momentum from the prior day, such as in scenarios where a bullish expansion suggests buying dips to the 61.8% level.
Directional Bias Indication: Beyond plotting levels, the OTE calculation inherently indicates the previous day's bias (expansion upward or downward), providing context for current day trades. This unique bias detection helps traders align with market structure, e.g., favoring shorts if OTE is downward-oriented, enhancing decision-making in ICT frameworks like order block identification.
Left-Side Trimming Innovation: The indicator includes a highly unique left-side trimming option, allowing users to restrict the historical extension of lines to a specified number of bars (e.g., the last 8 bars). This reduces visual clutter on charts with long history, focusing attention on recent and relevant price action—a feature rarely seen in previous day indicators, where lines often span the entire chart and obscure current developments. Traders can toggle trimming on/off and adjust the bar count, making it ideal for clean, professional setups.
Customization and Visual Controls: Users can fully customize line colors (separate for high, low, EQ, and each OTE level), styles (solid, dashed, dotted), and label properties (text color, background color, transparency, size). This level of granularity ensures the indicator fits any chart theme or strategy, with options to enable/disable individual elements like EQ or OTE for minimalistic views. The stick-right label option keeps labels visible as the chart updates, preventing overlap.
Auto-Deletion at Trading Day End: Levels can be automatically cleared at the indicator's calculated market close (17:00 NY time), a unique feature that prevents accumulation of outdated data, keeping the chart fresh for the next day. This is particularly useful for day traders who reset their setups daily.
No External Dependencies: The indicator operates solely on chart price data using built-in Pine Script functions, ensuring reliability and compatibility without needing additional libraries or internet access.
How It Works
Previous Day Data Capture: The script identifies the previous trading day using the user-defined timezone and calculates high, low, EQ, and OTE levels based on that day's range.
OTE Calculation: Levels are computed as percentages of the range, with auto-detection switching direction if a new high/low was made relative to the day before.
Drawing and Trimming: Lines are plotted with user-set padding for extension, and trimming cuts the left side to focus on current action.
Update Mechanism: Levels update in real-time as the previous day's data is fixed, but the script refreshes on chart reloads or new days.
Deletion Logic: At market close, if auto-delete is enabled, all elements are removed to prepare for the next cycle.
Uniqueness and Innovation
Session OTE Auto Detection: Automatically determines OTE direction based on previous day's high/low expansion, a rare feature that provides bias insights not available in basic previous day high/low indicators, aiding ICT traders in identifying entry zones with market context.
Left-Side Trimming: This innovation allows customizable historical line length, solving chart clutter issues unique to previous day indicators that typically show full history, enhancing usability for live trading.
Directional OTE with Multi-Level Support: Combines auto-bias detection with three OTE percentages (61.8%, 70%, 79%), offering more granular entry options than single-level tools, tailored for ICT's focus on range retracements.
Independent Customization per Element: Separate controls for high, low, EQ, and OTE colors/styles, plus transparency and size, provide unmatched flexibility compared to rigid indicators.
Auto-Deletion for Cleanliness: Unique cleanup at market close prevents level buildup, a practical feature for multi-day analysis not commonly implemented in similar tools.
How to Use It
Setup: Add to chart, configure timezone (e.g., "America/New_York"), and enable the indicator.
Customization: Adjust line colors (e.g., blue for high), styles (dashed for OTE), and enable trimming (8 bars for focus).
Interpretation: Use OTE for entries (e.g., buy at 61.8% in bullish bias); EQ for reversion.
Tips: Test on historical data; combine with ICT concepts like CISD, FVG etc.
This indicator elevates ICT trading with its auto-detection and trimming. Use with risk management; trading carries risk
Trading Macro Windows by BW v2
Trading Macros by BW: Integrating ICT Concepts for Session Analysis
This indicator combines two key Inner Circle Trader (ICT) concepts—Change in State of Delivery (CISD) or Inverted Fair Value Gap (IFVG) signals with Macro Time Windows—to provide a unified tool for analyzing intraday price action, particularly during Pacific Time (PT) sessions. Rather than simply merging existing scripts, this integration creates a cohesive visual framework that highlights how macro consolidation periods interact with potential reversal or continuation signals like CISD or IFVG. By overlaying macro candle styling and borders on the chart alongside selectable signal lines, traders can better contextualize setups within ICT's macro narrative, where price often manipulates liquidity during these windows before displacing toward higher-timeframe objectives.
Core Components and How They Work Together:
Macro Time Windows (Inspired by ICT's Macro Periods):
ICT emphasizes "macro" as 30-minute windows (e.g., 06:45–07:15 PT, 07:45–08:15 PT, up to 11:45–12:15 PT) where price tends to consolidate, sweep liquidity, or form key structures like Fair Value Gaps (FVGs). These periods set the stage for the session's directional bias.
The indicator styles candles within these windows using a user-defined color for wicks, borders, and bodies (translucent for visibility). This visual emphasis helps traders focus on activity inside macros, where reversals or continuations often originate.
Borders are drawn as vertical lines at the start and end of each window (with a +5 minute buffer to capture related activity), using a dotted style by default. This creates a "study zone" that encapsulates macro events, allowing traders to assess if price is respecting or violating these zones in alignment with broader ICT models like the Power of 3 (AMD cycle).
Toggle: "Macro Candles Enabled" (default: true) – Turn off to disable styling and borders if focusing solely on signals.
CISD or IFVG Signals (Selectable Mode):
Mode Selection: Choose between "Change in the State of Delivery" (CISD) or "IFVG" (default: IFVG). Both detect shifts in market delivery during specific 30-minute slices (15–45 or 17–45 minutes past the hour in PT sessions).
CISD Mode: Based on ICT's definition of a sudden directional shift, this identifies aggressive displacements after sweeping recent highs/lows. It uses a rolling reference high/low over 6 bars, checks for sweeps (penetrating by at least 2 ticks in the last 2-3 bars), reclamation (closing beyond the reference with at least 50% body), and displacement (50% of prior range or an immediate FVG of 6+ ticks). Signals plot a horizontal line from the close, extending 24 bars right, labeled "CISD."
IFVG Mode: Focuses on Inverted Fair Value Gaps, where a bullish FVG (low > high by 13+ ticks) forms but is inverted (closed below) in the same slice, signaling bearish intent (or vice versa). This targets violations against opposing liquidity, often leading to raids on external ranges. Signals plot similarly, labeled "IFVG."
Shared Logic: Both modes enforce a 55-bar cooldown to prevent clustering, operate only during PT sessions (06:30–13:00), and use tick-based thresholds for precision across instruments. The integration with macros allows traders to see if signals occur within or at the edges of macro windows, enhancing confirmation—for example, a CISD inside a macro might indicate a manipulated reversal toward the session's true objective.
Toggle: "Signals Enabled" (default: true) – Turn off to hide all signal lines and labels, isolating the macro visualization.
How Components Interact:
Macro windows provide the "narrative context" (consolidation/manipulation), while CISD/IFVG signals detect the "delivery shift" (displacement). Together, they form a mashup that justifies publication: isolated signals can be noisy, but when filtered by macro periods, they align with ICT's session model. For instance, an IFVG inversion during a macro might confirm a liquidity sweep before targeting PD arrays or order blocks.
No external dependencies; all calculations are self-contained using Pine's built-in functions like ta.highest/lowest for references and time-based sessions for windows.
Usage Guidelines:
Apply to intraday charts (e.g., 1-5 min) or stocks during PT hours.
Look for confluence: A bull IFVG signal post-macro low sweep might target the next macro high or daily bias.
Customize colors/styles for signals (solid/dashed/dotted lines) and macros to suit your chart.
Backtest in replay mode to observe how macros frame signals—e.g., price often respects macro borders as S/R.
Limitations: Timezone-fixed to PT (America/Los_Angeles); signals are directional hints, not trade entries. Combine with ICT tools like order blocks or liquidity pools for full setups.
This script draws from community ICT implementations but refines them into a single, purpose-built tool for macro-driven trading, reducing chart clutter while emphasizing interconnected concepts. Feedback welcome!

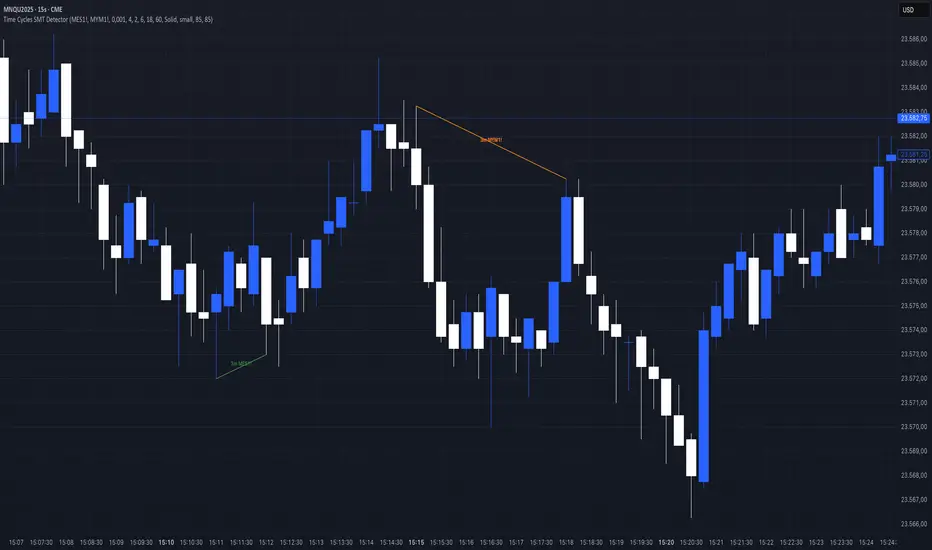
Time Cycles SMT Detector📊 Overview
The Time Cycles SMT Detector is an advanced indicator designed to identify Smart Money Technique (SMT) divergences across multiple time cycles during the New York trading session. It compares price action between correlated instruments to spot institutional footprints and potential market reversals.
🎯 What is SMT (Smart Money Timing)?
SMT occurs when correlated markets fail to make matching highs or lows, indicating potential institutional manipulation or positioning. This divergence often precedes significant market moves.
⚙️ Key Features
Multi-Timeframe Cycle Analysis:
90-minute cycles (6 cycles per trading day) - Major institutional positioning
30-minute cycles (18 cycles per trading day) - Intermediate market structure
10-minute cycles (54 cycles per trading day) - Intraday momentum shifts
3-minute cycles (180 cycles per trading day) - Scalping opportunities
Intelligent Overlap Prevention
Hierarchical priority system prevents visual clutter
Higher timeframe SMTs take precedence over lower timeframes
Clean, readable charts even with multiple active signals
Dual Correlation Analysis
Compare your main chart with two different instruments simultaneously
Default setup: MES1! (S&P 500) and MYM1! (Dow Jones)
Fully customizable ticker selection
📈 Trading Signals
Bullish SMT
Main instrument makes a higher low while correlated instrument makes a lower low
Indicates potential upward movement
Displayed with customizable bullish colors (default: green for MES, aqua for MYM)
Bearish SMT
Main instrument makes a lower high while correlated instrument makes a higher high
Indicates potential downward movement
Displayed with customizable bearish colors (default: red for MES, orange for MYM)
🔧 Customization Options
Visual Settings:
Toggle individual timeframe cycles on/off
Customize colors for each ticker's bullish/bearish signals
Choose line styles (solid, dashed, dotted)
Show/hide cycle text labels
Optional SMT zones with adjustable transparency
Cycle boxes for visual time segmentation
Analysis Settings:
Compare only consecutive cycles or scan multiple cycles back
Adjust maximum cycles to compare (1-20)
Enable/disable bullish or bearish SMT detection separately
Real-time alerts for all timeframes
💡 How to use it
Add to your chart - Works best on 1-minute timeframe for maximum precision
Select your correlated instruments - Default MES/MYM for NQ traders
Monitor for divergences - Look for SMT lines connecting cycle highs/lows
Confirm with market context - Use alongside your existing strategy
Trade the convergence - Expect prices to realign after SMT divergence
🎓 Best Practices
Focus on higher timeframes first - 90m and 30m SMTs carry more weight
Look for confluence - Multiple timeframes showing same direction SMT
Time your entries - Use lower timeframe SMTs (10m, 3m) for precise entry timing
Respect the hierarchy - When overlapping signals occur, higher timeframes have priority
⏰ Trading Hours
The indicator operates during New York trading hours (7:00 AM - 4:00 PM ET), automatically resetting at the start of each trading day.
🚀 Why This Indicator?
Institutional Logic: Based on how smart money creates divergences before major moves
Multi-dimensional Analysis: Four different time cycles provide complete market perspective
Clean Visualization: Smart overlap prevention keeps your charts readable
Flexible Configuration: Adapt to any correlated market pairs
Real-time Alerts: Never miss a significant SMT formation
📝 Notes
Designed primarily for index futures (NQ, ES, YM) but works with any correlated instruments
Best results on 1-minute charts for accurate cycle detection
All cycles reset at 7:00 AM New York time
Maximum effectiveness during regular trading hours
Acknowledgement
This indicator is based on ICT (Inner Circle Trader) concepts and Smart Money techniques for identifying institutional order flow through market divergences.
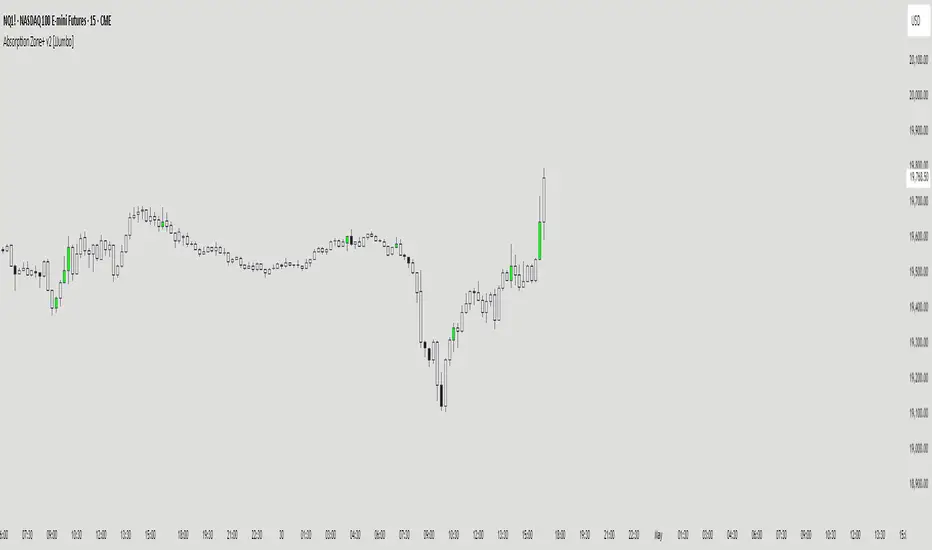
Absorption Zone+ v2 [JJumbo]Introduction
The Absorption Zone+ indicator identifies potential reversal zones by detecting high-volume absorption candles in the market where opposing orders get absorbed at key levels by the opposing party.
This script idea comes from orderflow trading, recreating what absorption would look like, it re-creates absorption based on the volumes of that specific candle or area (multiple candles), useful when trading reversals helping you identifying where influx of volume is coming in, combined with key levels it will help you understand whether a reversal is about to happen or continuation is expected during expansions.
An additional feature of Imbalances on the absorption candles is present, highlighting fair value gaps withing the absorption candles, with multi-timeframe plotting. This script is also applicable on all time frames.
This indicator is particularly valuable for traders focusing on order flow and institutional activity. Absorption candles often represent periods where smart money is actively accumulating or distributing positions while maintaining a tight price range, potentially signaling upcoming directional moves.
Key features
Bullish/Bearish candles color coding identifier:
The color coding for bullish/bearish candles help traders visualize where it is a bullish or bearish absorption identifying these zones at reversals or continuations.
Volume threshold and absorption isolation inputs:
This features let you set a threshold of the volume and percentage body to wick to set your preferred highlighting, and shading all non-absorption candles helping you identify only the absorptions present.
Absorption imbalances:
Imbalances (FVGs) bearish and bullish are shown on different time-frames, helping traders identify turnover areas or support and resistance within the absorptions, the imbalances also have a custom user defined time-frame selection to choose from and show on any time frame.
Additional inputs:
User Guidance
Custom Appearance: Adjust the style and colors of the imbalances for both bullish and bearish candles, this helps trader distinguish one from the other having a better understanding.
Custom time-frame imbalances: Choose your favorite time-frame to display its imbalances in any time-frame, helping trader visualize higher or lower time frame imbalances.
Absorption candles isolation: Isolation of the absorption candles to better identify the zones and specific candles where absorption is present.
Volume multiplier and threshold: Adjust the inputs of the absorption calculation thresholds to better taylor the volumes based on market volatility.
Conclusion
This tool is a great addition in the arsenal for the traders, whether you are a reversal trader or a continuation trader, this tool allows you to identify important areas of big amount of participants in specific candles and mixing it with fair value gap theory from The Inner Circle Trader it gives an additional factor of precision
Terms & Conditions
Our charting tools are products provided for informational and educational purposes only and do not constitute financial, investment, or trading advice. Our charting tools are not designed to predict market movements or provide specific recommendations. Users should be aware that past performance is not indicative of future results and should not be relied upon for making financial decisions. By using our charting tools, the purchaser agrees that the seller and the creator are not responsible for any decisions made based on the information provided by these charting tools. The purchaser assumes full responsibility and liability for any actions taken and the consequences thereof, including any loss of money or investments that may occur as a result of using these products. Hence, by purchasing these charting tools, the customer accepts and acknowledges that the seller and the creator are not liable nor responsible for any unwanted outcome that arises from the development, the sale, or the use of these products. We hold no reimbursement, refund, or chargeback policy. Once these Terms and Conditions are accepted by the Customer, before purchase, no reimbursements, refunds or chargebacks will be provided under any circumstances.
By continuing to use these charting tools, the user acknowledges and agrees to the Terms and Conditions outlined in this legal disclaimer.
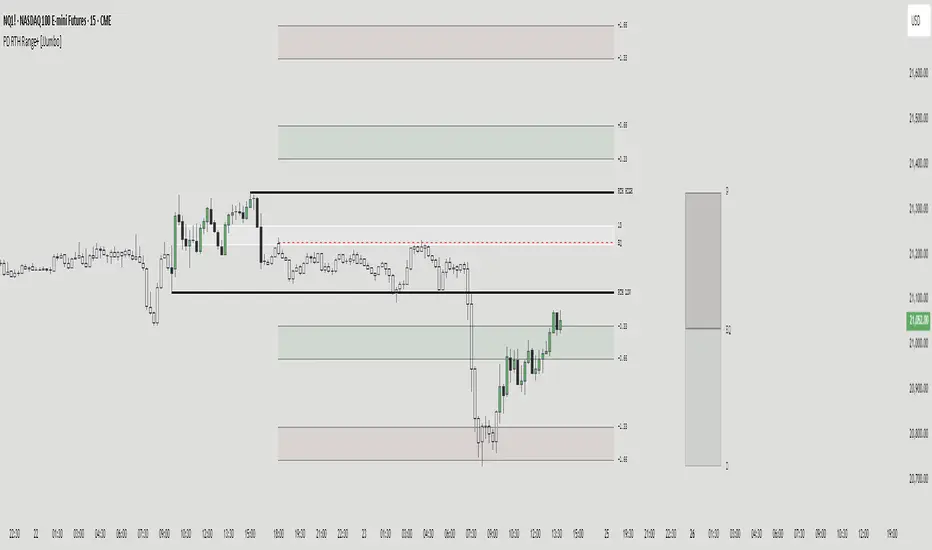
PD RTH Range+ [JJumbo]Introduction:
The PD RTH Range+ indicator is a powerful tool designed to visualize and track previous day and previous day's Regular Trading Hours (RTH) ranges for futures markets. This indicator identifies and plots automatically key price levels established during standard US trading hours (9:30 AM - 4:15 PM ET "RTH") and Globex hours, helping traders identify important key levels and fair value zones.
Just like my other time based range indicator "SDRange+" it works around the same idea but with a different context and different ranges in use, range deviations are still a big part in this framework.
Key features:
Range functions and plot modes:
This tool is equipped with two modes "RTH" range and "Previous day" range, which help you visualize previous day's points of interest and swing high and low essentially helping you framing the current day's daily candle in relation to previous day ranges both RTH and previous day.
Projections feature:
The projection feature in the tool also has two plot modes "Fixed" and "Custom", the Fixed mode projections make use of the rule of thirds (just like the SDRange+) but with two areas 0.33-0.66 and 1.33-1.66, here is where most deviations happen and price exhausts above/below the range.
These are your actionable areas to expect price lose momentum and retrace back into the range.
Dynamic Premium&Discount visualization:
This feature will allow you to identify fair value and equilibrium at current price dynamically updating until out projections or levels have been met and and swing high/low has formed, helping you identify the equilibrium of the market at the current state and where premium or discounted prices are.
Automatic First presentation Fair Value Gap:
A concept idea originated from The Inner Circle Trader (ICT), the feature in the indicator will automatically plot the first presented fair value gap (first FVG present of Regular trading hours) dynamically changing time-frame as well, showing the first presented FVG in any time frame you are visualizing.
This can be used as you area of action as well or targets (during RTH hours).
ETH (Eletronic Trading Hours) candles transparency:
This feature is important for define ETH and RTH hours, removing the color out of the the ETH hours candles helping visualize better the RTH hours, which is where you want base your trading day on.
Customizable inputs:
Fully customizable aesthetics in the input menu
How can traders use this framework and tool effectively in their trading:
Trading range sequences:
This framework is based on IF-THEN statements sequences, it will generate your daily bias by following the sequences.
Sequences: EQ > high/low, high/low > EQ,EQ > fixed projections, fixed projections >EQ.
When following these sequences, you will easily find you daily direction, which are also data-backed by statistics (you can see about it in my X profile, you will find the link in my Trading View profile)
Trading retracements/reversals:
Retracements are often taken from the projections areas until Equilibrium of the dynamic premium and discount feature in the indicator, often participating in the moves to fair value from the deviation of the range.
Reversals are often taken from the projections areas until opposing levels of the range (EQ or high/low)
Terms & Conditions
Our charting tools are products provided for informational and educational purposes only and do not constitute financial, investment, or trading advice. Our charting tools are not designed to predict market movements or provide specific recommendations. Users should be aware that past performance is not indicative of future results and should not be relied upon for making financial decisions. By using our charting tools, the purchaser agrees that the seller and the creator are not responsible for any decisions made based on the information provided by these charting tools. The purchaser assumes full responsibility and liability for any actions taken and the consequences thereof, including any loss of money or investments that may occur as a result of using these products. Hence, by purchasing these charting tools, the customer accepts and acknowledges that the seller and the creator are not liable nor responsible for any unwanted outcome that arises from the development, the sale, or the use of these products. We hold no reimbursement, refund, or chargeback policy. Once these Terms and Conditions are accepted by the Customer, before purchase, no reimbursements, refunds or chargebacks will be provided under any circumstances.
By continuing to use these charting tools, the user acknowledges and agrees to the Terms and Conditions outlined in this legal disclaimer.
Multi Timeframe Fair Value Gap Indicator ProMulti Timeframe Fair Value Gap Indicator Pro | MTF FVG Imbalance Zones | Institutional Supply Demand Levels
🎯 The Most Comprehensive Multi-Timeframe Fair Value Gap (FVG) Indicator on TradingView
Transform Your Trading with Institutional-Grade Multi-Timeframe FVG Analysis
Keywords: Multi Timeframe Indicator, MTF FVG, Fair Value Gap, Imbalance Zones, Supply and Demand, Institutional Trading, Order Flow Imbalance, Price Inefficiency, Smart Money Concepts, ICT Concepts, Volume Imbalance, Liquidity Voids, Multi Timeframe Analysis
📊 WHAT IS THIS INDICATOR?
The Multi Timeframe Fair Value Gap Indicator Pro is the most advanced FVG detection system on TradingView, designed to identify high-probability institutional supply and demand zones across multiple timeframes simultaneously. This professional-grade tool automatically detects Fair Value Gaps (FVGs), also known as imbalance zones, liquidity voids, or inefficiency gaps - the exact areas where institutional traders enter and exit positions.
🔍 What Are Fair Value Gaps (FVGs)?
Fair Value Gaps are three-candle price formations that create imbalances in the market structure. These gaps represent areas where buying or selling was so aggressive that price moved too quickly, leaving behind an inefficient zone that price often returns to "fill" or "mitigate." Professional traders use these zones as high-probability entry points.
Bullish FVG: When the low of candle 3 is higher than the high of candle 1
Bearish FVG: When the high of candle 3 is lower than the low of candle 1
⚡ KEY FEATURES
📈 Multi-Timeframe Analysis (MTF)
- 12 Timeframes Simultaneously: 1m, 3m, 5m, 15m, 30m, 45m, 1H, 2H, 3H, 4H, Daily, Weekly
- Real-Time Detection: Instantly identifies FVGs as they form across all selected timeframes
- Customizable Timeframe Selection: Choose which timeframes to display based on your trading style
- Higher Timeframe Confluence: See when multiple timeframes align for stronger signals
🎨 Three Professional Visual Themes
1. Dark Intergalactic: Futuristic neon colors with high contrast for dark mode traders
2. Light Minimal: Clean, professional appearance for traditional charting
3. Pro Modern: Low-saturation colors for extended screen time comfort
📊 Advanced FVG Dashboard
- Live FVG Counter: Real-time count of active bullish and bearish gaps
- Total Zone Tracking: Monitor all active imbalance zones at a glance
- Theme-Adaptive Display: Dashboard automatically adjusts to your selected visual theme
- Strategic Positioning: Optimally placed to not interfere with price action
🔧 Smart Zone Management
- Dynamic Zone Updates: FVG boxes automatically adjust when price touches them
- Mitigation Detection: Visual feedback when zones are tested or filled
- Color-Coded Status: Instantly see untested vs tested zones
- Extended Projection: Option to extend boxes to the right for future reference
- Timeframe Labels: Optional labels showing which timeframe each FVG originated from
💡 Intelligent Features
- Automatic Zone Cleanup: Removes fully mitigated FVGs to keep charts clean
- Touch-Based Level Adjustment: Zones adapt to partial fills
- Maximum Box Management: Optimized to handle 500 simultaneous FVG zones
- Performance Optimized: Efficient code ensures smooth operation even with multiple timeframes
🎯 TRADING APPLICATIONS
Day Trading & Scalping
- Use 1m, 3m, 5m FVGs for quick scalp entries
- Combine with higher timeframe FVGs for directional bias
- Perfect for futures (ES, NQ, MNQ), forex, and crypto scalping
Swing Trading
- Focus on 1H, 4H, and Daily FVGs for swing positions
- Identify major support/resistance zones
- Plan entries at untested higher timeframe gaps
Position Trading
- Utilize Daily and Weekly FVGs for long-term positions
- Identify institutional accumulation/distribution zones
- Major reversal points at significant imbalance areas
Multi-Timeframe Confluence Trading
- Stack multiple timeframe FVGs for high-probability zones
- Confirm entries when lower and higher timeframe FVGs align
- Professional edge through timeframe confluence
📚 HOW TO USE THIS INDICATOR
Step 1: Add to Your Chart
Click "Add to Favorites" and apply to any trading instrument - works on all markets including stocks, forex, crypto, futures, and indices.
Step 2: Configure Your Timeframes
In settings, select which timeframes you want to monitor. Day traders might focus on 1m-15m, while swing traders might use 1H-Weekly.
Step 3: Choose Your Visual Theme
Select from three professional themes based on your preference and trading environment.
Step 4: Identify Trading Opportunities
For Long Entries:
- Look for Bullish FVGs (green/cyan zones)
- Wait for price to return to untested zones
- Enter when price shows rejection from the FVG zone
- Higher timeframe FVGs provide stronger support
For Short Entries:
- Look for Bearish FVGs (red/pink zones)
- Wait for price to return to untested zones
- Enter when price shows rejection from the FVG zone
- Higher timeframe FVGs provide stronger resistance
Step 5: Manage Risk
- Place stops beyond the FVG zone
- Use partially filled FVGs as trailing stop levels
- Exit when opposite FVGs form (reversal signal)
🏆 WHY THIS IS THE BEST MTF FVG INDICATOR
✅ Most Comprehensive
- More timeframes than any other FVG indicator
- Advanced features not found elsewhere
- Professional-grade visual presentation
✅ Institutional-Grade
- Based on smart money concepts (SMC)
- ICT (Inner Circle Trader) methodology compatible
- Used by professional prop traders
✅ User-Friendly
- Clean, intuitive interface
- Detailed tooltips and descriptions
- Works out-of-the-box with optimal defaults
✅ Continuously Updated
- Regular improvements and optimizations
- Community feedback incorporated
- Professional development by PineProfits
🔥 PERFECT FOR
- Scalpers seeking quick FVG fills
- Day Traders using multi-timeframe analysis
- Swing Traders identifying major zones
- ICT/SMC Traders following smart money
- Prop Firm Traders needing reliable setups
- Algorithmic Traders building systematic strategies
- Technical Analysts studying market structure
- All Experience Levels from beginners to professionals
💎 ADVANCED TIPS
1. Confluence is Key: The strongest signals occur when multiple timeframe FVGs align at the same price level
2. Fresh vs Tested: Untested FVGs (original color) are stronger than tested ones (gray/muted color)
3. Time of Day: FVGs formed during high-volume sessions (London/NY) are more reliable
4. Trend Alignment: Trade FVGs in the direction of the higher timeframe trend for best results
5. Volume Confirmation: Combine with volume indicators for enhanced reliability
📈 INDICATOR SETTINGS
Visual Settings
- Visual Theme: Choose between Dark Intergalactic, Light Minimal, or Pro Modern
- Show Branding: Toggle PineProfits branding on/off
General Settings
- Move box levels with price touch: Dynamically adjust FVG zones
- Change box color with price touch: Visual feedback for tested zones
- Extend boxes to the right: Project zones into the future
- Plot Timeframe Label: Show origin timeframe on each FVG
- Show FVG Dashboard: Toggle the summary dashboard
Timeframe Selection
Select any combination of 12 available timeframes (1m to Weekly)
🚀 GET STARTED NOW
1. Click "Add to Favorites" to save this indicator
2. Apply to your chart - works on any instrument
3. Join thousands of traders already using this professional tool
4. Follow PineProfits for more institutional-grade indicators
⚖️ DISCLAIMER
This indicator is for educational and informational purposes only. It should not be considered financial advice. Always do your own research and practice proper risk management. Past performance does not guarantee future results. Trade responsibly.
© PineProfits - Professional Trading Tools for Modern Markets
If you find this indicator valuable, please leave a like and comment. Your support helps me create more professional-grade tools for the TradingView community!

Mig Trade Model - Kill Zones
Key features:
Liquidity Hunt Detection: Spots aggressive moves that "hunt" stops beyond recent swing highs/lows.
Consolidation Filter: Requires 1-3 small-range candles after a hunt before confirming with a strong candle.
Bias Application: Uses daily open/close to auto-detect bias or allows manual override.
Kill Zone Restriction: Limits signals to London (default: 7-10 AM UTC) and NY (default: 12-3 PM UTC) sessions for better relevance in active markets.
This strategy is inspired by smart money concepts (SMC) and ICT (Inner Circle Trader) methodologies, aiming to capture venom-like "stings" in price action where liquidity is grabbed before reversals.
How It Works
ATR Calculation: Uses a user-defined ATR length (default: 14) to measure volatility, which scales candle body and range thresholds.
Bias Determination:
Auto: Compares daily close to open (bullish if close > open).
Manual: User selects "Bullish" or "Bearish."
Strong Candles:
Bullish: Green candle with body > 2x ATR (configurable).
Bearish: Red candle with body > 2x ATR.
Small Range Candles:
Candles where high-low < 0.5x ATR (configurable).
Liquidity Hunt:
Bullish Hunt: Strong bearish candle making a new low below the past swing low (default: 10 bars).
Bearish Hunt: Strong bullish candle making a new high above the past swing high.
Signal Generation:
After a hunt, counts 1-3 small-range candles.
Confirms with a strong candle in the opposite direction (e.g., strong bullish after bearish hunt).
Resets if >3 small candles or an opposing strong candle appears.
Kill Zone Filter:
Checks if the current bar's time (in UTC) falls within London or NY Kill Zones.
Only allows final "Buy" (bullish entry) or "Sell" (bearish entry) if bias matches and in Kill Zone.
Plots:
Yellow circle (below): Bullish liquidity hunt.
Orange circle (above): Bearish liquidity hunt.
Blue diamond (below): Raw bullish signal.
Purple diamond (above): Raw bearish signal.
Green triangle up ("Buy"): Filtered bullish entry.
Red triangle down ("Sell"): Filtered bearish entry.
Inputs
Bias: "Auto" (default), "Bullish", or "Bearish" – Controls signal direction based on daily trend.
ATR Length: 14 (default) – Period for ATR calculation.
Swing Length for Liquidity Hunt: 10 (default) – Bars to look back for swing highs/lows.
Strong Candle Body Multiplier (x ATR): 2.0 (default) – Threshold for strong candle bodies.
Small Range Multiplier (x ATR): 0.5 (default) – Threshold for small-range candles.
London Kill Zone Start/End Hour (UTC): 7/10 (default) – Customize London session hours.
NY Kill Zone Start/End Hour (UTC): 12/15 (default) – Customize New York session hours.
Usage Tips
Timeframe: Best on lower timeframes (e.g., 5-15 min) for intraday trading, especially forex pairs like EURUSD or GBPUSD.
Timezone Adjustment: Inputs are in UTC. If your chart is in a different timezone (e.g., EST = UTC-5), adjust hours accordingly (e.g., London: 2-5 AM EST → 7-10 UTC).
Risk Management: Use with stop-loss (e.g., beyond the hunt low/high) and take-profit based on ATR multiples. Not financial advice—backtest thoroughly.
Customization: Tweak multipliers for different assets; higher for volatile cryptos, lower for stocks.
Limitations: Relies on historical data; may generate false signals in ranging markets. Combine with other indicators like volume or support/resistance.
This indicator is for educational purposes. Always use discretion and proper risk management in live trading. If you find it useful, feel free to share feedback or suggestions!

ICT Breaker BlocksICT Breaker Block Detector
This indicator automatically identifies and displays high-probability ICT (Inner Circle Trader) Breaker Blocks on your chart. It is designed to help traders spot key shifts in market structure where price is likely to react.
What It Does
The indicator's primary function is to find and draw both Bullish and Bearish Breaker Blocks. These are specific price action patterns that signal a potential reversal after a liquidity sweep.
Bullish Breaker Block (Green): Forms after a low is swept (creating a lower low) and the market structure shifts by breaking above the intermediate swing high. This broken swing high becomes the Bullish Breaker.
Bearish Breaker Block (Red): Forms after a high is swept (creating a higher high) and the market structure shifts by breaking below the intermediate swing low. This broken swing low becomes the Bearish Breaker.
Invalidation: The indicator also tracks these zones in real-time. If price trades completely through a breaker block, the zone is considered invalidated. It will stop extending, its color will change to gray, and an exclamation mark ! will be added to its label.
How It Functions
The script's logic is designed to precisely identify the ICT breaker pattern:
Liquidity Sweep: It first identifies a sequence where a recent swing high is taken out by a higher high (for a bearish setup) or a swing low is taken out by a lower low (for a bullish setup).
Market Structure Shift (MSS): After the sweep, it waits for a clear break in market structure. This occurs when price closes below the intermediate swing low (for a bearish breaker) or above the intermediate swing high (for a bullish breaker).
Drawing the Zone: Once the MSS is confirmed, the indicator draws a box around the range of the swing point that was broken. This box is the Breaker Block, which is then extended into the future to serve as a potential area of interest.
How to Use This Indicator
Settings
Pivot Lookback: This setting determines the sensitivity of the swing point detection. A higher number will identify larger, more significant market structure and result in fewer, but potentially stronger, breaker blocks. A lower number will identify smaller, more immediate patterns.
Color & Display Options: You can customize the colors for the bullish, bearish, and invalidated zones, as well as toggle the visibility of each type of breaker.
Trading Application
Traders can use these automatically drawn zones as high-probability Points of Interest (POI). The common application is to wait for price to return to the breaker block after it has formed. This retest can offer a potential entry opportunity in the direction of the market structure shift.
For a Bullish Breaker, a trader might look for a long entry when the price dips back into the green zone.
For a Bearish Breaker, a trader might look for a short entry when the price rallies back up into the red zone.
Disclaimer: This indicator is a tool to assist in technical analysis. It is not a standalone trading system and does not provide financial advice. Always use proper risk management and combine this tool with your own analysis and trading strategy.
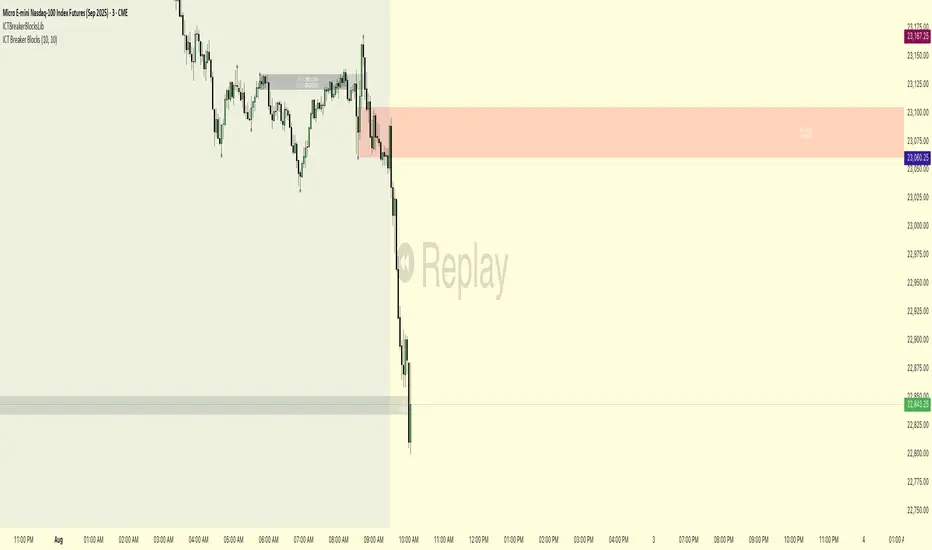
Advanced ICT Theory - A-ICT📊 Advanced ICT Theory (A-ICT): The Institutional Manipulation Detector
Are you tired of being the liquidity? Stop chasing shadows and start tracking the architects of price movement.
This is not another lagging indicator. This is a complete framework for viewing the market through the lens of institutional traders. Advanced ICT Theory (A-ICT) is an all-in-one, military-grade analysis engine designed to decode the complex language of "Smart Money." It automates the core tenets of Inner Circle Trader (ICT) methodology, moving beyond simple patterns to build a dynamic, real-time narrative of market manipulation, liquidity engineering, and institutional order flow.
AIT provides a living blueprint of the market, identifying high-probability zones, tracking structural shifts, and scoring the quality of setups with a sophisticated, multi-factor algorithm. This is your X-ray into the market's true intentions.
🔬 THE CORE ENGINE: DECODING THE THEORY & FORMULAS
A-ICT is built upon a sophisticated, multi-layered logic system that interprets price action as a story of cause and effect. It does not guess; it confirms. Here is the foundational theory that drives the engine:
1. Market Structure: The Blueprint of Trend
The script first establishes a deep understanding of the market's skeleton through multi-level pivot analysis. It uses ta.pivothigh and ta.pivotlow to identify significant swing points.
Internal Structure (iBOS): Minor swings that show the short-term order flow. A break of internal structure is the first whisper of a potential shift.
External Structure (eBOS): Major swing points that define the primary trend. A confirmed break of external structure is a powerful statement of trend continuation. AIT validates this with optional Volume Confirmation (volume > volumeSMA * 1.2) and Candle Confirmation to ensure the break is driven by institutional force, not just a random spike.
Change of Character (CHoCH): This is the earthquake. A CHoCH occurs when a confirmed eBOS happens against the prevailing trend (e.g., a bearish eBOS in a clear uptrend). A-ICT flags this immediately, as it is the strongest signal that the primary trend is under threat of reversal.
2. Liquidity Engineering: The Fuel of the Market
Institutions don't buy into strength; they buy into weakness. They need liquidity. A-ICT maps these liquidity pools with forensic precision:
Buyside & Sellside Liquidity (BSL/SSL): Using ta.highest and ta.lowest, AIT identifies recent highs and lows where clusters of stop-loss orders (liquidity) are resting. These are institutional targets.
Liquidity Sweeps: This is the "manipulation" part of the detector. AIT has a specific formula to detect a sweep: high > bsl and close < bsl . This signifies that institutions pushed price just high enough to trigger buy-stops before aggressively selling—a classic "stop hunt." This event dramatically increases the quality score of subsequent patterns.
3. The Element Lifecycle: From Potential to Power
This is the revolutionary heart of A-ICT. Zones are not static; they have a lifecycle. AIT tracks this with its dynamic classification engine.
Phase 1: PENDING (Yellow): The script identifies a potential zone of interest based on a specific candle formation (a "displacement"). It is marked as "Pending" because its true nature is unknown. It is a question.
Phase 2: CLASSIFICATION: After the zone is created, AIT watches what happens next. The zone's identity is defined by its actions:
ORDER BLOCK (Blue): The highest-grade element. A zone is classified as an Order Block if it directly causes a Break of Structure (BOS) . This is the footprint of institutions entering the market with enough force to validate the new trend direction.
TRAP ZONE (Orange): A zone is classified as a Trap Zone if it is directly involved in a Liquidity Sweep . This indicates the zone was used to engineer liquidity, setting a "trap" for retail traders before a reversal.
REVERSAL / S&R ZONE (Green): If a zone is not powerful enough to cause a BOS or a major sweep, but still serves as a pivot point, it's classified as a general support/resistance or reversal zone.
4. Market Inefficiencies: Gaps in the Matrix
Fair Value Gaps (FVG): AIT detects FVGs—a 3-bar pattern indicating an imbalance—with a strict formula: low > high (for a bullish FVG) and gapSize > atr14 * 0.5. This ensures only significant, volatile gaps are shown. An FVG co-located with an Order Block is a high-confluence setup.
5. Premium & Discount: The Law of Value
Institutions buy at wholesale (Discount) and sell at retail (Premium). AIT uses a pdLookback to define the current dealing range and divides it into three zones: Premium (sell zone), Discount (buy zone), and Equilibrium. An element's quality score is massively boosted if it aligns with this principle (e.g., a bullish Order Block in a Discount zone).
⚙️ THE CONTROL PANEL: A COMPLETE GUIDE TO THE INPUTS MENU
Every setting is a lever, allowing you to tune the AIT engine to your exact specifications. Master these to unlock the script's full potential.
🎯 A-ICT Detection Engine
Min Displacement Candles: Controls the sensitivity of element detection. How it works: It defines the number of subsequent candles that must be "inside" a large parent candle. Best practice: Use 2-3 for a balanced view on most timeframes. A higher number (4-5) will find only major, more significant zones, ideal for swing trading. A lower number (1) is highly sensitive, suitable for scalping.
Mitigation Method: Defines when a zone is considered "used up" or mitigated. How it works: Cross triggers as soon as price touches the zone's boundary. Close requires a candle to fully close beyond it. Best practice: Cross is more responsive for fast-moving markets. Close is more conservative and helps filter out fake-outs caused by wicks, making it safer for confirmations.
Min Element Size (ATR): A crucial noise filter. How it works: It requires a detected zone to be at least this multiple of the Average True Range (ATR). Best practice: Keep this around 0.5. If you see too many tiny, irrelevant zones, increase this value to 0.8 or 1.0. If you feel the script is missing smaller but valid zones, decrease it to 0.3.
Age Threshold & Pending Timeout: These manage visual clutter. How they work: Age Threshold removes old, mitigated elements after a set number of bars. Pending Timeout removes a "Pending" element if it isn't classified within a certain window. Best practice: The default settings are optimized. If your chart feels cluttered, reduce the Age Threshold. If pending zones disappear too quickly, increase the Pending Timeout.
Min Quality Threshold: Your primary visual filter. How it works: It hides all elements (boxes, lines, labels) that do not meet this minimum quality score (0-100). Best practice: Start with the default 30. To see only A- or B-grade setups, increase this to 60 or 70 for an exceptionally clean, high-probability view.
🏗️ Market Structure
Lookbacks (Internal, External, Major): These define the sensitivity of the trend analysis. How they work: They set the number of bars to the left and right for pivot detection. Best practice: Use smaller values for Internal (e.g., 3) to see minor structure and larger values for External (e.g., 10-15) to map the main trend. For a macro, long-term view, increase the Major Swing Lookback.
Require Volume/Candle Confirmation: Toggles for quality control on BOS/CHoCH signals. Best practice: It is highly recommended to keep these enabled. Disabling them will result in more structure signals, but many will be false alarms. They are your filter against market noise.
... (Continue this detailed breakdown for every single input group: Display Configuration, Zones Style, Levels Appearance, Colors, Dashboards, MTF, Liquidity, Premium/Discount, Sessions, and IPDA).
📊 THE INTELLIGENCE DASHBOARDS: YOUR COMMAND CENTER
The dashboards synthesize all the complex analysis into a simple, actionable intelligence briefing.
Main Dashboard (Bottom Right)
ICT Metrics & Breakdown: This is your statistical overview. Total Elements shows how much structure the script is tracking. High Quality instantly tells you if there are any A/B grade setups nearby. Unmitigated vs. Mitigated shows the balance of fresh opportunities versus resolved price action. The breakdown by Order Blocks, Trap Zones, etc., gives you a quick read on the market's recent character.
Structure & Market Context: This is your core bias. Order Flow tells you the current script-determined trend. Last BOS shows you the most recent structural event. CHoCH Active is a critical warning. HTF Bias shows if you are aligned with the higher timeframe—the checkmark (✓) for alignment is one of the most important confluence factors.
Smart Money Flow: A volume-based sentiment gauge. Net Flow shows the raw buying vs. selling pressure, while the Bias provides an interpretation (e.g., "STRONG BULLISH FLOW").
Key Guide (Large Dashboard only): A built-in legend so you never have to guess. It defines every pattern, structure type, and special level visually.
📖 Narrative Dashboard (Bottom Left)
This is the "story" of the market, updated in real-time. It's designed to build your trading thesis.
Recent Elements Table: A live list of the most recent, high-quality setups. It displays the Type , its Narrative Role (e.g., "Bullish OB caused BOS"), its raw Quality percentage, and its final Trade Score grade. This is your at-a-glance opportunity scanner.
Market Narrative Section: This is the soul of A-ICT. It combines all data points into a human-readable story:
📍 Current Phase: Tells you if you are in a high-volatility Killzone or a consolidation phase like the Asian Range.
🎯 Bias & Alignment: Your primary direction, with a clear indicator of HTF alignment or conflict.
🔗 Events: A causal sequence of recent events, like "💧 Sell-side liquidity swept →
📊 Bullish BOS → 🎯 Active Order Block".
🎯 Next Expectation: The script's logical conclusion. It provides a specific, forward-looking hypothesis, such as "📉 Pullback expected to bullish OB at 1.2345 before continuation up."
🎨 READING THE BATTLEFIELD: A VISUAL INTERPRETATION GUIDE
Every color and line is a piece of information. Learn to read them together to see the full picture.
The Core Zones (Boxes):
Blue Box (Order Block): Highest probability zone for trend continuation. Look for entries here.
Orange Box (Trap Zone): A manipulation footprint. Expect a potential reversal after price interacts with this zone.
Green Box (Reversal/S&R): A standard pivot area. A good reference point but requires more confluence.
Purple Box (FVG): A market imbalance. Acts as a magnet for price. An FVG inside an Order Block is an A+ confluence.
The Structural Lines:
Green/Red Line (eBOS): Confirms the trend direction. A break above the green line is bullish; a break below the red line is bearish.
Thick Orange Line (CHoCH): WARNING. The previous trend is now in question. The market character has changed.
Blue/Red Lines (BSL/SSL): Liquidity targets. Expect price to gravitate towards these lines. A dotted line with a checkmark (✓) means the liquidity has been "swept" or "purged."
How to Synthesize: The magic is in the confluence. A perfect setup might look like this: Price sweeps below a red SSL line , enters a green Discount Zone during the NY Killzone , and forms a blue Order Block which then causes a green eBOS . This sequence, visible at a glance, is the story of a high-probability long setup.
🔧 THE ARCHITECT'S VISION: THE DEVELOPMENT JOURNEY
A-ICT was forged from the frustration of using lagging indicators in a market that is forward-looking. Traditional tools are reactive; they tell you what happened. The vision for A-ICT was to create a proactive engine that could anticipate institutional behavior by understanding their objectives: liquidity and efficiency. The development process was centered on creating a "lifecycle" for price patterns—the idea that a zone's true meaning is only revealed by its consequence. This led to the post-breakout classification system and the narrative-building engine. It's designed not just to show you patterns, but to tell you their story.
⚠️ RISK DISCLAIMER & BEST PRACTICES
Advanced ICT Theory (A-ICT) is a professional-grade analytical tool and does not provide financial advice or direct buy/sell signals. Its analysis is based on historical price action and probabilities. All forms of trading involve substantial risk. Past performance is not indicative of future results. Always use this tool as part of a comprehensive trading plan that includes your own analysis and a robust risk management strategy. Do not trade based on this indicator alone.
観の目つよく、見の目よわく
"Kan no me tsuyoku, ken no me yowaku"
— Miyamoto Musashi, The Book of Five Rings
English: "Perceive that which cannot be seen with the eye."
— Dskyz, Trade with insight. Trade with anticipation.

Multi-Timeframe SMTSummery
The Multi-Timeframe SMT indicator is designed to identify and visualize Higher Timeframe (HTF) data on a Lower Timeframe (LTF) chart, allowing traders to see the broader market context without changing their current chart's resolution. It accurately draws pivots and SMT divergences from higher timeframes on the corresponding candles of your current lower timeframe chart.
Its core features include:
Multi-Timeframe Analysis: Configure and monitor pivots on up to four independent timeframes, from intraday to monthly.
Customizable Pivot Detection: Define the strength of pivots by adjusting the number of bars to the left and right.
SMT Divergence: Automatically identifies bullish and bearish SMT divergences by comparing the price action of the main chart symbol with a chosen correlated asset.
Early SMT Detection: A unique feature that monitors a lower "detection timeframe" to provide early warnings of potential SMT setups before they're confirmed on the main timeframe. Note that this early detection is only shown on timeframes equal to or lower than the "Detection timeframe" you have set.
Visual Cues & Alerts: Clear on-chart labels, lines, and fully customizable alerts notify you of confirmed pivots and SMT divergences, ensuring you don't miss key opportunities.
Important Nuance Regarding Pivot Label Display
Due to a self-imposed limit within this script's drawing management logic, the indicator might quickly reach its drawing capacity if you enable pivot crosses for multiple timeframes simultaneously. When this internal drawing limit is exceeded, the script is designed to automatically remove the oldest drawings to make space for new ones.
Therefore, to ensure optimal performance and visibility of the most recent and relevant pivots, it's highly recommended to only enable the "Show Pivot Crosses" option for one timeframe at a time. If you wish to view pivots for a different timeframe, simply disable the pivot crosses for the currently active timeframe and then enable them for your desired one. This approach prevents the rapid cycling and disappearance of pivot labels, providing a clearer and more stable visual experience.
In-Depth Explanation of the Logic
This script is built on two primary concepts: pivot points and Smart Money Technique (SMT) divergence. It systematically collects historical data on multiple timeframes, identifies pivots, and then compares them between two assets to find divergences.
Pivot Point Identification
A pivot is a turning point in the market. A pivot high is a candle that has a higher high than the candles to its immediate left and right. Conversely, a pivot low is a candle with a lower low than its neighbors.
How it Works in the Script:
The script tracks the highest high and lowest low for each period of the selected timeframe (e.g., for each 4-hour candle). When a new high-timeframe candle closes, it stores that high/low value and its bar index in an array. The checkForPivot() function then checks if a recently stored high or low qualifies as a pivot.
Key Inputs:
Left Strength (leftBars1): The number of candles to the left that must have a lower high (for a pivot high) or higher low (for a pivot low).
Right Strength (rightBars1): The number of candles to the right that must meet the same criteria.
For example, with Left Strength and Right Strength both set to 3, a pivot high is only confirmed when its high is greater than the highs of the 3 previous high-timeframe candles and the 3 subsequent high-timeframe candles. Increasing these values will identify more significant, longer-term pivots.
Smart Money Technique (SMT) Divergence
SMT Divergence is a concept popularized by The Inner Circle Trader (ICT). It occurs when two closely correlated assets fail to move in sync. For instance, if Asset A makes a higher high but Asset B fails to do so and instead makes a lower high, this creates a bearish SMT divergence. It suggests that the "smart money" may not be supporting the move in Asset A, signaling a potential reversal.
Bearish SMT: Main asset makes a higher high, while the correlated asset makes a lower high. This is a potential sell signal.
Bullish SMT: Main asset makes a lower low, while the correlated asset makes a higher low. This is a potential buy signal.
How it Works in the Script:
Data Request: For each timeframe, the script uses the request.security() function to fetch the high and low data for both the main chart symbol (syminfo.tickerid) and the chosen Comparison Asset.
Pivot Comparison: When a new pivot is confirmed on the main asset, the script checks if a corresponding pivot also formed on the comparison asset at the same time.
Divergence Check: It then compares the direction of the pivots. For a bearish SMT, it checks if the main asset's new pivot high is higher than its previous pivot high, while the comparison asset's new pivot high is lower than its previous one. The logic is reversed for bullish SMT.
Visualization: If a divergence is found, the script draws a red (bearish) or green (bullish) line connecting the two pivots on your chart and places an "SMT" label.
Early SMT Detection
This is a proactive feature designed to give you a heads-up. Waiting for a 4-hour or daily pivot to form can take a long time. The early detection system looks for SMT divergences on a much smaller, user-defined Detection timeframe (e.g., 15-minute).
How it Works in the Script:
Awaiting Setup: After a primary pivot (Pivot A) is formed on the main timeframe (e.g., a Daily pivot high), the script begins monitoring.
Intraday Monitoring: It then watches the Detection timeframe (e.g., 15-minute) for smaller intraday pivots.
Potential Divergence: It looks for an intraday pivot that forms a divergence against the primary Pivot A.
Watchline & Alert: When this "potential" divergence occurs, the script draws a dashed white line and triggers a "Potential SMT" alert. This isn't a confirmed SMT on the main timeframe yet, but it's a powerful early warning that one may be forming.
Drawing & Object Management
To keep the chart clean and prevent performance issues, the script manages its drawings (lines and labels) efficiently. It stores them in arrays and uses a drawing limit to automatically delete the oldest drawings as new ones are created, ensuring your TradingView remains responsive.
How to Use the Indicator
Configuration
Enable Timeframes: Use the checkboxes (Enable Timeframe 1, Enable Timeframe 2, etc.) to activate the timeframes you want to monitor. It's often best to start with one or two to keep the chart clean.
Select Timeframes: Choose the higher timeframes you want to analyze (e.g., 240 for 4-hour, D for Daily, W for Weekly).
Set Pivot Strength: The default of 3 for Left/Right strength is a good starting point. Increase it to find more significant market structure points or decrease it for more frequent, shorter-term pivots.
Configure SMT:
Check Enable SMT for the timeframes where you want to detect divergence.
Enter a Comparison Asset . This is crucial. Ensure the assets are correlated.
To use the early warning system, check Enable early SMT detection and select an appropriate Detection timeframe (e.g., 15 or 60 minutes for a Daily analysis).

ICT & Zeussy Macro - Vertical Lines at Specific Times 1.0# ICT & Zeussy Macro - Vertical Lines at Specific Times 1.0
## Description
The **ICT & Zeussy Macro - Vertical Lines at Specific Times 1.0** is a Pine Script indicator designed for TradingView to plot vertical lines at user-defined times within each hour, making it a valuable tool for traders following ICT (Inner Circle Trader) and Zeussy macro strategies. The indicator allows users to mark specific times during the trading day with customizable vertical lines, helping to highlight key market moments such as macro times for analysis or trade planning.
## Key Features
- **Customizable Time Selection**: Choose specific hours (00:00 to 23:00) to display vertical lines using checkboxes in the settings.
- **Flexible Minute Inputs**: Define exact minutes for green and orange lines using comma-separated values (e.g., "45,15" for green lines at :45 and :15, or "50,0,10" for orange lines at :50, :00, :10).
- **Color and Style Customization**: Select colors for green and orange lines, as well as the line style (Solid, Dashed, or Dotted) to suit your chart preferences.
- **Historical and Future Plotting**: Configure the number of past and future days to display lines, allowing for analysis of historical patterns or planning for upcoming sessions.
- **Line Limit Management**: The indicator supports up to 500 lines to comply with TradingView's limits, with a warning label displayed if the maximum is reached.
## How It Works
The indicator plots vertical lines at specified minutes within selected hours for each chosen day:
- **Green Lines**: Drawn at user-defined minutes (default: :45 and :15 past the hour).
- **Orange Lines**: Drawn at user-defined minutes (default: :50, :00, and :10 past the hour).
- Users can enable or disable specific hours via checkboxes, and the lines are plotted for the specified number of past and future days.
- The indicator uses the chart's timezone to ensure accurate placement of lines relative to the market's session times.
## Usage
1. **Add to Chart**: Apply the indicator to your TradingView chart.
2. **Configure Settings**:
- In the "Hour Selection" group, check the boxes for the hours you want to display lines (e.g., 08:00 to 23:00 are enabled by default).
- In the "Green Minutes" and "Orange Minutes" fields, enter comma-separated minute values (e.g., "45,15" for green, "50,0,10" for orange).
- Adjust the "Days in Past" and "Days in Future" to control how many days the lines will cover.
- Customize the "Green Color", "Orange Color", and "Line Style" to match your chart aesthetics.
3. **Monitor Limits**: If you see a "Line limit reached (500 max)" warning, reduce the number of selected hours or days to stay within TradingView's line limit.
## Ideal For
- Traders using ICT or Zeussy macro strategies to identify key times for market analysis.
- Users who need to mark recurring time-based events on their charts.
- Technical analysts looking to visualize specific time intervals across multiple days.
## Notes
- Ensure that the number of selected hours and days does not exceed TradingView's 500-line limit to avoid missing lines.
- The indicator respects the chart's timezone, so verify that your chart's timezone aligns with your trading session.
- For optimal performance, limit the number of past and future days when using multiple hours to avoid hitting the line limit.
This indicator is perfect for traders who rely on precise timing for their strategies, offering a clean and customizable way to visualize critical market moments.
Checklist Dashboard Table# Checklist Dashboard Table – ICT/SMC Trading Helper
Overview
The “Checklist Dashboard Table” is a TradingView indicator designed to help traders structure, organize, and validate their market analyses following the ICT/SMC (Inner Circle Trader / Smart Money Concepts) methodology. It provides a visual and interactive checklist directly on your chart, ensuring you never miss a crucial step in your decision-making process.
Key Features
- Visual Checklist : All your trading criteria are displayed as color-coded checkboxes (green for validated, red for not validated), making your analysis process both clear and efficient.
- Clear Separation Between Analysis and Confirmations :
- Analysis : Reminders for your routine, such as timeframe selection (M3 to H4), trend analysis via RSI, and identification of key zones (Midnight Open, SSL/BSL, Asian High/Low).
- Confirmations : Six customizable criteria to check off as you validate your setup (clear trend, OB + FVG, OTE zone, Premium/Discount, R/R > 1:2, CBDR/Midnight).
- Personal Notes Section : Keep your trade entries, observations, or comments in a dedicated field in the indicator’s settings. Your notes are displayed right in the checklist for quick reference and journaling.
- Elegant and Compact Display : The table is styled for readability and can be positioned anywhere on your chart.
- Quick Customization : Instantly update any criterion or your personal notes via the script settings.
How to Use
1. Add the indicator to your chart.
2. Review the “Analysis” section as your pre-trade routine reminder.
3. Check off the “Confirmations” criteria as you validate your entry strategy.
4. Write your trade notes or comments in the provided notes section.
5. Use the checklist to reinforce discipline and repeatability in your trading.
Why Use This Checklist?
- Prevents you from skipping important steps in your analysis.
- Reinforces trading discipline and consistency.
- Allows you to document and review your trade decisions for ongoing improvement.
Who Is It For?
Perfect for ICT/SMC traders, but also valuable for anyone looking to organize and systematize their trading process.
Happy trading!

First FVG📘 Indicator Description (English)
First FVG – NY Open is a TradingView indicator designed to automatically identify the first Fair Value Gap (FVG) that appears during the New York session, following the ICT (Inner Circle Trader) methodology.
It highlights institutional inefficiencies in price caused by imbalanced price action and helps traders spot high-probability entry zones, especially after the 9:30 AM EST (New York Open).
⚙️ How It Works
Session time: The indicator scans for FVGs starting at 9:32 AM (allowing 3 candles after the NY Open to form).
FVG Conditions:
Bullish FVG: When the high of 2 candles ago is lower than the low of the current candle and the middle candle is bullish.
Bearish FVG: When the low of 2 candles ago is higher than the high of the current candle and the middle candle is bearish.
Only the first FVG per session is drawn, as taught by ICT for setups like Judas Swing or NY Reversal models.
A colored box is drawn to represent the FVG zone.
A dotted horizontal line (CE) is drawn at the midpoint of the FVG box (Consequent Encroachment), a key level watched by smart money traders.
A dashed vertical line is drawn at 9:30 NY time to mark the open.
🧠 How to Use It
Wait for the NY Open (9:30 AM EST) – the indicator becomes active at 9:32 AM.
Watch for the first FVG box of the day. This is often a high-probability reaction zone.
Use the CE line (center of the FVG) as a reference for entries, rejections, or liquidity grabs.
Combine with market structure, PD Arrays, and liquidity concepts as taught by ICT for confluence.
The FVG box and CE line will extend forward for several candles for visual clarity.
🎛️ Customizable Settings
Session time (default: 09:32–16:00 NY)
FVG box color (up/down)
Text color
Max number of days to keep boxes on chart
Option to show or hide the 9:30 NY Open vertical line

Noon Curve Box with Quadrants & 1st FVGOverview 📜
The Noon Curve Box with Quadrants & 1st FVG is a comprehensive analysis tool built for intraday traders. It automates the process of identifying and visualizing key time-based concepts popularized by ICT (Inner Circle Trader) and other price action methodologies.
While the concepts themselves are public, this script's value lies in its unique automation and clear presentation. It saves you the manual effort of marking session ranges, quadrants, and searching for critical imbalances every single day, allowing you to focus purely on execution.
Underlying Concepts Explained 🧠
This script is built on a few core price action principles:
Time-Based Profiling: The idea that different times of the trading day have different characteristics. The script visually separates the main session into 2-hour quadrants to help you track momentum shifts.
Fair Value Gaps (FVG): An FVG is a three-bar pattern that indicates a price imbalance or inefficiency. It's a foundational concept in many institutional trading methods.
A Bullish FVG (or BISI) forms when there is a gap between the first candle's high and the third candle's low:
Candle 1 HighCandle 3 High
"Silver Bullet" Time Windows: This indicator specifically targets the first FVG formed during the high-impact AM session (9:30-10:00 NY Time) and a corresponding PM session (13:30-14:00 NY Time), as these are often considered high-probability reversal or continuation zones.
Key Features & How It Works ✨
Automated Session Box: The script automatically draws a box around the high and low of your specified trading session (default is 8:00 AM - 4:00 PM New York time). This provides an instant view of the day's operating range.
Dynamic Quadrant Analysis: The session is automatically divided into 2-hour quadrants. Each box is colored based on its internal momentum (close vs. open), providing an at-a-glance summary of buying or selling pressure throughout the day.
Precision FVG Detection:
The script's core logic scans for the very first FVG within the AM (9:30-10:00) and PM (13:30-14:00) windows.
It identifies the exact 3-bar pattern and immediately draws a box marking the imbalance zone. Once the first FVG is found for a window, the script stops searching, ensuring your chart remains clean and focused on the most significant, initial imbalance.
The FVG boxes extend to the current bar, keeping these key levels of interest visible all day.
How to Use This Indicator 🎯
Context: Use the Session Box high and low as your primary intraday support and resistance levels.
Momentum: Use the Quadrant Box colors to gauge the flow of the market. A switch from red to green, for example, can signal a potential shift in control.
High-Probability Setups: The AM and PM First FVG boxes are your key points of interest. These imbalances often act as price magnets. Look for price to return to these zones to find potential entries, as they may act as support (bullish FVG) or resistance (bearish FVG).
Settings and Customization ⚙️
You have full control over all visual elements.
Session Control: Adjust the session time and timezone.
Visual Toggles: Enable or disable the Session Box, Quadrants, and AM/PM FVGs.
Color Customization: Match all elements to your personal chart theme.
History: Limit the number of historical FVG boxes displayed to keep your chart clean.

ICT Sensitive Key Levels [Mariinus]Indicator Overview – Inspired by ICT Concepts
This indicator is inspired by the teachings of Inner Circle Trader (ICT), whose philosophies and principles have greatly shaped the way I view price action. One of the most powerful lessons that stuck with me is his quote:
"All you need is OHLC."
Another fundamental concept that underpins this tool is the idea that:
"Price is constantly moving in cycles from Premium or Discount to Equilibrium, from Equilibrium to Discount to Premium."
With these core ideas in mind, this indicator was developed to help traders who are already using an ICT-based framework. In addition to plotting the standard OHLC levels, the ICT Sensitive Key Levels indicator also includes derived levels that provide deeper Market insight. These include the Equilibrium of the full candle range (High to Low) as well as the Equilibrium of the wicks – offering a more nuanced view of price balance and potential turning points, in line with ICT’s core concepts.
⚠️ Important Disclaimer:
This is not a standalone trading plan.
This is not a buy or sell signal generator.
Instead, this tool is designed to support traders who follow ICT principles by helping them identify higher-probability PD Arrays – the key zones where setups are more likely to occur. If your trading plan includes looking for specific PD Arrays and structural frameworks taught by ICT, then this indicator is a visual aid to refine and focus your attention on the areas where your framework has a higher probability of playing out.
🔁 Backtesting & Daily Preparation
In addition to improving your real-time analysis, this indicator is also a valuable tool for accelerated backtesting . Rather than manually drawing out levels, the indicator automatically provides them, allowing you to analyze past price action faster and more efficiently .
It’s also ideal for preparing your trading day . By loading the indicator before the session starts, you get a clear visual of key levels that may play a role in your strategy. And if you find the chart too cluttered with lines, simply copy the ones that matter to you, draw them manually, and then turn the indicator off to keep your chart clean while keeping your zones intact.
⚙️ Explanation of the Settings
You can combine up to 4 timeframes to monitor their respective levels while operating on a lower timeframe. For each timeframe, you can:
• Set a lookback period to control how far back you want to calculate levels.
• Choose to display or hide the levels of the current candle , which helps you monitor intra-candle ebbs and flows.
Each level (e.g., High, Low, Open, Close, Equilibrium) can be customized:
• Color
• Line style
• Line width
• To hide a level , simply set its opacity to zero.
You can also enable dividers to clearly mark the start and end of higher timeframe candles on your lower timeframe chart. These dividers are also fully customizable:
• Color
• Style
• Width
• And again, if you prefer a cleaner chart, you can set the opacity to zero to hide them completely.
This setup gives you full control over how much or how little visual data you want to see, aligning the tool with your personal trading workflow.
💡 Example Use Cases
These examples are for educational purposes only. This tool is not financial advice and should always be used in conjunction with your own trading plan—whether it involves Fair Value Gaps, Order Blocks, or a custom combination of ICT-based elements.
• Example 1: A 1H Bearish Fair Value Gap overlapping with the Equilibrium Key Level of the Previous Day's Range – a high-probability zone for reaction.
• Example 2: A 1H Bullish Fair Value Gap in Discount, overlapping with the Equilibrium of Two Days Ago, followed by a move into a 1H Bearish Order Block that coincides with the Previous Day’s Equilibrium.
• Example 3: The same 1H PD Arrays viewed from a 4H chart, alongside Weekly Price Levels – giving you a higher timeframe context that supports or invalidates lower timeframe setups.
• Example 4: A combination of two timeframes for added context. A 4H Bullish Fair Value Gap is nested inside the current Weekly Equilibrium Key Level . On the 15M chart , we observe a reaction that creates an Inversion Fair Value Gap , which aligns with the Equilibrium Key Level of the previous 4H candle .
This indicator doesn’t replace your trading plan—it enhances your ability to execute it. It’s a precision tool made for ICT traders who understand context, structure, and probability.
