Ichimoku Cloud ALERT v1.1UPDATE!
Now it shows yellow bar when its sell signal and blue bar when its buy.
"Ichimoku Cloud " için komut dosyalarını ara
Ichimoku Oscillator With Divergences [ChartPrime]The Ichimoku Oscillator is a trading indicator designed to streamline the interpretation of Ichimoku clouds. It aims to refine and condense the complexities of the Chikou (the lag line), presenting its implications in real-time through an oscillator format, beneficial for those familiar with Ichimoku components but to have a new interpretation of their indicators.
The basics of an Ichimoku:
Conversion Line (Tenkan-Sen): It represents a midpoint of the highest and lowest prices over a specific period, usually 9 periods, reflecting short-term price movements.
Base Line (Kijun-Sen): It acts similarly to the Conversion Line but over a longer period, typically 26 periods, representing medium-term price movements.
Leading Span A & B (Kumo): Span A is the average of the Conversion Line and Base Line, and Span B is the midpoint of the highest and lowest prices over a usually longer period, typically 52 periods. Their interaction denotes trend direction, and the cloud color changes depending on whether Span A is above or below Span B, indicating bullish or bearish market conditions, respectively.
Lagging Span (Chikou Span): It is the current closing price plotted 26 periods behind, assisting in confirming the trend direction and potential momentum.
Advantage of an Oscillator:
Utilizing the oscillator format allows traders to interpret market dynamics more efficiently by visualizing the momentum and trend strength in a bounded range, enabling quick assessments of overbought or oversold conditions. Creating this oscillator provides multiple advantageous; particularly in sideway markets, helping to identify potential reversal points and offering insights on market entries and exits. When building this oscillator we've put a focus on unique interpretations such as overbought and sold areas and divergences; otherwise not found in traditional Ichimoku techniques. It is important to note these divergences are naturally not 100% real time.
When the oscillator turns green; the market is in an uptrend, red for downtrend and yellow for a transitioning market. The center line and the inner most cloud represent a balanced market state.
Key Features & Input Parameters:
Signal Source: Allows the selection of the price data source for signal generation, such as closing prices, and it’s the foundational parameter upon which the oscillator functions.
Normalization Settings: Users can select the normalization mode (“All”, “Window”, or “Disabled”), influencing how the oscillator scales its values. When enabled, it will scale from 100 to -100, allowing the user to understand better the relative positioning of price data.
Smoothing: This indicator offers advanced smoothing features, with options for additional smoothing, allowing traders to adjust the signal's sensitivity to price movements.
Kumo & Chikou Visibility: Traders can customize the visibility settings of Kumo and Chikou, tailoring the display of each component to their preference, enabling a cleaner and more intuitive view of market conditions.
Color Coding: Each component and condition, like bullish or bearish states, can be color-coded, providing visual cues to enhance the interpretability of market trends and states.
Color on Conversion: The oscillator provides an option to color the signal based on the crossover of the conversion and base lines.
Divergence: The oscillator can detect and highlight regular and hidden bullish and bearish divergences between the signal and price, aiding traders in identifying potential trend reversals or continuations.
Alerts:
The list of inbuilt alerts are provided below:
Inside Cloud: The signal line is inside the cloud.
Up Out of Cloud: The signal line crossed above the cloud.
Down Out of Cloud: The signal line crossed below the cloud.
Future Kumo Cross Bullish: The future Kumo lines have crossed in a bullish manner.
Future Kumo Cross Bearish: The future Kumo lines have crossed in a bearish manner.
Current Kumo Cross Bullish: The current Kumo lines have crossed in a bullish manner.
Current Kumo Cross Bearish: The current Kumo lines have crossed in a bearish manner.
Conversion Base Bullish: The conversion line crossed above the base line.
Conversion Base Bearish: The conversion line crossed below the base line.
Signal Bullish on Conversion Base: The signal line crossed above the maximum of conversion and base lines.
Signal Bearish on Conversion Base: The signal line crossed below the minimum of conversion and base lines.
Chikou Bullish: The Chikou line crossed above zero.
Chikou Bearish: The Chikou line crossed below zero.
Signal Over Max: The signal line crossed above the max level.
Signal Over High: The signal line crossed above the high level.
Signal Under Min: The signal line crossed below the min level.
Signal Under Low: The signal line crossed below the low level.
Chikou Over Max: The Chikou line crossed above the max level.
Chikou Over High: The Chikou line crossed above the high level.
Chikou Under Min: The Chikou line crossed below the min level.
Chikou Under Low: The Chikou line crossed below the low level.
Signal Crossover MA: The signal line crossed over the moving average.
Signal Crossunder MA: The signal line crossed under the moving average.
Regular Bullish Divergence: Regular bullish divergence detected.
Hidden Bullish Divergence: Hidden bullish divergence detected.
Regular Bearish Divergence: Regular bearish divergence detected.
Hidden Bearish Divergence: Hidden bearish divergence detected.
Bounce off of Kumo Up: Bullish Bounce off of Kumo.
Bounce off of Kumo Down: Bearish Bounce off of Kumo.
By providing a cohesive visualization of the Ichimoku elements and market momentum within a bounded range, this oscillator is a unique tool and insight into markets.

Ichimoku by FarmerBTCLegal Disclaimer
This strategy, "Ichimoku by FarmerBTC," is provided for educational and informational purposes only. It does not constitute financial advice and should not be relied upon as such. Trading and investing involve substantial risk, including the potential for losing more than your initial investment. Past performance is not indicative of future results. Always consult with a qualified financial advisor before making trading or investment decisions. The author of this strategy is not responsible for any financial losses incurred through its use.
Overview
The "Ichimoku by FarmerBTC" strategy is a trend-following system built on the Ichimoku Cloud indicator, enhanced with volume analysis and a high-timeframe Simple Moving Average (HTF SMA) condition. It is designed to identify long-only trade opportunities and performs optimally on higher timeframes, such as the daily chart or above.
Core Components
1. Ichimoku Cloud
The Ichimoku Cloud is a comprehensive trend-following indicator that helps identify the overall market direction and momentum. It consists of:
Conversion Line (Tenkan-Sen): Measures short-term momentum.
Base Line (Kijun-Sen): Filters medium-term trends.
Leading Span A: The average of the Conversion and Base Lines, forming one cloud boundary.
Leading Span B: The midpoint of the highest high and lowest low over a longer period, forming the other cloud boundary.
Key Ichimoku Rules Applied:
The strategy identifies bullish trends when:
The price is above the cloud.
The cloud is bullish (Leading Span A > Leading Span B).
2. High-Timeframe Simple Moving Average (HTF SMA)
This condition ensures alignment with the broader trend:
Default SMA Length: 13 periods.
Default Timeframe: 1 day.
HTF SMA Rule:
Trades are allowed only when the price is above the HTF SMA, ensuring alignment with the larger trend.
3. Volume Analysis
The strategy uses volume to validate trade setups:
Volume MA: A 20-period moving average of volume is calculated.
Trades are allowed only when the current volume is at least 1.5x the Volume MA, indicating strong market participation.
Entry and Exit Rules
Entry Condition (Long Only):
Price above the Ichimoku Cloud: Confirms a bullish trend.
Bullish Cloud: Leading Span A > Leading Span B indicates upward momentum.
Price above the HTF SMA: Ensures alignment with the broader trend.
Volume exceeds threshold: Confirms strong market participation.
Exit Condition:
The strategy exits the position when the price moves below the Ichimoku Cloud, signaling a potential trend reversal.
Best Timeframes
This strategy is optimized for daily (1D) or higher timeframes (e.g., weekly 1W). Using it on lower timeframes may produce false signals due to increased noise in price and volume data.
Default Settings
Ichimoku Settings:
Conversion Line Period: 10
Base Line Period: 30
Lagging Span Period: 53
Displacement: 26
HTF SMA Settings:
SMA Length: 13
Timeframe: 1 Day
Volume Settings:
Volume MA Length: 20
Volume Multiplier: 1.5x
Visualization
Ichimoku Cloud:
Dynamic cloud coloring (green for bullish, red for bearish) helps identify the current trend.
HTF SMA:
A purple line overlays the chart, providing a clear representation of the high-timeframe trend.
Volume Panel:
An optional panel displays volume (blue histogram) and the Volume Moving Average (orange line) to analyze market participation.
Advantages of This Strategy
High Accuracy on Higher Timeframes:
Filtering trades using the Ichimoku Cloud, HTF SMA, and volume ensures robust trend alignment, reducing false signals.
Volume Confirmation:
Incorporates volume as a validation metric to enter trades only during strong market participation.
Easy Customization:
Parameters like Ichimoku periods, SMA length, timeframe, and volume thresholds can be adjusted to suit different assets or trading styles.
Limitations
Not Suitable for Low Timeframes:
Lower timeframes can produce excessive noise, leading to false signals.
Long-Only:
The strategy is designed only for bullish markets and does not support short trades.
Lagging Nature of Indicators:
Both the Ichimoku Cloud and SMA are lagging indicators, meaning they react to past price movements.
Conclusion
The "Ichimoku by FarmerBTC" strategy is an excellent tool for trend-following on daily or higher timeframes. Its combination of Ichimoku Cloud, high-timeframe SMA, and volume ensures a robust framework for identifying high-probability long trades in trending markets. However, users are advised to test the strategy thoroughly and manage their risk appropriately. Always consult with a financial professional before making trading decisions.

Fiboborsa+BistTitle: "Fiboborsa+Bist Indicator for TradingView"
Description: The "Fiboborsa+Bist" indicator is a powerful tool designed for TradingView users. This indicator offers a comprehensive set of technical indicators to assist you in your technical analysis and trading decisions.
Features:
Simple Moving Averages (SMA): You can enable or disable SMA with different periods (20, 50, 100, 200) to observe different timeframes and trends.
SMA Strategy: Use SMA crossovers to determine trends. Watch for the 20-period SMA crossing above the 50-period SMA for a bullish signal. For a bearish signal, observe the 50-period SMA crossing below the 100-period SMA.
Exponential Moving Averages (EMA): Similar to SMA, you can enable or disable EMA with different periods (5, 8, 14, 21, 34, 55, 89, 144, 233) for more precise trend analysis.
EMA Strategy: Use EMA crossovers and crossunders for short-term trend changes. A buy signal may occur when the 5-period EMA crosses above the 14-period EMA, while a crossunder suggests a selling opportunity.
Weighted Moving Averages (WMA): Customize WMA settings with various periods (5, 13, 21, 34, 89, 144, 233, 377, 610, 987) to suit your trading style.
WMA Strategy: Use WMA crossovers to verify trends. When the 13-period WMA crosses above the 34-period WMA, it may indicate an uptrend.
Buy and Sell Signals: The indicator provides buy and sell signals based on EMA crossovers and crossunders. Strong signals are also highlighted.
EMA Buy and Sell Strategy: Make informed trading decisions using buy and sell signals generated by EMA crossovers and crossunders.
Ichimoku Cloud: You can enable the Ichimoku Cloud for a clear visual representation of support and resistance levels.
Ichimoku Strategy: Use the Ichimoku Cloud to determine trend direction. Entering long positions is common when the price is above the cloud and considering short positions when it's below the cloud. Verify the trend with the Chikou Span.
Bollinger Bands: Easily visualize price volatility by enabling the Bollinger Bands feature.
Bollinger Bands Strategy: Bollinger Bands help you visualize price volatility. Look for potential reversal points when the price touches or crosses the upper or lower bands.
Use the "Fiboborsa+Bist" indicator to enhance your trading strategies and make informed decisions in the dynamic world of financial markets.
Additional Information:
Bollinger Bands: Bollinger Bands are a technical analysis tool used to monitor price volatility and determine overbought or oversold conditions. This indicator consists of three components:
Middle Moving Average (SMA): Typically, a 20-day SMA is used.
Upper Band: Calculated by adding two times the standard deviation to the SMA.
Lower Band: Calculated by subtracting two times the standard deviation from the SMA.
As the price moves between these two bands, it becomes possible to identify potential buying or selling points by comparing its height or low with these bands.
Ichimoku Cloud: The Ichimoku Cloud is a comprehensive indicator used for trend identification, defining support and resistance levels, and measuring trend strength. The Ichimoku Cloud comprises five key components:
Tenkan Sen (Conversion Line): Used to identify short-term trends.
Kijun Sen (Base Line): Used to identify medium-term trends.
Senkou Span A (Leading Span A): Calculated as (Tenkan Sen + Kijun Sen) / 2 and shows future support and resistance levels.
Senkou Span B (Leading Span B): Calculated as (highest high + lowest low) / 2 and indicates future support and resistance levels.
Chikou Span (Lagging Line): Enables tracking the price backward.
The Ichimoku Cloud interprets a price above the cloud as an uptrend and below the cloud as a downtrend. The Chikou Span assists in verifying the current trend.
ADDITIONAL STRATEGY WITH RSI AND MACD INDICATORS
**Strategy: Two-Stage Trading Strategy Using RSI, MACD, and Fiboborsa+Bist Indicators**
**Stage 1: Determining the Trend and Selecting the Trading Direction**
1. **Trend Identification with Fiboborsa+Bist Indicator:**
- Analyze the simple moving averages (SMA), exponential moving averages (EMA), and weighted moving averages (WMA) used with the Fiboborsa+Bist indicator. These indicators will provide information about the direction of the market trend.
2. **Identifying Overbought and Oversold Conditions with RSI:**
- Use the RSI indicator to identify overbought (70 and above) and oversold (30 and below) conditions. This helps in measuring the strength of the trend. If RSI enters the overbought zone, a downward correction is likely. If RSI enters the oversold zone, an upward correction is probable.
3. **Evaluating Momentum with MACD:**
- Examine price momentum using the MACD indicator. When the MACD line crosses above the signal line, it may indicate an increasing upward momentum. Conversely, a downward cross can suggest an increasing downward momentum.
**Stage 2: Generating Buy and Sell Signals**
4. **Combining RSI, MACD, and Fiboborsa+Bist Indicators:**
- To generate a buy signal, wait for RSI to move out of the oversold region into an uptrend and for the MACD line to cross above the signal line.
- To generate a sell signal, wait for RSI to move out of the overbought region into a downtrend and for the MACD line to cross below the signal line.
5. **Confirmation with Fiboborsa+Bist Indicator:**
- When you receive a buy or sell signal, use the Fiboborsa+Bist indicator to confirm the market trend. Confirming the trend can strengthen your trade signals.
6. **Setting Stop-Loss and Take-Profit Levels:**
- Remember to manage risk when opening buy or sell positions. Set stop-loss and take-profit levels to limit your risk.
7. **Monitor and Adjust Your Trades:**
- Continuously monitor your trade positions and adjust your strategy as per market conditions.
This two-stage trading strategy offers the ability to determine trends and generate trade signals using different indicators. However, every trading strategy involves risks, so risk management and practical application are essential. Also, it's recommended to test this strategy in a demo account before using it in a real trading account.

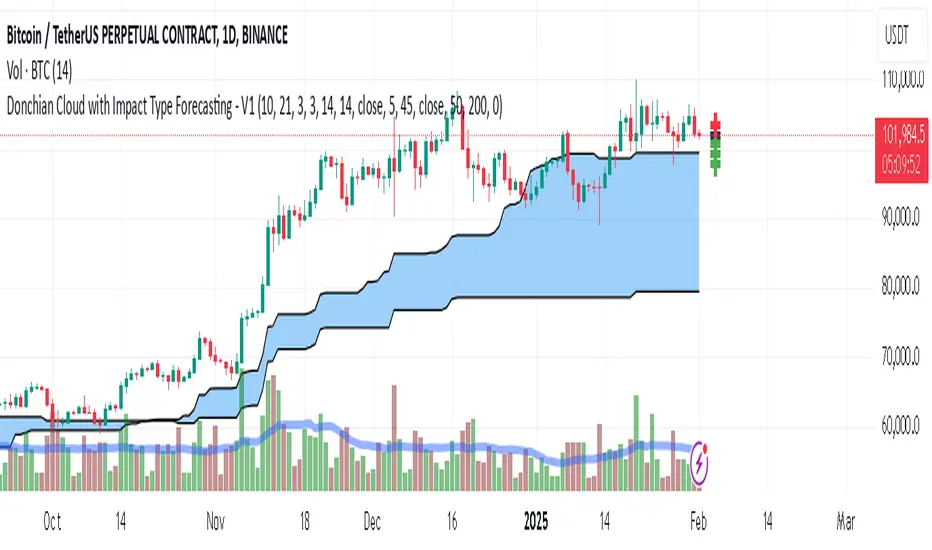
Donchian Cloud-V1The Donchian Cloud-V1 is a technical analysis indicator inspired by the Ichimoku Cloud, but with a twist. It utilizes two Donchian Channel midline calculations to create a cloud-like price zone. This indicator aims to help traders identify potential areas of support and resistance, and also suggests that trades should be avoided when prices are within the cloud.
How it Works?
The Donchian Cloud-V1 calculates two Donchian Channel midlines:
Fast Donchian Channel: This midline is based on a shorter period, making it more responsive to price changes.
Slow Donchian Channel: This midline is based on a longer period, providing a smoother and more stable cloud formation.
The upper and lower bands of the traditional Donchian Channels are discarded, and the midlines become the cloud's upper and lower boundaries.
Interpretation
Price Above the Cloud: A price move above the cloud can be interpreted as a bullish signal, suggesting potential upward momentum.
Price Below the Cloud: A price move below the cloud can be interpreted as a bearish signal, suggesting potential downward momentum.
Price Within the Cloud: The indicator advises against taking any trades when the price is within the cloud itself, as the market may be unclear or ranging.
Benefits of Using the Donchian Cloud-V1
Visually Appealing: The cloud can provide a clear and concise view of potential support and resistance zones.
Customizable: The lengths of the fast and slow Donchian Channels can be adjusted to suit your trading style and preferred timeframe.
Complements Other Indicators: The Donchian Cloud-V1 can be used in conjunction with other technical indicators to strengthen trade signals.
Limitations to Consider
Lagging Indicator: Like many technical indicators, the Donchian Cloud-V1 is based on past price data and may not always perfectly predict future price movements.
False Signals: The cloud can generate false signals, especially in volatile markets.
Not a Standalone Strategy: The Donchian Cloud-V1 should ideally be used alongside other trading strategies and risk management techniques.
The Donchian Cloud-V1 is a valuable tool for traders who want to identify potential support and resistance zones and avoid making trades during periods of market uncertainty. Remember, it's important to backtest and paper trade any indicator before using it with real capital.
Ichimoku ACE ClubA. Overview:
This script is a custom implementation of the Ichimoku Cloud indicator for the TradingView platform, built using Pine Script version 4. It adds additional features like custom "Knife" lines and circle markers for specific data points. The indicator overlays on the chart and plots various elements of the Ichimoku system, including the Tenkan, Kijun, Chikou, and Kumo Cloud.
B. Inputs:
1. Tenkan (TS): This is the short-term moving average line (default period: 9).
2. Kijun (KJ): This is the medium-term moving average line (default period: 17).
3. Knife1 (K1): This line is based on a longer-term moving average (default period: 65).
4. Knife2 (K2): Another long-term moving average line (default period: 129).
5. Chikou Displacement (Chikou_Disp): The Chikou Span is plotted with a delay of 26 periods by default.
6. Displacement (disp): Determines the horizontal shift of the Kumo cloud.
C. Functions:
- `donchian(len)`: This function calculates the Donchian channel, which is the average of the highest high and the lowest low over the given period (len).
- `mf(len, offset)`: This function calculates the highest high and the lowest low over the given period, with an offset applied.
D. Plots:
1. Tenkan, Kijun, Knife1, and Knife2: These are plotted as lines with different colors and thicknesses.
- Tenkan is blue.
- Kijun is red.
- Knife1 is yellow.
- Knife2 is orange.
2. Chikou Span: This is plotted with a displacement and shown in purple.
3. Kumo Cloud: The cloud is formed by plotting two lines, Span A (green) and Span B (magenta), which represent the top and bottom of the cloud, respectively. The space between these lines is filled with a semi-transparent color, either green or magenta, depending on the relative position of the two spans.
E. Circle Markers:
- Additional circle markers are plotted for each of the Tenkan, Kijun, Knife1, and Knife2 lines at various offsets, helping to visualize the historical data points for each of these indicators. These circles are color-coded according to the line they correspond to.
F. Customization:
- The indicator allows customization of the lengths (periods) for Tenkan, Kijun, Knife1, Knife2, and other components via the script's input fields.
G. Conclusion:
This Ichimoku-based indicator provides a detailed view of the market's trend strength and direction. It offers a unique addition with the Knife lines and visual aids like circle markers for specific periods, which helps traders make better-informed decisions based on Ichimoku analysis.
---
You can modify the parameters such as `TS`, `KJ`, `K1`, `K2`, and `disp` according to your trading preferences. The colors and line thicknesses can also be adjusted for better visual representation.

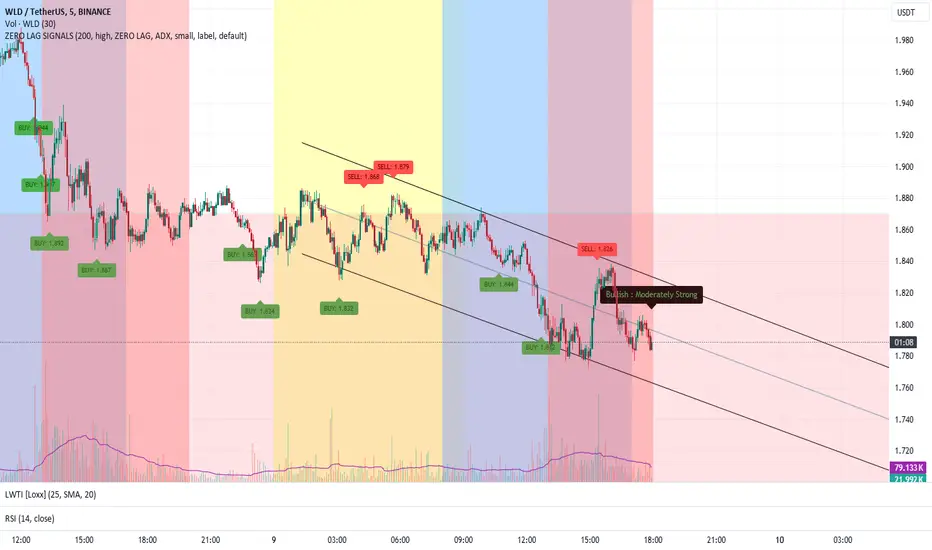
ZERO LAG TRADE SIGNALS by BootcampZeroThe ZERO LAG TRADE SIGNALS by BootcampZero indicator is a versatile tool designed to help traders identify optimal entry and exit points for both short-term scalping and long-term trading across multiple time frames. It combines several well-known technical analysis methods, including moving averages, trend analysis, directional indicators, and adaptive trend calculations, to deliver reliable buy and sell signals.
Short-Term Scalping (Under 5-Minute Time Frames)
For short-term traders who prefer quick trades on lower time frames, such as under 5 minutes, this indicator uses a combination of the EMA (Exponential Moving Average) and SMA (Simple Moving Average) to spot fast trend reversals. The indicator is particularly useful for scalpers because it focuses on detecting short-term price momentum by comparing the faster-moving averages with slower ones, triggering signals based on their crossover.
Buy Signals are generated when a fast-moving EMA crosses above a slower-moving SMA, indicating upward momentum.
Sell Signals are triggered when the fast-moving EMA crosses below the slower-moving SMA, signaling potential downward price movement.
In addition, the Adaptive Trend Finder feature dynamically adjusts to recent price deviations and volatility, making it easier for scalpers to spot the prevailing short-term trend with high confidence. The indicator also uses ADX (Average Directional Index) for momentum confirmation, ensuring that signals are only generated during strong price trends, reducing false positives in sideways markets.
Long-Term Trading (Above 1-Day Charts)
When applied to higher time frames such as daily charts or above, this indicator excels in generating reliable long-term buy and sell signals, perfect for swing traders and long-term investors. The Kaufman Adaptive Moving Average (KAMA) and the Ichimoku Cloud are used to assess long-term trends by filtering out market noise and focusing on sustainable price direction.
KAMA helps to adapt the moving average based on market volatility, providing smoother signals that minimize whipsawing in longer-term trades.
Ichimoku Cloud provides additional trend confirmation by identifying whether the market is bullish or bearish based on the relationship between key lines like the Tenkan-Sen (Conversion Line) and Kijun-Sen (Base Line), and how the current price interacts with the Ichimoku Cloud itself.
The indicator also integrates PPO (Percentage Price Oscillator) to capture divergences between price and momentum, further supporting traders in holding positions for extended periods when the signal strength is robust.
Key Technical Values and Factors for Signals
EMA and SMA Crossover: Fast EMA vs. Slow SMA to detect short-term trend reversals.
ADX: Helps gauge the strength of the trend; signals are only generated in trending markets.
KAMA: Filters noise in long-term trends, providing smooth signals based on market volatility.
Ichimoku Cloud: Offers insight into long-term trends and momentum by analyzing price relative to the cloud.
PPO: Detects divergences between price and momentum for trend continuation or reversal signals.
How It Works
Buy signals are generated when bullish conditions are met, and the indicator confirms momentum with ADX, crossover of the EMAs, or a bullish breakout from the Ichimoku Cloud.
Sell signals are triggered when bearish conditions prevail, confirmed by the same factors in reverse, such as a bearish EMA crossover or weakness in ADX.
By combining these powerful tools, ZERO LAG TRADE SIGNALS by BootcampZero offers traders a comprehensive system for both quick scalping trades and more conservative long-term positioning, providing reliable and adaptive signals across different market conditions.
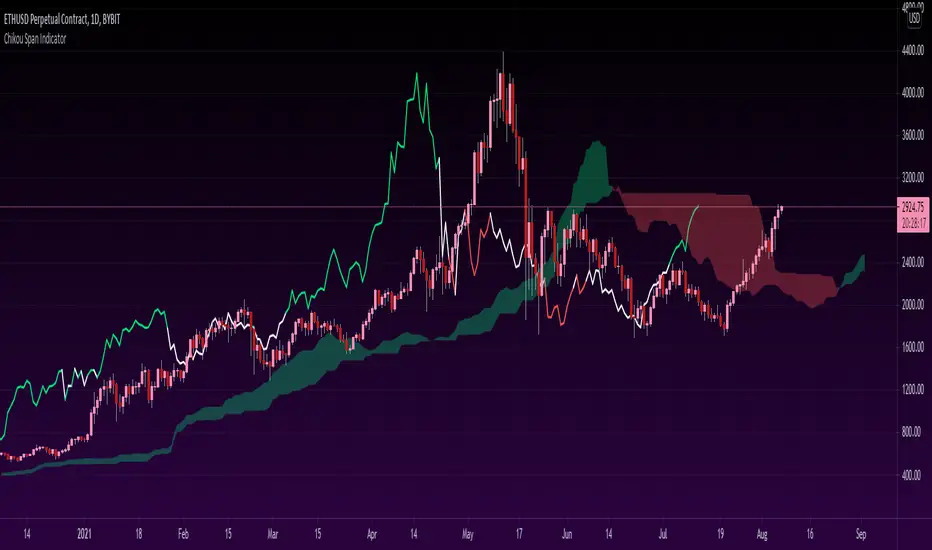
Chikou Span 'Open Space' ColorsThe Ichimoku Clouds strategy has been one of my favorite scripts to work with since I came across it a few months ago, so I thought I'd share one of the automated features I created for the strategy.
For the purpose of this script, I'll only explain the Chikou Span aspect of it since there are plenty of other explanations about Ichimoku Clouds.
The Chikou Span is one of the most useful aspects of the Ichimoku Clouds strategy despite it not being used in most people's strategies. It is calculated by simply taking the current closing value and plotting it backwards 26 bars. The Chikou Span is used to identify large trend moves and trend reversals by what is referred to as 'open space'. This occurs when the Chikou Span is not intersecting any candlestick within 10 bars (if you were to draw a horizontal line from the tip of the Chikou Span, it would not touch any part of a candle within 10 bars).
The purpose of this script is to better identify the Chikou Span reaching 'open space' by coloring the Chikou Span's line:
- Green when it is in upwards open space (bullish trend), and
- Red when it is in downwards open space (bearish trend).
I've also included my personal color scheme for the Ichimoku Clouds strategy as well as inputs to turn on/off every aspect of the strategy.
** Disclaimer: THIS IS NOT TRADING ADVICE. The Chikou Span should not be used on its own to make any trades. When trading with the Ichimoku Cloud strategy, one should utilize all 5 lines of the strategy to make realistic trades. If you'd like to learn more, I'd recommend reading "Trading with Ichimoku Clouds - The Essential Guide to Ichimoku Kinko Hyo Technical Analysis" **
Advanced Fully Reversed Candles with Reversed IchimokuThe "Advanced Fully Reversed Candles with Reversed Ichimoku" indicator is a sophisticated tool designed for traders who seek a unique perspective on market dynamics. This innovative indicator not only reverses the traditional candlestick chart but also inverts the Ichimoku Cloud components, providing a comprehensive view of the market's inverted behavior.
Key Features:
Reversed Candlestick Chart:
The indicator recalculates the OHLC (Open, High, Low, Close) prices by reversing them along the price axis. This means that what typically would be an upward movement is displayed as a downward movement, and vice versa. This reversal provides an alternative view that can help traders identify hidden patterns and potential reversal points that might not be obvious on a standard chart.
Reversed Ichimoku Cloud:
All components of the Ichimoku Cloud indicator are recalculated based on the reversed price data. This includes:
Tenkan-sen (Conversion Line): Reversed based on the highest and lowest prices over the specified period.
Kijun-sen (Base Line): Reversed in a similar manner to the Tenkan-sen, providing a medium-term perspective on price trends.
Senkou Span A (Leading Span A): Reversed to form one boundary of the Kumo (cloud), offering insight into future support and resistance levels.
Senkou Span B (Leading Span B): Reversed to form the other boundary of the Kumo, complementing Senkou Span A.
Chikou Span (Lagging Span): Reversed and plotted backward for additional confirmation of trend direction and strength.
Dynamic Price Range Calculation:
The indicator dynamically calculates the maximum and minimum prices over the last 500 bars (or the available range if fewer bars are present). This ensures that the reversal is always based on the most relevant data, providing accurate and up-to-date visualizations.
Visual Enhancements:
The reversed candlesticks are color-coded for easy interpretation: green for upward movements and red for downward movements, based on the reversed data.
The Ichimoku Cloud is filled with semi-transparent colors to clearly distinguish between bullish and bearish conditions even in its reversed state.
Debugging Aids:
For transparency and accuracy, the indicator plots the maximum and minimum price lines used for the reversal calculations. This allows users to verify the internal workings of the indicator and ensure the reversal logic is correctly applied.
Usage:
This indicator is ideal for advanced traders and analysts who want to explore market behavior from an unconventional angle. By reversing both the candlestick chart and the Ichimoku Cloud, it provides a unique perspective that can uncover new trading opportunities and enhance market analysis.
Customization:
Users can customize the periods for the Tenkan-sen, Kijun-sen, and Senkou Span B, as well as the displacement for the Ichimoku Cloud. This flexibility allows traders to adapt the indicator to their specific trading strategies and timeframes.
Conclusion:
The "Advanced Fully Reversed Candles with Reversed Ichimoku" indicator is a powerful tool that transforms traditional market analysis. By inverting both price movements and key technical indicators, it opens up a new dimension of trading insights, helping traders to see the market in a completely different light.
Parameters:
Tenkan-sen period (default: 9)
Kijun-sen period (default: 26)
Senkou Span B period (default: 52)
Displacement (default: 26)
How to Apply:
Add the script to your TradingView account via the Pine Editor.
Customize the parameters according to your trading strategy.
Analyze the reversed candlestick chart and Ichimoku Cloud to gain unique insights into market trends and potential reversal points.

Markov Chain [3D] | FractalystWhat exactly is a Markov Chain?
This indicator uses a Markov Chain model to analyze, quantify, and visualize the transitions between market regimes (Bull, Bear, Neutral) on your chart. It dynamically detects these regimes in real-time, calculates transition probabilities, and displays them as animated 3D spheres and arrows, giving traders intuitive insight into current and future market conditions.
How does a Markov Chain work, and how should I read this spheres-and-arrows diagram?
Think of three weather modes: Sunny, Rainy, Cloudy.
Each sphere is one mode. The loop on a sphere means “stay the same next step” (e.g., Sunny again tomorrow).
The arrows leaving a sphere show where things usually go next if they change (e.g., Sunny moving to Cloudy).
Some paths matter more than others. A more prominent loop means the current mode tends to persist. A more prominent outgoing arrow means a change to that destination is the usual next step.
Direction isn’t symmetric: moving Sunny→Cloudy can behave differently than Cloudy→Sunny.
Now relabel the spheres to markets: Bull, Bear, Neutral.
Spheres: market regimes (uptrend, downtrend, range).
Self‑loop: tendency for the current regime to continue on the next bar.
Arrows: the most common next regime if a switch happens.
How to read: Start at the sphere that matches current bar state. If the loop stands out, expect continuation. If one outgoing path stands out, that switch is the typical next step. Opposite directions can differ (Bear→Neutral doesn’t have to match Neutral→Bear).
What states and transitions are shown?
The three market states visualized are:
Bullish (Bull): Upward or strong-market regime.
Bearish (Bear): Downward or weak-market regime.
Neutral: Sideways or range-bound regime.
Bidirectional animated arrows and probability labels show how likely the market is to move from one regime to another (e.g., Bull → Bear or Neutral → Bull).
How does the regime detection system work?
You can use either built-in price returns (based on adaptive Z-score normalization) or supply three custom indicators (such as volume, oscillators, etc.).
Values are statistically normalized (Z-scored) over a configurable lookback period.
The normalized outputs are classified into Bull, Bear, or Neutral zones.
If using three indicators, their regime signals are averaged and smoothed for robustness.
How are transition probabilities calculated?
On every confirmed bar, the algorithm tracks the sequence of detected market states, then builds a rolling window of transitions.
The code maintains a transition count matrix for all regime pairs (e.g., Bull → Bear).
Transition probabilities are extracted for each possible state change using Laplace smoothing for numerical stability, and frequently updated in real-time.
What is unique about the visualization?
3D animated spheres represent each regime and change visually when active.
Animated, bidirectional arrows reveal transition probabilities and allow you to see both dominant and less likely regime flows.
Particles (moving dots) animate along the arrows, enhancing the perception of regime flow direction and speed.
All elements dynamically update with each new price bar, providing a live market map in an intuitive, engaging format.
Can I use custom indicators for regime classification?
Yes! Enable the "Custom Indicators" switch and select any three chart series as inputs. These will be normalized and combined (each with equal weight), broadening the regime classification beyond just price-based movement.
What does the “Lookback Period” control?
Lookback Period (default: 100) sets how much historical data builds the probability matrix. Shorter periods adapt faster to regime changes but may be noisier. Longer periods are more stable but slower to adapt.
How is this different from a Hidden Markov Model (HMM)?
It sets the window for both regime detection and probability calculations. Lower values make the system more reactive, but potentially noisier. Higher values smooth estimates and make the system more robust.
How is this Markov Chain different from a Hidden Markov Model (HMM)?
Markov Chain (as here): All market regimes (Bull, Bear, Neutral) are directly observable on the chart. The transition matrix is built from actual detected regimes, keeping the model simple and interpretable.
Hidden Markov Model: The actual regimes are unobservable ("hidden") and must be inferred from market output or indicator "emissions" using statistical learning algorithms. HMMs are more complex, can capture more subtle structure, but are harder to visualize and require additional machine learning steps for training.
A standard Markov Chain models transitions between observable states using a simple transition matrix, while a Hidden Markov Model assumes the true states are hidden (latent) and must be inferred from observable “emissions” like price or volume data. In practical terms, a Markov Chain is transparent and easier to implement and interpret; an HMM is more expressive but requires statistical inference to estimate hidden states from data.
Markov Chain: states are observable; you directly count or estimate transition probabilities between visible states. This makes it simpler, faster, and easier to validate and tune.
HMM: states are hidden; you only observe emissions generated by those latent states. Learning involves machine learning/statistical algorithms (commonly Baum–Welch/EM for training and Viterbi for decoding) to infer both the transition dynamics and the most likely hidden state sequence from data.
How does the indicator avoid “repainting” or look-ahead bias?
All regime changes and matrix updates happen only on confirmed (closed) bars, so no future data is leaked, ensuring reliable real-time operation.
Are there practical tuning tips?
Tune the Lookback Period for your asset/timeframe: shorter for fast markets, longer for stability.
Use custom indicators if your asset has unique regime drivers.
Watch for rapid changes in transition probabilities as early warning of a possible regime shift.
Who is this indicator for?
Quants and quantitative researchers exploring probabilistic market modeling, especially those interested in regime-switching dynamics and Markov models.
Programmers and system developers who need a probabilistic regime filter for systematic and algorithmic backtesting:
The Markov Chain indicator is ideally suited for programmatic integration via its bias output (1 = Bull, 0 = Neutral, -1 = Bear).
Although the visualization is engaging, the core output is designed for automated, rules-based workflows—not for discretionary/manual trading decisions.
Developers can connect the indicator’s output directly to their Pine Script logic (using input.source()), allowing rapid and robust backtesting of regime-based strategies.
It acts as a plug-and-play regime filter: simply plug the bias output into your entry/exit logic, and you have a scientifically robust, probabilistically-derived signal for filtering, timing, position sizing, or risk regimes.
The MC's output is intentionally "trinary" (1/0/-1), focusing on clear regime states for unambiguous decision-making in code. If you require nuanced, multi-probability or soft-label state vectors, consider expanding the indicator or stacking it with a probability-weighted logic layer in your scripting.
Because it avoids subjectivity, this approach is optimal for systematic quants, algo developers building backtested, repeatable strategies based on probabilistic regime analysis.
What's the mathematical foundation behind this?
The mathematical foundation behind this Markov Chain indicator—and probabilistic regime detection in finance—draws from two principal models: the (standard) Markov Chain and the Hidden Markov Model (HMM).
How to use this indicator programmatically?
The Markov Chain indicator automatically exports a bias value (+1 for Bullish, -1 for Bearish, 0 for Neutral) as a plot visible in the Data Window. This allows you to integrate its regime signal into your own scripts and strategies for backtesting, automation, or live trading.
Step-by-Step Integration with Pine Script (input.source)
Add the Markov Chain indicator to your chart.
This must be done first, since your custom script will "pull" the bias signal from the indicator's plot.
In your strategy, create an input using input.source()
Example:
//@version=5
strategy("MC Bias Strategy Example")
mcBias = input.source(close, "MC Bias Source")
After saving, go to your script’s settings. For the “MC Bias Source” input, select the plot/output of the Markov Chain indicator (typically its bias plot).
Use the bias in your trading logic
Example (long only on Bull, flat otherwise):
if mcBias == 1
strategy.entry("Long", strategy.long)
else
strategy.close("Long")
For more advanced workflows, combine mcBias with additional filters or trailing stops.
How does this work behind-the-scenes?
TradingView’s input.source() lets you use any plot from another indicator as a real-time, “live” data feed in your own script (source).
The selected bias signal is available to your Pine code as a variable, enabling logical decisions based on regime (trend-following, mean-reversion, etc.).
This enables powerful strategy modularity : decouple regime detection from entry/exit logic, allowing fast experimentation without rewriting core signal code.
Integrating 45+ Indicators with Your Markov Chain — How & Why
The Enhanced Custom Indicators Export script exports a massive suite of over 45 technical indicators—ranging from classic momentum (RSI, MACD, Stochastic, etc.) to trend, volume, volatility, and oscillator tools—all pre-calculated, centered/scaled, and available as plots.
// Enhanced Custom Indicators Export - 45 Technical Indicators
// Comprehensive technical analysis suite for advanced market regime detection
//@version=6
indicator('Enhanced Custom Indicators Export | Fractalyst', shorttitle='Enhanced CI Export', overlay=false, scale=scale.right, max_labels_count=500, max_lines_count=500)
// |----- Input Parameters -----| //
momentum_group = "Momentum Indicators"
trend_group = "Trend Indicators"
volume_group = "Volume Indicators"
volatility_group = "Volatility Indicators"
oscillator_group = "Oscillator Indicators"
display_group = "Display Settings"
// Common lengths
length_14 = input.int(14, "Standard Length (14)", minval=1, maxval=100, group=momentum_group)
length_20 = input.int(20, "Medium Length (20)", minval=1, maxval=200, group=trend_group)
length_50 = input.int(50, "Long Length (50)", minval=1, maxval=200, group=trend_group)
// Display options
show_table = input.bool(true, "Show Values Table", group=display_group)
table_size = input.string("Small", "Table Size", options= , group=display_group)
// |----- MOMENTUM INDICATORS (15 indicators) -----| //
// 1. RSI (Relative Strength Index)
rsi_14 = ta.rsi(close, length_14)
rsi_centered = rsi_14 - 50
// 2. Stochastic Oscillator
stoch_k = ta.stoch(close, high, low, length_14)
stoch_d = ta.sma(stoch_k, 3)
stoch_centered = stoch_k - 50
// 3. Williams %R
williams_r = ta.stoch(close, high, low, length_14) - 100
// 4. MACD (Moving Average Convergence Divergence)
= ta.macd(close, 12, 26, 9)
// 5. Momentum (Rate of Change)
momentum = ta.mom(close, length_14)
momentum_pct = (momentum / close ) * 100
// 6. Rate of Change (ROC)
roc = ta.roc(close, length_14)
// 7. Commodity Channel Index (CCI)
cci = ta.cci(close, length_20)
// 8. Money Flow Index (MFI)
mfi = ta.mfi(close, length_14)
mfi_centered = mfi - 50
// 9. Awesome Oscillator (AO)
ao = ta.sma(hl2, 5) - ta.sma(hl2, 34)
// 10. Accelerator Oscillator (AC)
ac = ao - ta.sma(ao, 5)
// 11. Chande Momentum Oscillator (CMO)
cmo = ta.cmo(close, length_14)
// 12. Detrended Price Oscillator (DPO)
dpo = close - ta.sma(close, length_20)
// 13. Price Oscillator (PPO)
ppo = ta.sma(close, 12) - ta.sma(close, 26)
ppo_pct = (ppo / ta.sma(close, 26)) * 100
// 14. TRIX
trix_ema1 = ta.ema(close, length_14)
trix_ema2 = ta.ema(trix_ema1, length_14)
trix_ema3 = ta.ema(trix_ema2, length_14)
trix = ta.roc(trix_ema3, 1) * 10000
// 15. Klinger Oscillator
klinger = ta.ema(volume * (high + low + close) / 3, 34) - ta.ema(volume * (high + low + close) / 3, 55)
// 16. Fisher Transform
fisher_hl2 = 0.5 * (hl2 - ta.lowest(hl2, 10)) / (ta.highest(hl2, 10) - ta.lowest(hl2, 10)) - 0.25
fisher = 0.5 * math.log((1 + fisher_hl2) / (1 - fisher_hl2))
// 17. Stochastic RSI
stoch_rsi = ta.stoch(rsi_14, rsi_14, rsi_14, length_14)
stoch_rsi_centered = stoch_rsi - 50
// 18. Relative Vigor Index (RVI)
rvi_num = ta.swma(close - open)
rvi_den = ta.swma(high - low)
rvi = rvi_den != 0 ? rvi_num / rvi_den : 0
// 19. Balance of Power (BOP)
bop = (close - open) / (high - low)
// |----- TREND INDICATORS (10 indicators) -----| //
// 20. Simple Moving Average Momentum
sma_20 = ta.sma(close, length_20)
sma_momentum = ((close - sma_20) / sma_20) * 100
// 21. Exponential Moving Average Momentum
ema_20 = ta.ema(close, length_20)
ema_momentum = ((close - ema_20) / ema_20) * 100
// 22. Parabolic SAR
sar = ta.sar(0.02, 0.02, 0.2)
sar_trend = close > sar ? 1 : -1
// 23. Linear Regression Slope
lr_slope = ta.linreg(close, length_20, 0) - ta.linreg(close, length_20, 1)
// 24. Moving Average Convergence (MAC)
mac = ta.sma(close, 10) - ta.sma(close, 30)
// 25. Trend Intensity Index (TII)
tii_sum = 0.0
for i = 1 to length_20
tii_sum += close > close ? 1 : 0
tii = (tii_sum / length_20) * 100
// 26. Ichimoku Cloud Components
ichimoku_tenkan = (ta.highest(high, 9) + ta.lowest(low, 9)) / 2
ichimoku_kijun = (ta.highest(high, 26) + ta.lowest(low, 26)) / 2
ichimoku_signal = ichimoku_tenkan > ichimoku_kijun ? 1 : -1
// 27. MESA Adaptive Moving Average (MAMA)
mama_alpha = 2.0 / (length_20 + 1)
mama = ta.ema(close, length_20)
mama_momentum = ((close - mama) / mama) * 100
// 28. Zero Lag Exponential Moving Average (ZLEMA)
zlema_lag = math.round((length_20 - 1) / 2)
zlema_data = close + (close - close )
zlema = ta.ema(zlema_data, length_20)
zlema_momentum = ((close - zlema) / zlema) * 100
// |----- VOLUME INDICATORS (6 indicators) -----| //
// 29. On-Balance Volume (OBV)
obv = ta.obv
// 30. Volume Rate of Change (VROC)
vroc = ta.roc(volume, length_14)
// 31. Price Volume Trend (PVT)
pvt = ta.pvt
// 32. Negative Volume Index (NVI)
nvi = 0.0
nvi := volume < volume ? nvi + ((close - close ) / close ) * nvi : nvi
// 33. Positive Volume Index (PVI)
pvi = 0.0
pvi := volume > volume ? pvi + ((close - close ) / close ) * pvi : pvi
// 34. Volume Oscillator
vol_osc = ta.sma(volume, 5) - ta.sma(volume, 10)
// 35. Ease of Movement (EOM)
eom_distance = high - low
eom_box_height = volume / 1000000
eom = eom_box_height != 0 ? eom_distance / eom_box_height : 0
eom_sma = ta.sma(eom, length_14)
// 36. Force Index
force_index = volume * (close - close )
force_index_sma = ta.sma(force_index, length_14)
// |----- VOLATILITY INDICATORS (10 indicators) -----| //
// 37. Average True Range (ATR)
atr = ta.atr(length_14)
atr_pct = (atr / close) * 100
// 38. Bollinger Bands Position
bb_basis = ta.sma(close, length_20)
bb_dev = 2.0 * ta.stdev(close, length_20)
bb_upper = bb_basis + bb_dev
bb_lower = bb_basis - bb_dev
bb_position = bb_dev != 0 ? (close - bb_basis) / bb_dev : 0
bb_width = bb_dev != 0 ? (bb_upper - bb_lower) / bb_basis * 100 : 0
// 39. Keltner Channels Position
kc_basis = ta.ema(close, length_20)
kc_range = ta.ema(ta.tr, length_20)
kc_upper = kc_basis + (2.0 * kc_range)
kc_lower = kc_basis - (2.0 * kc_range)
kc_position = kc_range != 0 ? (close - kc_basis) / kc_range : 0
// 40. Donchian Channels Position
dc_upper = ta.highest(high, length_20)
dc_lower = ta.lowest(low, length_20)
dc_basis = (dc_upper + dc_lower) / 2
dc_position = (dc_upper - dc_lower) != 0 ? (close - dc_basis) / (dc_upper - dc_lower) : 0
// 41. Standard Deviation
std_dev = ta.stdev(close, length_20)
std_dev_pct = (std_dev / close) * 100
// 42. Relative Volatility Index (RVI)
rvi_up = ta.stdev(close > close ? close : 0, length_14)
rvi_down = ta.stdev(close < close ? close : 0, length_14)
rvi_total = rvi_up + rvi_down
rvi_volatility = rvi_total != 0 ? (rvi_up / rvi_total) * 100 : 50
// 43. Historical Volatility
hv_returns = math.log(close / close )
hv = ta.stdev(hv_returns, length_20) * math.sqrt(252) * 100
// 44. Garman-Klass Volatility
gk_vol = math.log(high/low) * math.log(high/low) - (2*math.log(2)-1) * math.log(close/open) * math.log(close/open)
gk_volatility = math.sqrt(ta.sma(gk_vol, length_20)) * 100
// 45. Parkinson Volatility
park_vol = math.log(high/low) * math.log(high/low)
parkinson = math.sqrt(ta.sma(park_vol, length_20) / (4 * math.log(2))) * 100
// 46. Rogers-Satchell Volatility
rs_vol = math.log(high/close) * math.log(high/open) + math.log(low/close) * math.log(low/open)
rogers_satchell = math.sqrt(ta.sma(rs_vol, length_20)) * 100
// |----- OSCILLATOR INDICATORS (5 indicators) -----| //
// 47. Elder Ray Index
elder_bull = high - ta.ema(close, 13)
elder_bear = low - ta.ema(close, 13)
elder_power = elder_bull + elder_bear
// 48. Schaff Trend Cycle (STC)
stc_macd = ta.ema(close, 23) - ta.ema(close, 50)
stc_k = ta.stoch(stc_macd, stc_macd, stc_macd, 10)
stc_d = ta.ema(stc_k, 3)
stc = ta.stoch(stc_d, stc_d, stc_d, 10)
// 49. Coppock Curve
coppock_roc1 = ta.roc(close, 14)
coppock_roc2 = ta.roc(close, 11)
coppock = ta.wma(coppock_roc1 + coppock_roc2, 10)
// 50. Know Sure Thing (KST)
kst_roc1 = ta.roc(close, 10)
kst_roc2 = ta.roc(close, 15)
kst_roc3 = ta.roc(close, 20)
kst_roc4 = ta.roc(close, 30)
kst = ta.sma(kst_roc1, 10) + 2*ta.sma(kst_roc2, 10) + 3*ta.sma(kst_roc3, 10) + 4*ta.sma(kst_roc4, 15)
// 51. Percentage Price Oscillator (PPO)
ppo_line = ((ta.ema(close, 12) - ta.ema(close, 26)) / ta.ema(close, 26)) * 100
ppo_signal = ta.ema(ppo_line, 9)
ppo_histogram = ppo_line - ppo_signal
// |----- PLOT MAIN INDICATORS -----| //
// Plot key momentum indicators
plot(rsi_centered, title="01_RSI_Centered", color=color.purple, linewidth=1)
plot(stoch_centered, title="02_Stoch_Centered", color=color.blue, linewidth=1)
plot(williams_r, title="03_Williams_R", color=color.red, linewidth=1)
plot(macd_histogram, title="04_MACD_Histogram", color=color.orange, linewidth=1)
plot(cci, title="05_CCI", color=color.green, linewidth=1)
// Plot trend indicators
plot(sma_momentum, title="06_SMA_Momentum", color=color.navy, linewidth=1)
plot(ema_momentum, title="07_EMA_Momentum", color=color.maroon, linewidth=1)
plot(sar_trend, title="08_SAR_Trend", color=color.teal, linewidth=1)
plot(lr_slope, title="09_LR_Slope", color=color.lime, linewidth=1)
plot(mac, title="10_MAC", color=color.fuchsia, linewidth=1)
// Plot volatility indicators
plot(atr_pct, title="11_ATR_Pct", color=color.yellow, linewidth=1)
plot(bb_position, title="12_BB_Position", color=color.aqua, linewidth=1)
plot(kc_position, title="13_KC_Position", color=color.olive, linewidth=1)
plot(std_dev_pct, title="14_StdDev_Pct", color=color.silver, linewidth=1)
plot(bb_width, title="15_BB_Width", color=color.gray, linewidth=1)
// Plot volume indicators
plot(vroc, title="16_VROC", color=color.blue, linewidth=1)
plot(eom_sma, title="17_EOM", color=color.red, linewidth=1)
plot(vol_osc, title="18_Vol_Osc", color=color.green, linewidth=1)
plot(force_index_sma, title="19_Force_Index", color=color.orange, linewidth=1)
plot(obv, title="20_OBV", color=color.purple, linewidth=1)
// Plot additional oscillators
plot(ao, title="21_Awesome_Osc", color=color.navy, linewidth=1)
plot(cmo, title="22_CMO", color=color.maroon, linewidth=1)
plot(dpo, title="23_DPO", color=color.teal, linewidth=1)
plot(trix, title="24_TRIX", color=color.lime, linewidth=1)
plot(fisher, title="25_Fisher", color=color.fuchsia, linewidth=1)
// Plot more momentum indicators
plot(mfi_centered, title="26_MFI_Centered", color=color.yellow, linewidth=1)
plot(ac, title="27_AC", color=color.aqua, linewidth=1)
plot(ppo_pct, title="28_PPO_Pct", color=color.olive, linewidth=1)
plot(stoch_rsi_centered, title="29_StochRSI_Centered", color=color.silver, linewidth=1)
plot(klinger, title="30_Klinger", color=color.gray, linewidth=1)
// Plot trend continuation
plot(tii, title="31_TII", color=color.blue, linewidth=1)
plot(ichimoku_signal, title="32_Ichimoku_Signal", color=color.red, linewidth=1)
plot(mama_momentum, title="33_MAMA_Momentum", color=color.green, linewidth=1)
plot(zlema_momentum, title="34_ZLEMA_Momentum", color=color.orange, linewidth=1)
plot(bop, title="35_BOP", color=color.purple, linewidth=1)
// Plot volume continuation
plot(nvi, title="36_NVI", color=color.navy, linewidth=1)
plot(pvi, title="37_PVI", color=color.maroon, linewidth=1)
plot(momentum_pct, title="38_Momentum_Pct", color=color.teal, linewidth=1)
plot(roc, title="39_ROC", color=color.lime, linewidth=1)
plot(rvi, title="40_RVI", color=color.fuchsia, linewidth=1)
// Plot volatility continuation
plot(dc_position, title="41_DC_Position", color=color.yellow, linewidth=1)
plot(rvi_volatility, title="42_RVI_Volatility", color=color.aqua, linewidth=1)
plot(hv, title="43_Historical_Vol", color=color.olive, linewidth=1)
plot(gk_volatility, title="44_GK_Volatility", color=color.silver, linewidth=1)
plot(parkinson, title="45_Parkinson_Vol", color=color.gray, linewidth=1)
// Plot final oscillators
plot(rogers_satchell, title="46_RS_Volatility", color=color.blue, linewidth=1)
plot(elder_power, title="47_Elder_Power", color=color.red, linewidth=1)
plot(stc, title="48_STC", color=color.green, linewidth=1)
plot(coppock, title="49_Coppock", color=color.orange, linewidth=1)
plot(kst, title="50_KST", color=color.purple, linewidth=1)
// Plot final indicators
plot(ppo_histogram, title="51_PPO_Histogram", color=color.navy, linewidth=1)
plot(pvt, title="52_PVT", color=color.maroon, linewidth=1)
// |----- Reference Lines -----| //
hline(0, "Zero Line", color=color.gray, linestyle=hline.style_dashed, linewidth=1)
hline(50, "Midline", color=color.gray, linestyle=hline.style_dotted, linewidth=1)
hline(-50, "Lower Midline", color=color.gray, linestyle=hline.style_dotted, linewidth=1)
hline(25, "Upper Threshold", color=color.gray, linestyle=hline.style_dotted, linewidth=1)
hline(-25, "Lower Threshold", color=color.gray, linestyle=hline.style_dotted, linewidth=1)
// |----- Enhanced Information Table -----| //
if show_table and barstate.islast
table_position = position.top_right
table_text_size = table_size == "Tiny" ? size.tiny : table_size == "Small" ? size.small : size.normal
var table info_table = table.new(table_position, 3, 18, bgcolor=color.new(color.white, 85), border_width=1, border_color=color.gray)
// Headers
table.cell(info_table, 0, 0, 'Category', text_color=color.black, text_size=table_text_size, bgcolor=color.new(color.blue, 70))
table.cell(info_table, 1, 0, 'Indicator', text_color=color.black, text_size=table_text_size, bgcolor=color.new(color.blue, 70))
table.cell(info_table, 2, 0, 'Value', text_color=color.black, text_size=table_text_size, bgcolor=color.new(color.blue, 70))
// Key Momentum Indicators
table.cell(info_table, 0, 1, 'MOMENTUM', text_color=color.purple, text_size=table_text_size, bgcolor=color.new(color.purple, 90))
table.cell(info_table, 1, 1, 'RSI Centered', text_color=color.purple, text_size=table_text_size)
table.cell(info_table, 2, 1, str.tostring(rsi_centered, '0.00'), text_color=color.purple, text_size=table_text_size)
table.cell(info_table, 0, 2, '', text_color=color.blue, text_size=table_text_size)
table.cell(info_table, 1, 2, 'Stoch Centered', text_color=color.blue, text_size=table_text_size)
table.cell(info_table, 2, 2, str.tostring(stoch_centered, '0.00'), text_color=color.blue, text_size=table_text_size)
table.cell(info_table, 0, 3, '', text_color=color.red, text_size=table_text_size)
table.cell(info_table, 1, 3, 'Williams %R', text_color=color.red, text_size=table_text_size)
table.cell(info_table, 2, 3, str.tostring(williams_r, '0.00'), text_color=color.red, text_size=table_text_size)
table.cell(info_table, 0, 4, '', text_color=color.orange, text_size=table_text_size)
table.cell(info_table, 1, 4, 'MACD Histogram', text_color=color.orange, text_size=table_text_size)
table.cell(info_table, 2, 4, str.tostring(macd_histogram, '0.000'), text_color=color.orange, text_size=table_text_size)
table.cell(info_table, 0, 5, '', text_color=color.green, text_size=table_text_size)
table.cell(info_table, 1, 5, 'CCI', text_color=color.green, text_size=table_text_size)
table.cell(info_table, 2, 5, str.tostring(cci, '0.00'), text_color=color.green, text_size=table_text_size)
// Key Trend Indicators
table.cell(info_table, 0, 6, 'TREND', text_color=color.navy, text_size=table_text_size, bgcolor=color.new(color.navy, 90))
table.cell(info_table, 1, 6, 'SMA Momentum %', text_color=color.navy, text_size=table_text_size)
table.cell(info_table, 2, 6, str.tostring(sma_momentum, '0.00'), text_color=color.navy, text_size=table_text_size)
table.cell(info_table, 0, 7, '', text_color=color.maroon, text_size=table_text_size)
table.cell(info_table, 1, 7, 'EMA Momentum %', text_color=color.maroon, text_size=table_text_size)
table.cell(info_table, 2, 7, str.tostring(ema_momentum, '0.00'), text_color=color.maroon, text_size=table_text_size)
table.cell(info_table, 0, 8, '', text_color=color.teal, text_size=table_text_size)
table.cell(info_table, 1, 8, 'SAR Trend', text_color=color.teal, text_size=table_text_size)
table.cell(info_table, 2, 8, str.tostring(sar_trend, '0'), text_color=color.teal, text_size=table_text_size)
table.cell(info_table, 0, 9, '', text_color=color.lime, text_size=table_text_size)
table.cell(info_table, 1, 9, 'Linear Regression', text_color=color.lime, text_size=table_text_size)
table.cell(info_table, 2, 9, str.tostring(lr_slope, '0.000'), text_color=color.lime, text_size=table_text_size)
// Key Volatility Indicators
table.cell(info_table, 0, 10, 'VOLATILITY', text_color=color.yellow, text_size=table_text_size, bgcolor=color.new(color.yellow, 90))
table.cell(info_table, 1, 10, 'ATR %', text_color=color.yellow, text_size=table_text_size)
table.cell(info_table, 2, 10, str.tostring(atr_pct, '0.00'), text_color=color.yellow, text_size=table_text_size)
table.cell(info_table, 0, 11, '', text_color=color.aqua, text_size=table_text_size)
table.cell(info_table, 1, 11, 'BB Position', text_color=color.aqua, text_size=table_text_size)
table.cell(info_table, 2, 11, str.tostring(bb_position, '0.00'), text_color=color.aqua, text_size=table_text_size)
table.cell(info_table, 0, 12, '', text_color=color.olive, text_size=table_text_size)
table.cell(info_table, 1, 12, 'KC Position', text_color=color.olive, text_size=table_text_size)
table.cell(info_table, 2, 12, str.tostring(kc_position, '0.00'), text_color=color.olive, text_size=table_text_size)
// Key Volume Indicators
table.cell(info_table, 0, 13, 'VOLUME', text_color=color.blue, text_size=table_text_size, bgcolor=color.new(color.blue, 90))
table.cell(info_table, 1, 13, 'Volume ROC', text_color=color.blue, text_size=table_text_size)
table.cell(info_table, 2, 13, str.tostring(vroc, '0.00'), text_color=color.blue, text_size=table_text_size)
table.cell(info_table, 0, 14, '', text_color=color.red, text_size=table_text_size)
table.cell(info_table, 1, 14, 'EOM', text_color=color.red, text_size=table_text_size)
table.cell(info_table, 2, 14, str.tostring(eom_sma, '0.000'), text_color=color.red, text_size=table_text_size)
// Key Oscillators
table.cell(info_table, 0, 15, 'OSCILLATORS', text_color=color.purple, text_size=table_text_size, bgcolor=color.new(color.purple, 90))
table.cell(info_table, 1, 15, 'Awesome Osc', text_color=color.blue, text_size=table_text_size)
table.cell(info_table, 2, 15, str.tostring(ao, '0.000'), text_color=color.blue, text_size=table_text_size)
table.cell(info_table, 0, 16, '', text_color=color.red, text_size=table_text_size)
table.cell(info_table, 1, 16, 'Fisher Transform', text_color=color.red, text_size=table_text_size)
table.cell(info_table, 2, 16, str.tostring(fisher, '0.000'), text_color=color.red, text_size=table_text_size)
// Summary Statistics
table.cell(info_table, 0, 17, 'SUMMARY', text_color=color.black, text_size=table_text_size, bgcolor=color.new(color.gray, 70))
table.cell(info_table, 1, 17, 'Total Indicators: 52', text_color=color.black, text_size=table_text_size)
regime_color = rsi_centered > 10 ? color.green : rsi_centered < -10 ? color.red : color.gray
regime_text = rsi_centered > 10 ? "BULLISH" : rsi_centered < -10 ? "BEARISH" : "NEUTRAL"
table.cell(info_table, 2, 17, regime_text, text_color=regime_color, text_size=table_text_size)
This makes it the perfect “indicator backbone” for quantitative and systematic traders who want to prototype, combine, and test new regime detection models—especially in combination with the Markov Chain indicator.
How to use this script with the Markov Chain for research and backtesting:
Add the Enhanced Indicator Export to your chart.
Every calculated indicator is available as an individual data stream.
Connect the indicator(s) you want as custom input(s) to the Markov Chain’s “Custom Indicators” option.
In the Markov Chain indicator’s settings, turn ON the custom indicator mode.
For each of the three custom indicator inputs, select the exported plot from the Enhanced Export script—the menu lists all 45+ signals by name.
This creates a powerful, modular regime-detection engine where you can mix-and-match momentum, trend, volume, or custom combinations for advanced filtering.
Backtest regime logic directly.
Once you’ve connected your chosen indicators, the Markov Chain script performs regime detection (Bull/Neutral/Bear) based on your selected features—not just price returns.
The regime detection is robust, automatically normalized (using Z-score), and outputs bias (1, -1, 0) for plug-and-play integration.
Export the regime bias for programmatic use.
As described above, use input.source() in your Pine Script strategy or system and link the bias output.
You can now filter signals, control trade direction/size, or design pairs-trading that respect true, indicator-driven market regimes.
With this framework, you’re not limited to static or simplistic regime filters. You can rigorously define, test, and refine what “market regime” means for your strategies—using the technical features that matter most to you.
Optimize your signal generation by backtesting across a universe of meaningful indicator blends.
Enhance risk management with objective, real-time regime boundaries.
Accelerate your research: iterate quickly, swap indicator components, and see results with minimal code changes.
Automate multi-asset or pairs-trading by integrating regime context directly into strategy logic.
Add both scripts to your chart, connect your preferred features, and start investigating your best regime-based trades—entirely within the TradingView ecosystem.
References & Further Reading
Ang, A., & Bekaert, G. (2002). “Regime Switches in Interest Rates.” Journal of Business & Economic Statistics, 20(2), 163–182.
Hamilton, J. D. (1989). “A New Approach to the Economic Analysis of Nonstationary Time Series and the Business Cycle.” Econometrica, 57(2), 357–384.
Markov, A. A. (1906). "Extension of the Limit Theorems of Probability Theory to a Sum of Variables Connected in a Chain." The Notes of the Imperial Academy of Sciences of St. Petersburg.
Guidolin, M., & Timmermann, A. (2007). “Asset Allocation under Multivariate Regime Switching.” Journal of Economic Dynamics and Control, 31(11), 3503–3544.
Murphy, J. J. (1999). Technical Analysis of the Financial Markets. New York Institute of Finance.
Brock, W., Lakonishok, J., & LeBaron, B. (1992). “Simple Technical Trading Rules and the Stochastic Properties of Stock Returns.” Journal of Finance, 47(5), 1731–1764.
Zucchini, W., MacDonald, I. L., & Langrock, R. (2017). Hidden Markov Models for Time Series: An Introduction Using R (2nd ed.). Chapman and Hall/CRC.
On Quantitative Finance and Markov Models:
Lo, A. W., & Hasanhodzic, J. (2009). The Heretics of Finance: Conversations with Leading Practitioners of Technical Analysis. Bloomberg Press.
Patterson, S. (2016). The Man Who Solved the Market: How Jim Simons Launched the Quant Revolution. Penguin Press.
TradingView Pine Script Documentation: www.tradingview.com
TradingView Blog: “Use an Input From Another Indicator With Your Strategy” www.tradingview.com
GeeksforGeeks: “What is the Difference Between Markov Chains and Hidden Markov Models?” www.geeksforgeeks.org
What makes this indicator original and unique?
- On‑chart, real‑time Markov. The chain is drawn directly on your chart. You see the current regime, its tendency to stay (self‑loop), and the usual next step (arrows) as bars confirm.
- Source‑agnostic by design. The engine runs on any series you select via input.source() — price, your own oscillator, a composite score, anything you compute in the script.
- Automatic normalization + regime mapping. Different inputs live on different scales. The script standardizes your chosen source and maps it into clear regimes (e.g., Bull / Bear / Neutral) without you micromanaging thresholds each time.
- Rolling, bar‑by‑bar learning. Transition tendencies are computed from a rolling window of confirmed bars. What you see is exactly what the market did in that window.
- Fast experimentation. Switch the source, adjust the window, and the Markov view updates instantly. It’s a rapid way to test ideas and feel regime persistence/switch behavior.
Integrate your own signals (using input.source())
- In settings, choose the Source . This is powered by input.source() .
- Feed it price, an indicator you compute inside the script, or a custom composite series.
- The script will automatically normalize that series and process it through the Markov engine, mapping it to regimes and updating the on‑chart spheres/arrows in real time.
Credits:
Deep gratitude to @RicardoSantos for both the foundational Markov chain processing engine and inspiring open-source contributions, which made advanced probabilistic market modeling accessible to the TradingView community.
Special thanks to @Alien_Algorithms for the innovative and visually stunning 3D sphere logic that powers the indicator’s animated, regime-based visualization.
Disclaimer
This tool summarizes recent behavior. It is not financial advice and not a guarantee of future results.

DenP Ichimoku Interpreter (DII)A simple indicator using Ishimoku as a basis, giving entry and exit signals.
Components of the Ichimoku Cloud
The Ichimoku system consists of multiple lines that help traders understand market trends, momentum, and potential reversals.
1. Tenkan-Sen (Conversion Line) - Blue
Formula: (Highest High + Lowest Low) / 2 over the last 9 periods (default).
Purpose: Measures short-term trend direction.
Interpretation:
Upward movement: Indicates bullish momentum.
Downward movement: Indicates bearish momentum.
Flat line: Indicates consolidation.
2. Kijun-Sen (Base Line) - Red
Formula: (Highest High + Lowest Low) / 2 over the last 26 periods (default).
Purpose: Represents medium-term trend.
Interpretation:
Price above Kijun-Sen: Bullish signal.
Price below Kijun-Sen: Bearish signal.
Flat Kijun-Sen: Market in consolidation.
3. Senkou Span A (Leading Span A) - Light Green
Formula: (Tenkan-Sen + Kijun-Sen) / 2, plotted 26 periods ahead.
Purpose: Forms one of the Ichimoku Cloud boundaries.
Interpretation:
If Senkou Span A is rising, the market is bullish.
If Senkou Span A is falling, the market is bearish.
4. Senkou Span B (Leading Span B) - Light Red
Formula: (Highest High + Lowest Low) / 2 over the last 52 periods, plotted 26 periods ahead.
Purpose: Forms the second boundary of the Ichimoku Cloud.
Interpretation:
If price is above the cloud, the market is in a strong uptrend.
If price is below the cloud, the market is in a strong downtrend.
If price is inside the cloud, the market is consolidating.
5. Kumo (Cloud)
The area between Senkou Span A and Senkou Span B is shaded.
Green Cloud (Span A above Span B): Bullish trend.
Red Cloud (Span B above Span A): Bearish trend.
The thickness of the cloud represents market volatility.
6. Chikou Span (Lagging Line) - Green
Formula: Current closing price plotted 26 periods back.
Purpose: Confirms trend direction.
Interpretation:
Chikou Span above price 26 periods ago: Bullish.
Chikou Span below price 26 periods ago: Bearish.
Buy and Sell Conditions
The indicator generates buy and sell signals based on Ichimoku components.
1. Kijun Cross (Medium-Term Trend)
Buy Signal: When the closing price crosses above the Kijun-Sen (red line).
Sell Signal: When the closing price crosses below the Kijun-Sen.
2. Cloud Breakout (Senkou Span Cross)
Buy Signal:
When Senkou Span A is above Senkou Span B, and the price crosses above the cloud.
Indicates a strong uptrend.
Sell Signal:
When Senkou Span B is above Senkou Span A, and the price crosses below the cloud.
Indicates a strong downtrend.
3. Chikou Span Confirmation (Momentum Confirmation)
Buy Signal:
If Chikou Span (green) crosses above past price action, it confirms a bullish trend.
Used to validate Kijun and Cloud Buy signals.
Sell Signal:
If Chikou Span crosses below past price action, it confirms a bearish trend.
Visual Signals
The indicator plots triangles on the chart to indicate buy and sell signals:
Kijun Buy Signal: Upward triangle (green).
Kijun Sell Signal: Downward triangle (red).
Cloud Buy Signal: Upward triangle (green) near the cloud.
Cloud Sell Signal: Downward triangle (red) near the cloud.
Chikou Confirmation Buy: Upward triangle (green, confirming previous signals).
Chikou Confirmation Sell: Downward triangle (red, confirming previous signals).
Additional Features
Customizable Colors & Settings: Users can adjust colors, time periods, and display settings.
On-Chart Table: Displays current trend interpretations for easy reference.
How to Use the Indicator?
Check the Cloud Position:
Price above the cloud = bullish.
Price below the cloud = bearish.
Price inside the cloud = consolidation.
Look for Kijun Crosses:
Buy when price crosses above Kijun-Sen.
Sell when price crosses below Kijun-Sen.
Confirm with Chikou Span:
If Chikou Span supports the buy/sell signal, it's more reliable.
Use Cloud Breakouts for Trend Reversals:
If price moves from below to above the cloud = strong buy.
If price moves from above to below the cloud = strong sell.

Momentum CloudThis is a modified Ichimoku Cloud:
-The default Lookback-Length and Displacement settings have been modified to operate optimally on 24/7 markets - which is popular among Crypto analysts.
-The Lagging Span, Base Line, and Conversion Line have been removed - leaving just the bare cloud.
-Additionally, the Cloud's color will shift blue when it is compressed. (More specifically - when Leading Span A retreats to Leading Span B, the color changes.)
This allows the user to easily identify when the Cloud is "thinning", either to the upside, or the downside.
Being that the "spread" or "width" of an Ichimoku Cloud generally gauges it's efficacy as potential Support or Resistance, this tool is particularly useful for highlighting when momentum is weakening.
*This script will be updated in the future to allow the user to view the Momentum Cloud of alternate time-frames! (e.g, Viewing the 1D Momentum Cloud on the 1H timeframe)

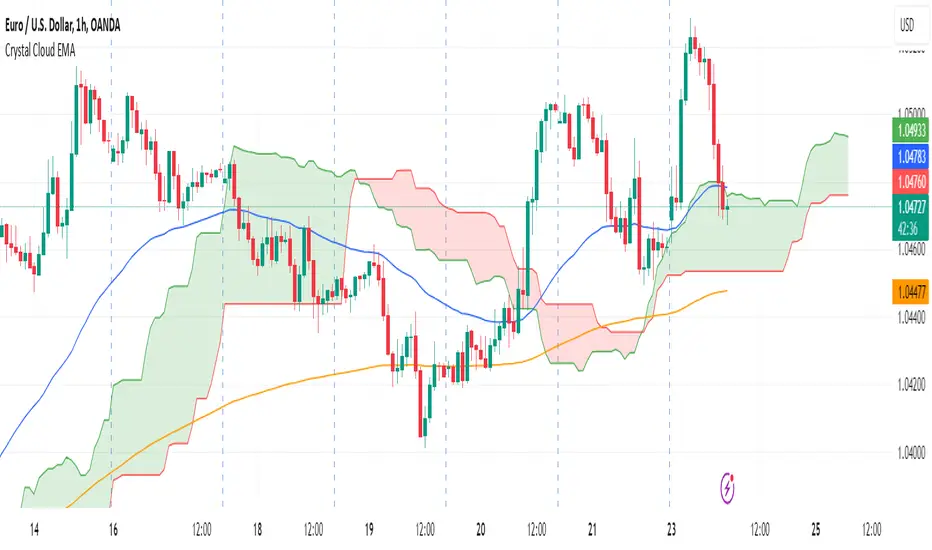
Crystal Cloud EMA# Crystal Cloud EMA Indicator 🚀
The **Crystal Cloud EMA Indicator** is a hybrid technical analysis tool that uniquely merges the multi-dimensional perspective of the Ichimoku Cloud with the precision of EMA crossovers (EMA 50 & EMA 200). This integration is designed to help traders identify key market trends, dynamic support and resistance zones, and potential momentum shifts with enhanced clarity and reliability.
---
## Key Components & Originality
### Ichimoku Cloud
- **Dynamic Support & Resistance:**
Utilizes standard Ichimoku calculations to form a cloud (Kumo) that highlights areas where price may find support or resistance.
- **Visual Clarity:**
The cloud’s upper and lower boundaries provide clear visual cues of market sentiment, helping to identify potential reversal or consolidation zones.
### EMA 50 & EMA 200
- **Trend Confirmation:**
These exponential moving averages smooth price data to reveal underlying trends.
- **Crossover Signals:**
A crossover of EMA 50 and EMA 200 is used as a signal confirmation—when EMA 50 crosses above EMA 200, it suggests a bullish trend; when it crosses below, it indicates a bearish trend.
### Unique Integration
- **Combined Analysis for Enhanced Accuracy:**
By fusing the Ichimoku Cloud’s dynamic support/resistance zones with the precise timing of EMA crossovers, the indicator minimizes false signals.
- **Confluence of Methods:**
Only when both the cloud position and EMA crossover align does the indicator generate a trading signal, offering a more robust framework than using either method in isolation.
---
## How It Works
1. **Cloud Evaluation:**
- The indicator calculates the Ichimoku Cloud using traditional parameters, establishing dynamic zones where price reactions are likely.
- It monitors how price interacts with these zones, signaling potential momentum shifts when the price moves in or out of the cloud.
2. **EMA Crossover Analysis:**
- Simultaneously, it computes EMA 50 and EMA 200.
- **Bullish Condition:** When price is above the cloud and EMA 50 crosses above EMA 200.
- **Bearish Condition:** When price is below the cloud and EMA 50 crosses below EMA 200.
3. **Signal Confirmation:**
- A breakout from the cloud, in conjunction with a crossover, further validates the strength of the trend.
- This dual confirmation approach filters out market noise and increases the reliability of the signals.
---
## Trading Strategy & Usage
### Buy Signal
- **Conditions:**
- Price is trading above the Ichimoku Cloud.
- EMA 50 crosses above EMA 200.
- A confirmed breakout above the cloud supports the bullish trend.
- **Application:**
- Enter long positions when these conditions align.
- Use the cloud’s lower boundary for potential stop-loss placement and set profit targets based on key resistance levels identified by the cloud.
### Sell Signal
- **Conditions:**
- Price is trading below the Ichimoku Cloud.
- EMA 50 crosses below EMA 200.
- A breakdown below the cloud reinforces the bearish trend.
- **Application:**
- Enter short positions under these conditions.
- Use the cloud’s upper boundary as a reference for setting stop-loss orders and profit targets.
### Best Timeframes & Trading Styles
- **Timeframes:**
Optimally used on M30 and higher timeframes to ensure trend reliability and reduce market noise.
- **Trading Styles:**
Suitable for swing trading, intraday trading, and momentum-based strategies.
- **Risk Management:**
Always complement indicator signals with additional analysis (like volume or price action) and apply proper risk management techniques.
---
## Important Note
This indicator is a **technical analysis tool** designed to assist traders in identifying market trends and potential reversal points. It should be used in conjunction with comprehensive market analysis and proper risk management. Trading decisions should not rely solely on this indicator.
3SMA + Ichimoku 2leadlineThis indicator simultaneously displays two lines, which are the leading spans of the Ichimoku Kinko Hyo, and three simple moving averages.
To make it easier to distinguish between the simple moving average line and the line of the Ichimoku Kinko Hyo, the simple moving average line is set to level 2 thickness by default.
Also, the color of Reading Span 1 in the Ichimoku Kinko Hyo has been changed from green to lime to improve color visibility.
I (author of this indicator) use this indicator especially as a simple perspective on the cryptocurrency BTC / USD(USDT).
If this indicator is a problem, moderators don't know about tradingview beginners.
" Visibility " should be a high-priority item not only for indicators but also for graph requirements.
Visibility is one of the most important factors for investors who have to make instant decisions in one minute and one second.
The purpose of this indicator is to display two leading spans that are easily noticed in the Ichimoku cloud and three simple moving averages whose set values can be changed.
This is because chart analysis often uses a combination of a simple moving average of three periods and two lead spans of the Ichimoku cloud.
Also, in chart analysis, green is often displayed with the same thickness on both the moving average line and the Ichimoku cloud.
Therefore, if the moving average line and the Ichimoku cloud often use the same green color, the visibility will drop. Therefore, the green color of Ichimoku cloud was changed to lime color by default.
Tradingview beginners often refer only to the two lines of the leading span of Ichimoku Cloud. Therefore, we decided not to draw lines that are difficult to use.
Many Tradingview beginners don't know that you can change the thickness of the indicator .
Therefore, this indicator shows by DEFAULT the three commonly used simple moving averages that are thickened by one step at the same time.
Also, since the same green color is often used for the Ichimoku cloud and the moving average line, the green color of the preceding span of the Ichimoku cloud is changed to lime color by default.
The originality of this indicator is that it enhances " visibility " so that novice tradingview users will not be confused on the chart screen.
The lines other than the preceding span of the Ichimoku cloud are not displayed, and the moving average line is level 2 thick so that the user can easily see it.
This indicator not only combines a simple moving average and Ichimoku cloud, but also improves "visibility" by not incorporating lines that are difficult to see from the beginning and making it only the minimum display, making it easy for beginners to understand. The purpose is to do.
If any of the other TradingView indicators already meet the following, acknowledge that this indicator is not original.
・Display 3 simple moving averages at the same time
・For visibility, the thickness of the simple moving average line is set to level 2 from the beginning.
・A setting that does not dare to draw lines other than the lead span of Ichimoku cloud.
・Make the moving average line and the Ichimoku cloud line different colors and thicknesses from the beginning.

Ichimoku Crosses_RSI_AITIchimoku Crosser_RSI_AIT
Overview
The "Ichimoku Cloud Crosses_AIT" strategy is a technical trading strategy that combines the Ichimoku Cloud components with the Relative Strength Index (RSI) to generate trade signals. This strategy leverages the crossovers of the Tenkan-sen and Kijun-sen lines of the Ichimoku Cloud, along with RSI levels, to identify potential entry and exit points for long and short trades. This guide explains the strategy components, conditions, and how to use it effectively in your trading.
1. Strategy Parameters
User Inputs
Tenkan-sen Period (tenkanLength): Default value is 21. This is the period used to calculate the Tenkan-sen line (conversion line) of the Ichimoku Cloud.
Kijun-sen Period (kijunLength): Default value is 120. This is the period used to calculate the Kijun-sen line (base line) of the Ichimoku Cloud.
Senkou Span B Period (senkouBLength): Default value is 52. This is the period used to calculate the Senkou Span B line (leading span B) of the Ichimoku Cloud.
RSI Period (rsiLength): Default value is 14. This period is used to calculate the Relative Strength Index (RSI).
RSI Long Entry Level (rsiLongLevel): Default value is 60. This level indicates the minimum RSI value for a long entry signal.
RSI Short Entry Level (rsiShortLevel): Default value is 40. This level indicates the maximum RSI value for a short entry signal.
2. Strategy Components
Ichimoku Cloud
Tenkan-sen: A short-term trend indicator calculated as the simple moving average (SMA) of the highest high and the lowest low over the Tenkan-sen period.
Kijun-sen: A medium-term trend indicator calculated as the SMA of the highest high and the lowest low over the Kijun-sen period.
Senkou Span A: Calculated as the average of the Tenkan-sen and Kijun-sen, plotted 26 periods ahead.
Senkou Span B: Calculated as the SMA of the highest high and lowest low over the Senkou Span B period, plotted 26 periods ahead.
Chikou Span: The closing price plotted 26 periods behind.
Relative Strength Index (RSI)
RSI: A momentum oscillator that measures the speed and change of price movements. It ranges from 0 to 100 and is used to identify overbought or oversold conditions.
3. Entry and Exit Conditions
Entry Conditions
Long Entry:
The Tenkan-sen crosses above the Kijun-sen (bullish crossover).
The RSI value is greater than or equal to the rsiLongLevel.
Short Entry:
The Tenkan-sen crosses below the Kijun-sen (bearish crossover).
The RSI value is less than or equal to the rsiShortLevel.
Exit Conditions
Exit Long Position: The Tenkan-sen crosses below the Kijun-sen.
Exit Short Position: The Tenkan-sen crosses above the Kijun-sen.
4. Visual Representation
Tenkan-sen Line: Plotted on the chart. The color changes based on its relation to the Kijun-sen (green if above, red if below) and is displayed with a line width of 2.
Kijun-sen Line: Plotted as a white line with a line width of 1.
Entry Arrows:
Long Entry: Displayed as a yellow triangle below the bar.
Short Entry: Displayed as a fuchsia triangle above the bar.
5. How to Use
Apply the Strategy: Apply the "Ichimoku Cloud Crosses_AIT" strategy to your chart in TradingView.
Configure Parameters: Adjust the strategy parameters (Tenkan-sen, Kijun-sen, Senkou Span B, and RSI settings) according to your trading preferences.
Interpret the Signals:
Long Entry: A yellow triangle appears below the bar when a long entry signal is generated.
Short Entry: A fuchsia triangle appears above the bar when a short entry signal is generated.
Monitor Open Positions: The strategy automatically exits positions based on the defined conditions.
Backtesting and Live Trading: Use the strategy for backtesting and live trading. Adjust risk management settings in the strategy properties as needed.
Conclusion
The "Ichimoku Cloud Crosses_AIT" strategy uses Ichimoku Cloud crossovers and RSI to generate trading signals. This strategy aims to capture market trends and potential reversals, providing a structured way to enter and exit trades. Make sure to backtest and optimize the strategy parameters to suit your trading style and market conditions before using it in a live trading environment.

CVD Ichimoku(s)ENGLISH
What is this indicator?
This is a combination of two indicators: the CVD - Cumulative Volume Delta Candles published by TradingView (version v3 2022.07.11) with two Ichimoku clouds: one for the current time frame and another for a bigger time frame.
The user of the indicator can define that bigger time frame with a multiplier. By default it multiplies x6 the current TF (for example, if you watch at the 1 hour time frame the second kumo belongs to 6 hour TF).
Additionaly, an orange line replicates the senko span A without displacement. It is extra layer of visual information that can be hidded from settings.
How it should be used?
Delta Volume indicators can be hard to read. This format gives the trader an overview of where the agressive buyers/sellers are in relation to past market orders. And relative to price if used in combination with the classic Ichimoku indicator on price. I recommend to use it as a support for your ideas applying Ichimoku's calculations deep knowledge.
CATALÀ*
Què és aquest indicador?
És una combinació de dos indicadors: el CVD - Cumulative Volume Delta Candles publicat per TradingView (versió v3 2022.07.11) amb dos Ichimoku clouds: on pel time frame actual i un altre per un time frame superior.
L'usuari de l'indicador pot definir aquest time frame superior mitjançant un multiplicador. Per defecte multiplica x6 el TF actual (per exemple, si uses l'indicador al time frame d'1 hora, el segon kumo correspondrà al TF de 6 hores).
Adicionalment hi ha una línia taronja que replica el senko span A sense desplaçament. És una capa extra d'informació visual que pot ser amagada des de la configuració.
Com s'ha de fer servir?
Els indicadors de Delta Volume poden ser difícils de llegir. Aquest format dona al tradejador una visió global d'on són els compradors/venedors agressius en relació al mercat d'ordres passat. I relatiu al preu en combinació amb el clàssic indicdor Ichimoku sobre preu. Recomano usar-lo com a suport per les teves idees aplicant un profund coneixement dels càlculs d'Ichimoku.
*Catalan is a language speaked since 8th century in most eastern territories of the current Spain (Catalunya, Illes Balears, País Valencià), south of France and some zones of Italy. Catalan is spoken by some 9,000,000 people in Spain and some 125,000 in France, as well as by some 30,000 in Andorra and some 40,000 in Alghero.

Ichimoku Slope Filtered Signals [UAlgo]
🔶Description:
The "Ichimoku Slope Filtered Signals" indicator is designed to provide trading signals based on the Ichimoku Cloud indicator while incorporating a slope filter. The Ichimoku Cloud is a comprehensive indicator that defines support and resistance, identifies trend direction, and provides trading signals. This script enhances the traditional Ichimoku Cloud signals by incorporating a slope filter, which helps to confirm the strength and direction of the trend.
🔶Key Features:
Ichimoku Cloud Parameters: Users can customize parameters such as Tenkan, Kijun, and Senkou Span lengths, along with multipliers, to adjust the sensitivity of the Ichimoku Cloud.
Slope Filter Settings: Users can specify the number of bars to measure the slope and the lookback period for trend measurement. Additionally, there are options to filter Ichimoku signals based on slope thresholds.
Normalized Slope: The indicator calculates the normalized slope of the selected data series (in this case, Tenkan-sen) and plots it alongside the Ichimoku Cloud.
Signal Generation: Trading signals are generated based on crossovers and crossunders of the Tenkan-sen and Kijun-sen lines of the Ichimoku Cloud. These signals can be further filtered based on the normalized slope of the selected data series.
🔶 Usage:
Customization: Traders can customize the parameters of the Ichimoku Cloud and slope filter according to their trading strategy and risk tolerance.
Interpretation of Signals:
Crossover: A buy signal is generated when the Tenkan-sen line crosses above the Kijun-sen line. This signal can be further filtered based on the normalized slope.
Crossunder: A sell signal is generated when the Tenkan-sen line crosses below the Kijun-sen line. Similar to the buy signal, this can also be filtered based on the normalized slope.
Trend Confirmation: The normalized slope provides additional confirmation of the strength and direction of the trend. A positive slope indicates an upward trend, while a negative slope indicates a downward trend.
Example:
Disclaimer:
Not Financial Advice: This script is provided for educational purposes only and should not be considered financial advice. Traders should conduct their own research and/or consult with a qualified financial advisor before making any investment decisions based on this script.
Risk of Loss: Trading in financial markets involves risk of loss, and past performance is not indicative of future results. Users of this script should be aware of the risks involved in trading and should only trade with capital they can afford to lose.
No Guarantees: There is no guarantee of success or profitability when using this script. Market conditions can change rapidly, and trading results may vary.
Use at Own Risk: The author of this script (UAlgo) does not assume any responsibility for losses incurred as a result of using this script. Traders use this script at their own risk and discretion.
Terms of Use: This script is subject to the terms of the Mozilla Public License 2.0. Users are encouraged to review the license terms before using or distributing the script.

DA Cloud - DynamicDA Cloud - Dynamic | Detailed Overview
🌟 What Makes This Indicator Special
The DA Cloud - Dynamic is an advanced technical analysis tool that creates adaptive support and resistance zones that expand and contract based on market volatility. Unlike traditional static indicators, this cloud system "breathes" with the market, providing dynamic levels that adjust to changing market conditions.
📊 Core Components
1. Multi-Layered Cloud Structure
Resistance Cloud (Red): Three dynamic resistance levels (RL1, RL2, RL3) with intermediate channels (RC1, RC2)
Support Cloud (Green): Three dynamic support levels (SL1, SL2, SL3) with intermediate channels (SC1, SC2)
Trend Cloud (Blue): Five trend lines (TU2, TU1, TM, TL1, TL2) that flow through the center
Confirmation Line (Purple): A fast-reacting line that confirms trend changes
2. Forward Displacement Technology
The entire cloud system is projected 21 bars into the future (Fibonacci number), allowing traders to see potential support and resistance levels before price reaches them. This predictive element is inspired by Ichimoku Cloud theory but enhanced with modern volatility dynamics.
🔬 How It Works (Without Revealing the Secret Sauce)
Volatility-Responsive Design
The indicator continuously measures market volatility across multiple timeframes
During high volatility periods (like major breakouts), clouds expand dramatically
During consolidation, clouds contract and tighten around price
This creates a "breathing" effect that adapts to market conditions
Multi-Timeframe Analysis
Incorporates Fibonacci sequence periods (3, 13, 21, 34, 55) for calculations
Blends short-term responsiveness with long-term stability
Creates smooth, flowing lines that filter out market noise
Dynamic Level Calculation
Levels are not fixed percentages or static bands
Each level adapts based on current market structure and volatility
Channel lines (RC1, RC2, SC1, SC2) provide intermediate support/resistance
🎯 Key Features
1. Touch Point Detection
Colored dots appear when price touches key levels
Red dots = resistance touch
Green dots = support touch
Blue dots = trend median touch
2. Entry/Exit Signals
"Cloud Entry" labels when confirmation line crosses above SL1
"Cloud Exit" labels when confirmation line crosses below RL1
Background color changes based on bullish/bearish bias
3. Information Table
Real-time display of key levels (RL1, TM, SL1)
Current bias indicator (BULLISH/BEARISH)
Updates dynamically as market moves
⚙️ Customization Options
Main Controls:
Sensitivity (5-50): How responsive clouds are to price movements
Smoothing (1-50): Controls the flow and smoothness of cloud lines
Forward Displacement (0-50): How many bars to project the cloud forward
Advanced Volatility Settings:
Volatility Lookback (50-1000): Period for establishing volatility baseline
Volatility Smoothing (1-50): Reduces spikes in volatility expansion
Expansion Power (0.1-2.0): Controls how dramatically clouds expand
Range Divisor (1.0-20.0): Master control for overall cloud width
Level Spacing:
Individual multipliers for each resistance and support level
Allows fine-tuning of cloud structure to match different markets
Trend Spacing:
Separate controls for inner and outer trend bands
Customize the trend cloud density
📈 Trading Applications
1. Trend Identification
Price above TM (Trend Median) = Bullish bias
Price below TM = Bearish bias
Cloud color and width indicate trend strength
2. Support/Resistance Trading
Use RL1/SL1 as primary targets and reversal zones
RC1/RC2 and SC1/SC2 provide intermediate levels
RL3/SL3 mark extreme levels often seen at major tops/bottoms
3. Volatility Analysis
Expanding clouds signal increasing volatility and potential big moves
Contracting clouds indicate consolidation and potential breakout setup
Cloud width helps with position sizing and risk management
4. Multi-Timeframe Confirmation
Works on all timeframes from 1-minute to monthly
Higher timeframes show major market structure
Lower timeframes provide precise entry/exit points
🎓 Best Practices
Combine with Volume: High volume at cloud levels increases reliability
Watch for Touch Clusters: Multiple touches at a level indicate strength
Monitor Cloud Expansion: Sudden expansion often precedes major moves
Use Multiple Timeframes: Confirm signals across different time periods
Respect the Trend Median: This is often the most important level
⚡ Performance Notes
Optimized for up to 2000 bars of historical data
Smooth performance with 500+ lines and labels
Works on all markets: Crypto, Forex, Stocks, Commodities
📝 Version Info
Current Version: 1.0
Dynamic volatility expansion system
Full customization suite
Touch point detection
Entry/exit signals
Forward displacement projection

Ichimoku Kinko Hyo [DM]Ichimoku Kinko Hyo PineV5
Definition
The Ichimoku Cloud is a package of multiple technical indicators that signal support, resistance, market trend, and market momentum. It is one of the few indicators out there that attempts to convey a number of meaningful insights into one. For that reason it can be hard to understand at first glance, but is commonly used among professional traders and market participants.
History
In the late 1960s, Goichi Hosada introduced the Ichimoku Cloud. It took several years for its adoption and understanding to take off, but today it is commonly known and used as an indicator in the field of technical analysis.
Calculations
The Ichimoku Cloud can be calculated in several different ways. It depends on your timeframe, needs, and expertise in technical analysis.
Takeaways
The Cloud is an integral part of the technical indicator as a whole and helps traders and investors identify the specific calculations made to the chart. Price below the cloud indicates a downward trend, whereas price above the cloud indicates an uptrend. These trend signals can strengthen if both the cloud and the price are moving in the same direction. Similarly, the signals can weaken if the cloud is moving in the opposite direction.
What to look for
By using various averages, the Ichimoku Cloud indicator gives traders and investors key and extensive data information. Trends are high when price is above the cloud, weak when price is below the cloud, or transitioning when price is seen inside the cloud.
As was mentioned in the Calculation section above, when Leading Span A falls below Leading Span B, we can confirm a downtrend. The cloud, in this case, displays a red hue. When Leading Span A is above Leading Span B, we can confirm an uptrend. The cloud, in this case, displays a green hue.
The Ichimoku cloud can be used with other technical indicators in order to better assess risk. By looking at larger trends, with the help of multiple indicators, traders are able to see how smaller trends can fit within the general market picture as a whole.
Limitations
With all of the lines and cloud shading and data points, the chart can look a little crowded and stuffy. In order to work through this, there’s software that can hide these lines so the chart looks cleaner for traders and all the information you’d like to see is at the forefront of the chart. At TradingView, we have special features available for all our users. Anyone using our platform can pick which lines and backgrounds they’d like shown and can also customize the color, line thickness, and opacity with a simple click.
more info: ichimoku.org
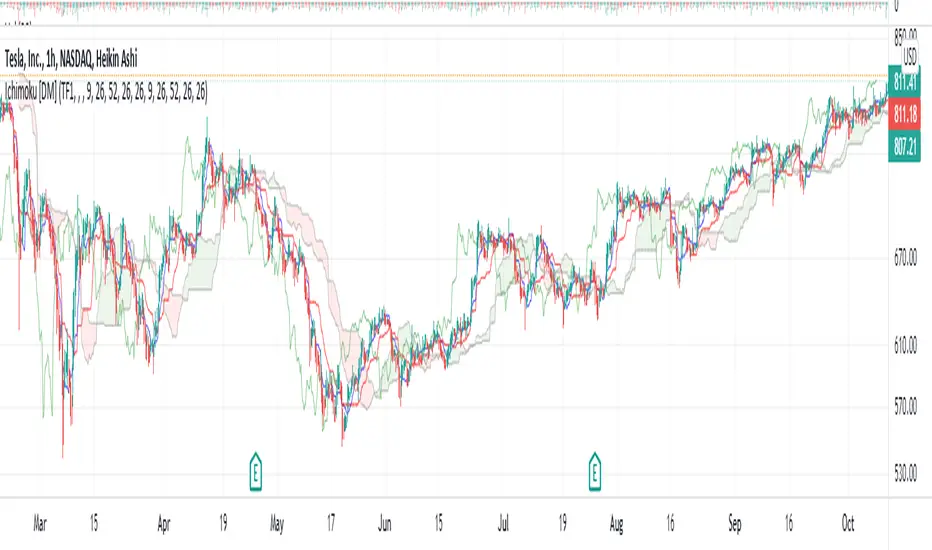
Ichimoku breakoutIf you use Ichimoku Cloud strategies, this indicator is very useful for you!
This code indicates the candles that break the ichimoku cloud in both directions!
conversion line, base line and lagging span are disable by default, you can enable it from settings window.
green triangles under the candles with green backgrounds show break out the red clouds.
red triangles at the top of the candles with red backgrounds show break out the red clouds.
you can set alerts to be notified when an Ichimoku Cloud is broken.

Ichimoku MTF (best MTF 4H - Entry 15M)The Ichimoku Cloud is a collection of technical indicators that show support and resistance levels, as well as momentum and trend direction. It does this by taking multiple averages and plotting them on a chart. It also uses these figures to compute a “cloud” that attempts to forecast where the price may find support or resistance in the future.
The technical indicator shows relevant information at a glance by using averages.
The overall trend is up when the price is above the cloud, down when the price is below the cloud, and trendless or transitioning when the price is in the cloud.
Charles G. Koonitz. “Ichimoku Analysis & Strategies: The Visual Guide to Spot the Trends in Stock Market, Cryptocurrency and Forex Using Technical Analysis and Cloud Charts," Tripod Solutions Inc., 2019.
When Leading Span A is rising and above Leading Span B, this helps to confirm the uptrend and the space between the lines is typically colored green. When Leading Span A is falling and below Leading Span B, this helps confirm the downtrend. The space between the lines is typically colored red in this case.1
Traders will often use the Ichimoku Cloud as an area of support and resistance depending on the relative location of the price. The cloud provides support/resistance levels that can be projected into the future. This sets the Ichimoku Cloud apart from many other technical indicators that only provide support and resistance levels for the current date and time.
Traders should use the Ichimoku Cloud in conjunction with other technical indicators to maximize their risk-adjusted returns. For example, the indicator is often paired with the relative strength index (RSI), which can be used to confirm momentum in a certain direction. It’s also important to look at the bigger trends to see how the smaller trends fit within them. For example, during a very strong downtrend, the price may push into the cloud or slightly above it, temporarily, before falling again. Only focusing on the indicator would mean missing the bigger picture that the price was under strong longer-term selling pressure.
Crossovers are another way that the indicator can be used. Watch for the conversion line to move above the base line, especially when the price is above the cloud. This can be a powerful buy signal. One option is to hold the trade until the conversion line drops back below the base line. Any of the other lines could be used as exit points as well.

Trend Fusion: ADX&EMA+Ichimoku (Custom)SAME AS THE ORIGINAL (WITHOUT BOTTOM PART)
Trend Fusion: ADX & EMA+Ichimoku is an innovative indicator designed to provide traders with comprehensive insights into market trends. Combining the power of the Average Directional Index (ADX) with Exponential Moving Averages (EMA) and the Ichimoku Cloud, this indicator offers a sophisticated approach to trend analysis.
This indicator stands out for its unique integration of multiple trend-following indicators, offering traders a holistic view of market dynamics. Unlike traditional trend indicators that focus solely on price movements, Trend Fusion incorporates the ADX, EMA, and Ichimoku Cloud to provide a more nuanced understanding of trend strength and direction. By combining these indicators, traders can make more informed decisions and enhance their trading strategies.
How it works:
Trend Fusion generates buy and sell signals based on the convergence of these indicators. A combination of strong ADX readings, EMA crossovers, and alignment with the Ichimoku Cloud confirms trend direction and provides entry and exit points for traders.
Average Directional Index (ADX): Measures the strength of the prevailing trend by analyzing price movements. A rising ADX indicates a strengthening trend, while a falling ADX suggests weakening momentum.
Exponential Moving Averages (EMA): Detects potential trend reversals through crossover signals. A bullish crossover (fast EMA crossing above slow EMA) suggests an uptrend, while a bearish crossover indicates a downtrend.
Ichimoku Cloud: Provides support and resistance levels along with trend direction. Price movements above the cloud indicate bullish sentiment, while movements below the cloud suggest bearish sentiment.
How to useColour codes:
Green Candles: Represent a strong uptrend, indicating robust buying momentum. The intensity of green color deepens with increasing trend strength.
Red Candles: Indicate a strong downtrend, signaling significant selling pressure in the market. The intensity of red color deepens with increasing trend strength.
Yellow Candles: Suggest a weak trend, characterized by indecision and lack of clear direction. The intensity of yellow color varies based on the strength of the trend, with lighter shades indicating weaker trends and darker shades suggesting slightly stronger trends.
Trend Strength: Monitor the ADX to gauge the strength of the prevailing trend. Higher ADX values indicate stronger trends, while lower values suggest weaker trends.
Trend Direction: Confirm trend direction using EMA crossovers and Ichimoku Cloud signals. Look for bullish crossovers and price movements above the cloud for uptrends, and bearish crossovers and movements below the cloud for downtrends.
Entry and Exit Signals: Enter trades when all components align, signaling a strong trend. Use EMA crossovers and cloud confirmations to identify potential entry points, and consider exiting trades when these signals reverse.
The ADX calculation and signal logic are based on the ADX script by PineCoders, with modifications to integrate it into this indicator.
The EMA crossover logic is adapted from the GDAX EMA Cross script by stefano98.
The Ichimoku Cloud calculation and plotting are adapted from the Ichimoku Cloud script by lonesometheblue.
Trading involves risk, and past performance is not indicative of future results. It is recommended to use this indicator alongside other technical analysis tools and risk management strategies.

Trend Fusion: ADX&EMA+IchimokuTrend Fusion: ADX & EMA+Ichimoku is an innovative indicator designed to provide traders with comprehensive insights into market trends. Combining the power of the Average Directional Index (ADX) with Exponential Moving Averages (EMA) and the Ichimoku Cloud, this indicator offers a sophisticated approach to trend analysis.
This indicator stands out for its unique integration of multiple trend-following indicators, offering traders a holistic view of market dynamics. Unlike traditional trend indicators that focus solely on price movements, Trend Fusion incorporates the ADX, EMA, and Ichimoku Cloud to provide a more nuanced understanding of trend strength and direction. By combining these indicators, traders can make more informed decisions and enhance their trading strategies.
How it works:
Trend Fusion generates buy and sell signals based on the convergence of these indicators. A combination of strong ADX readings, EMA crossovers, and alignment with the Ichimoku Cloud confirms trend direction and provides entry and exit points for traders.
Average Directional Index (ADX): Measures the strength of the prevailing trend by analyzing price movements. A rising ADX indicates a strengthening trend, while a falling ADX suggests weakening momentum.
Exponential Moving Averages (EMA): Detects potential trend reversals through crossover signals. A bullish crossover (fast EMA crossing above slow EMA) suggests an uptrend, while a bearish crossover indicates a downtrend.
Ichimoku Cloud: Provides support and resistance levels along with trend direction. Price movements above the cloud indicate bullish sentiment, while movements below the cloud suggest bearish sentiment.
How to use
Colour codes:
Green Candles: Represent a strong uptrend, indicating robust buying momentum. The intensity of green color deepens with increasing trend strength.
Red Candles: Indicate a strong downtrend, signaling significant selling pressure in the market. The intensity of red color deepens with increasing trend strength.
Yellow Candles: Suggest a weak trend, characterized by indecision and lack of clear direction. The intensity of yellow color varies based on the strength of the trend, with lighter shades indicating weaker trends and darker shades suggesting slightly stronger trends.
Trend Strength: Monitor the ADX to gauge the strength of the prevailing trend. Higher ADX values indicate stronger trends, while lower values suggest weaker trends.
Trend Direction: Confirm trend direction using EMA crossovers and Ichimoku Cloud signals. Look for bullish crossovers and price movements above the cloud for uptrends, and bearish crossovers and movements below the cloud for downtrends.
Entry and Exit Signals: Enter trades when all components align, signaling a strong trend. Use EMA crossovers and cloud confirmations to identify potential entry points, and consider exiting trades when these signals reverse.
The ADX calculation and signal logic are based on the ADX script by PineCoders, with modifications to integrate it into this indicator.
The EMA crossover logic is adapted from the GDAX EMA Cross script by stefano98.
The Ichimoku Cloud calculation and plotting are adapted from the Ichimoku Cloud script by lonesometheblue.
Trading involves risk, and past performance is not indicative of future results. It is recommended to use this indicator alongside other technical analysis tools and risk management strategies.
