3 Red Heikin Ashi with Higher Lows3 Red Heikin Ashi with Higher Lows. Will Give a Buy Signal when 3 Red Heikin Ashi with Higher Lows is formed
"Heikin Ashi" için komut dosyalarını ara

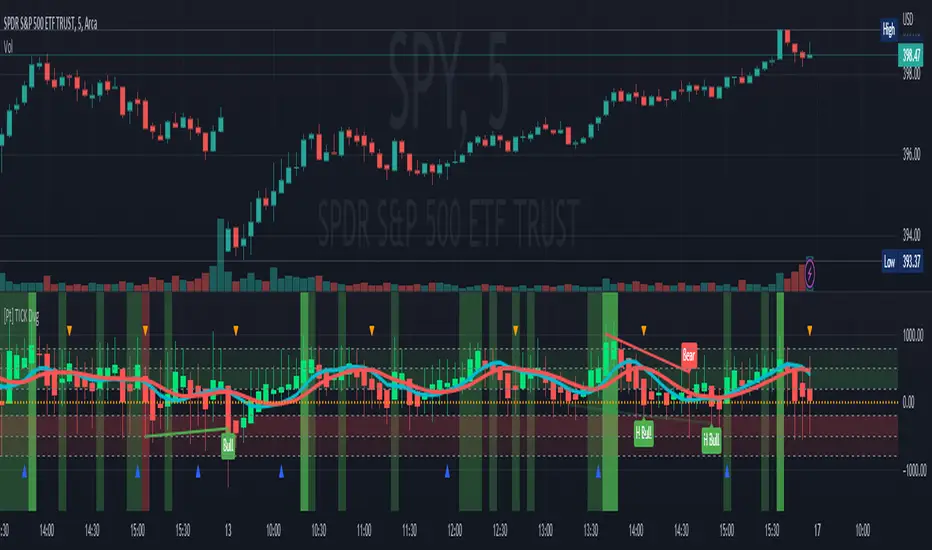
TICK Divergence + Heikin Ashi [Pt]This indicator identifies divergence between NYSE TICK and price, displays TICK in line, bar, or Heikin Ashi format, calculates various types of moving average lines and shows moving average crossovers.
What is TICK
NYSE TICK, also known as the TICK index, is a technical analysis indicator that shows the number of stocks on the New York Stock Exchange (NYSE) that are trading on an uptick or a downtick in a particular period of time. The TICK index is calculated by subtracting the number of stocks trading on a downtick from the number of stocks trading on an uptick. A reading of +1000 on the TICK index, for example, would indicate that there are 1000 more stocks trading on an uptick than on a downtick. The TICK index is often used as a measure of market sentiment, as it can provide insight into whether there is more buying or selling pressure in the market at a given time. A high TICK index reading may suggest that there is strong buying pressure, while a low TICK index reading may indicate that there is more selling pressure in the market.
The TICK index is usually very volatile, so this indicator is best suited for lower timeframes, such as 1 to 5 min charts.
Features
1) Shows bullish, bearish, hidden bullish and hidden bearish divergences
2) Three display modes for TICK data: Line, Bar, Heikin-Ashi
3) Plot various moving average lines and crossovers. Overall background
4) Configurable significant zones. Background colors will change based on closing TICK value.
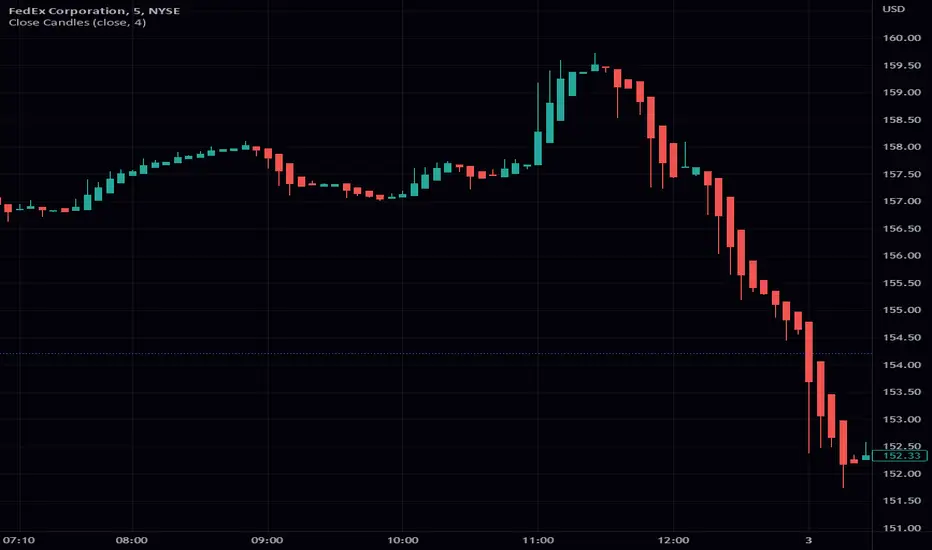
Close CandlesClosing candle takes any input and turs it into a candle stick chart. You can go from a regular candle chart by setting the length to 1, to heikin ashi by setting the length to 4. One of the features of this scripts is the ability to reuse the function. This function is a great addition to most scripts as it makes it really easy to give your script a candle view. As always I hope that you find this release useful. If you find any bugs please let me know. The same goes with any features you might want to request. This includes requesting custom indicators. Enjoy!
Balance of Power Heikin Ashi Investing Strategy Balance of Power Heikin Ashi Investing Strategy
This is a swing strategy designed for investment help.
Its made around the Balace of Power indicator, but has been adapted on using the Monthly Heikin Ashi candle from the SPY asset in order to be used with correlation for US Stock/ETF/Index Markets.
The BOP acts as an oscilallator showing the power of a bull trend when its positive and a bearish trend when its in negative. At the same time we can spot reversals, based on the percentiles ( 99/1)
The rules for entry :
For long : The 99 percentile is ascending, and we are either in a positive value (>0), or we crossed the bottom place ( -0.35)
For short : the 99 and 1 percentile are descending, and we are either in a negative value(<0), or we crossed down the top place ( 0.6)
If you have any questions please let me know !

Aarika Heikin AshiHello Traders,
This indicator is probably based for the people who use HA candlestick chart and frequently have to switch between Japanese candlestick and HA candles. The worry is over with this simple indicator.
Now you can enjoy both candlesticks at the same time.
AHA allows you to have 2 EMAs (mostly used for crossovers). Default values set at 8/21 EMA which we may indicate a trend reversal.
We strongly recommend you back-test everything that you need before you start using AHA.
Thank you.

Ichimoku + RSI Crypto trending strategyThis is a crypto trending strategy designed for big timeframes such as 3-4h+.
Its components are:
RSI
ICHIMOKU full pack
Heikin Ashi candles for logic calculation inside
Rules for entry.
For long : we have a long cross condition on ichimoku and price is above the ichimoku lines, and at the same time RSI value is > 50.
For long : we have a short cross condition on ichimoku and price is below the ichimoku lines, and at the same time RSI value is < 50.
Rules for exit
We exit whenever we receive an opposite signal of the initial entry.
SInce this strategy is using no risk management inside, I recommend to be careful with it .
If you have any questions, let me know !

SBER HA Smooth ContainerSBER's modified Heikin Ashi Smoothed Container
Uses EMA 16 and Heikin Ashi Candles.. For NIFTY and its stocks only.

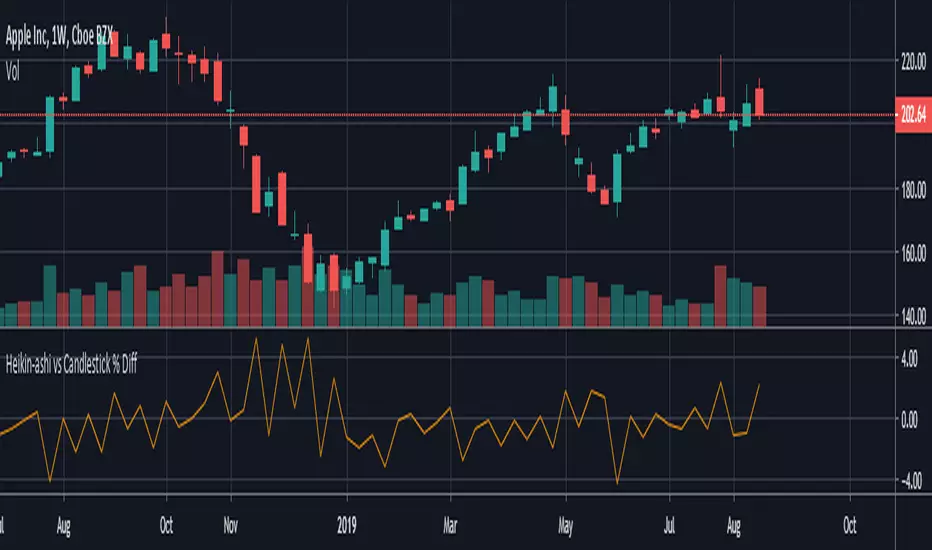
HeikinAshi - Candlestick % Difference This script shows the price difference ( %) between heikin ashi and candlestick for all investment instruments as Close, Open, High and Low. (Switchable )
In this way, you can see which instruments can easily use heikin ashi .
And by taking averages you can find the opportunity to compare which investment tools are more risk-free.
HTF Candle [Custom Time Period] by JustUncleL [SOMMI 1.0 edit]This is a custom High Time Frame indicator, originally created by JustUncleL. 💚
I have edited the Pine Script to allow a custom Time Period input. 💛
In the original version, you could only select from a few time periods as your High Time Frame. 💙
In this version you can put any time frame as your reference. 🧡
Example: 6-hour HTF or 2-Day HTF
SOMMI'S SPECIAL NOTES:
-This indicator works with Heikin-Ashi candles.
-Please change your candles to Heikin-Ashi and apply the indicator.
-Advised to disable "Body Wicks"
-Advised to also refresh your page a few times a day as it doesn't update properly due to limitations of TradingView / Pinescript currently.
💙💛💚🧡

Bitcoin as Heikin Ashi Candles with Pivot PointsI use this Indicator to show me where Bitcoin is heading.
Most pine programmers are not aware of the possibility to combine Heikin Ashi Candles with Pivot Points that easy.
You can switch between Traditional, Fibonacci, Woodie, Classic, DM, and Camarilla as usual.
When on a Intraday Chart it will automaticly calculate daily Pivots for Haikin Ashi candles.
On the daily Chart it will calculate weekly Pivots, and when switching to monthly candles it will calculate Pivots for one year.
There is also an option where you can deactivate all support and resistance lines, except for today. Meaning you will see the Central Pivot Point on all previous days only.
This is a lagging indicator!
When you can see Altcoin correlation with BTC then both might get pretty strong leading indicators.
I am pleased to hear some advice/wishes to improve this script.
It is still in the beginning and some updates will follow, I promise.
Happy Trading!

SumIndTarget:
The SumInd indicator combines Heiking Ashi, Sar Parabolic, Koncord, RSI, DMI, MACD and Bollinger Bands to give buy or sell signals or trends. This are called base indicators.
The goal is to have a clear and quick buy or sell suggestion and to avoid evaluating all or some of the named indicators, especially if they give contradictory signals among them. This speed and simplicity helps the trader to see several tickers in less time. It is intended for all markets and time periods where the above-mentioned indicators can be used.
How it works:
SumInd already has the importance or "weight" of each indicator named above configured, but they can be modified. You can set 0% for no use, or any other value based on the weight you want to give it, between 1% and 200% where 100% is the normal use, and increases or decreases based on importance.
Each base indicator can give signals to buy, sell or just "wait and see".
Each base indicator is checked for a buy signal, in which case its weight is added to the positive or green line, and if there is a sell signal, its weight is subtracted from the sell or red line. in case of indeterminacy or 'wait and see', nothing is added to any signal.
The yellow or total line is the sum of the buy or green signal plus the sell or red signal.
If the yellow or total line rises above the buy level, the background changes to green and an up arrow appears at the bottom of the chart indicating the buy suggestion, because most of the indicators you are interested in gave a buy signal.
If the yellow line or total falls below the sell level, the background changes to red and a downward arrow appears in the upper area of the chart indicating the sell suggestion, because most of the indicators you are interested in gave a sell signal.
The Buy and Sell level can be changed according to the security of the suggestion you need.
Areas without arrows or marks are considered "wait and see" areas, the previous trend in principle continues. They can be marked with the default background if desired from the SumInd settings.
Details and criterials:
Each of the following indicators can be turned on or off and assigned different weights of importances, by whether or not it shares the following criteria:
Heikin Ashi candles: add or subtract half an assigned weight if there is a buy or sell candle and the other half weight if there are two consecutive candles with the same signal.
RSI: Adds or subtracts the assigned weight if the ema is below or above the signal.
Parabolic Sar: Adds half a weight in transition to buy or sell and another half weight if there are two consecutive signals of the same trend.
Koncord: Add or subtract the weight if the current trend (mountain) grows or decreases respectively from the 4th previous time signal, and also the value (red line) is less than 35 or exceeds 65 respectively.
DMI: Adds or subtracts a quarter of the weight assigned by the DMI signal multiplied by the value of DMI, if the positive or negative signal exceeds the other negative or positive signal by 15% respectively.
Bollinger Bands: Add or subtract the weight if the previous third signal touches or falls out of the zone and keeps growing or decreasing respectively.
MACd: Add or subtract one third of the weight if the last 3 time signals are rising or falling, Add or subtract another third if the fast signal is above or below the slow signal, and Add or subtract the last third of the weight if it is rising with the negative fast signal, or falling with the positive fast signal.

[HA] Heikin-Ashi Shadow Candles// For overlaying Heikin Ashi candles over basic charts, or for use in it's own panel as an oscillator.
// Enjoy the visual cues of HA candles, without giving up price action awareness.
// Good for learning and comparison.
// Aug 11 2022
Release Notes: * Bugfix: Candle color was based on classic direction not HA direction (did not update cover photo).
// Aug 12 2022
Release Notes: * Implemented true oscillator mode.
Provided as separate plot (styles tab) or mode switch option (Inputs tab). TV gets spazzy with "styles tab" "default hidden" plots, and will reset them if any variables are modified that affect them (i.e. wick color override). Mode switch should be sufficient for both users.
// Aug 21 2022
Republished because of typo in indicator name prevented search.

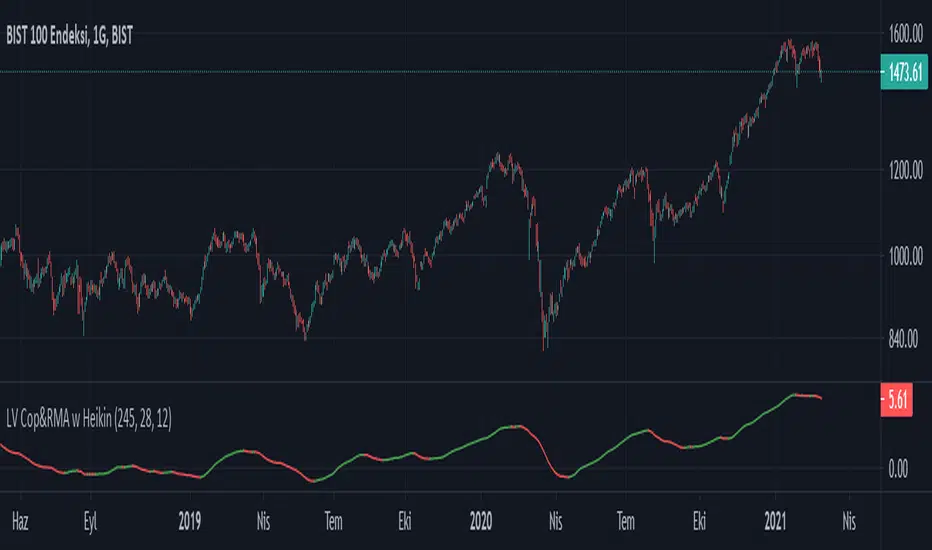
LV Cop&RMA w HeikinA buy signal is generated when the indicator turns upwards from previous indicator level.
A sell signal is generated when the indicator turns downwards from previous indicator level.
The indicator is trend-following, and based on averages, so by its nature it doesn't pick a bottom, but rather shows when a rally has started.
It is designed for daily period use.
Frequent buy/sell signals can occur on low and high levels.
It is designed with the mentality of Coppock curve. Rma is used instead of Wma and Heikin-Ashi closing price is used instead of standard closing price.
Heiken Ashi MTF Strategy- IndicatorHello, this is both a strategy and indicator that revolves around Heikin Ashi candles.
In this case we take 3 different time frames, in this example we use daily , weekly and monthly.
The conditions for entry are :
For long : we check that we have a green daily candle, at the same time we check that the weekly and monthly candles are also green.
For short : We check that all candles, daily, weekly and monthly and red.
For exit of long : as soon as 1 of the 3 candles, daily or weekly or monthly converts to red, we exit.
For exit of short : as soon as 1 of the 3 candles converts to green, we exit.
This strategy- indicator can be adapted to any type of market.

QuantNomad - Heikin-Ashi PSAR StrategyContinue experimenting with different combinations of strategies.
Here is the PSAR Strategy calculated based on HA candles. HA is already calculated inside the script, do not apply it to HA candles.
Strategy is calculated based on 25% equity invested with 0.1% commission.
####################
Disclaimer
Please remember that past performance may not be indicative of future results.
Due to various factors, including changing market conditions, the strategy may no longer perform as good as in historical backtesting.
This post and the script don’t provide any financial advice.

KD-NewAutoTrade for Future Trading - Heikin Ashi candles The KD-NewAutoTrade strategy is a dynamic trend-following indicator designed for scalping and swing trading across crypto, forex, and index futures. It combines the precision of EMA crossovers, RSI momentum, and ADX trend strength to deliver clear Buy/Sell signals with high reliability.
🔹 Core Logic
EMA Fast & Slow Crossover – Identifies short-term and long-term trend shifts.
RSI Confirmation – Filters out false signals by requiring RSI to cross custom Buy/Sell thresholds.
ADX Filter – Ensures trades only trigger when market trend strength exceeds your chosen ADX minimum.
🔹 Key Features
Visual Buy/Sell triangles directly on the chart.
Customizable inputs for EMA, RSI, and ADX lengths.
Works efficiently on all timeframes and all markets (Crypto, Indices, Stocks, Commodities).
Optional background highlights for active trade zones.
Alert conditions for both BUY and SELL setups – ready to use in automated strategies or alert bots.
🔹 Recommended Usage
Use Heikin Ashi candles
Works best on 1M - 5M timeframes.
Combine with volume or higher-timeframe trend confirmation for stronger signals.

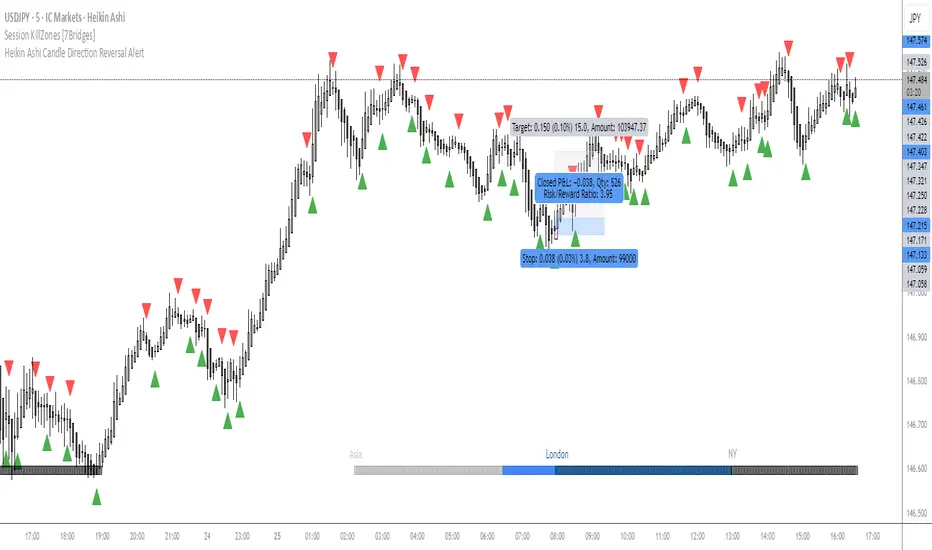
OMN Heikin Ashi Candle Direction Reversal AlertThis is a indicator to let you know once Heikin Ashi candle has changed direction compared to the candle before it. Set an alert on the indicator to get an audible alert.
Eliora Gold 1min (Heikin Ashi)Eliora -focused trading strategy designed for anything on the 1-minute timeframe using Heikin Ashi candles. This mode combines advanced market logic with structured risk management to deliver smooth, disciplined trade execution.
Key Features:
✅ Trend Confirmation – Aligns with dominant market direction for higher accuracy.
✅ ATR-Based Volatility Filter – Avoids high-risk conditions and chaotic price action.
✅ Candle Strength Logic – Filters weak setups, focusing on strong momentum.
✅ Balanced Risk/Reward – Calculates stop-loss and take-profit dynamically for consistent results.
✅ Cooldown & Overtrade Protection – Limits frequency to maintain trade quality.
This version of Eliora is built for scalpers and intraday traders seeking high-probability entries with graceful exits.

Doji Candle _ ThaerAbusalahIdentify doji candles in heikin ashi .
the indicator will search for a doji candles that are same in upper and lower wick by 50% and more .

Camarilla Pivots using Heikin Ashi by SeloriaPlots Heikin-Ashi Camarilla levels and alerts you when the market gets close to any of these levels.

Parabolic SAR Heikin Ashi MTF Candle ScalperThis is scalper strategy designed around parabolic sar indicator, where as an input candle value it uses the heikinashi from a higher timeframe.
This example has been adapted to SPY/SPX chart
In this case ,we are using a 5 min chart, but the calculations are made on a 15 min heikin ashi chart for the PSAR and then on 5 min chart we plot the results.
At the same time we are conditioning the entry to be base on a time/session for daytrading/scalper mentality
In this case we only enter within the first 30 min of SPY opening session , and then we exit after 3-4 hours of staying in the position ( unless we hit a reverse condition).
For long condition we enter when the mtf ha candle close is above the mtf psar and for short condition we enter when the mtf ha candle close is below the mtf psar
This script is made with an educational purpose to show the power of multiple time frame approach compared to a single chart.
If you have any questions, let me know !

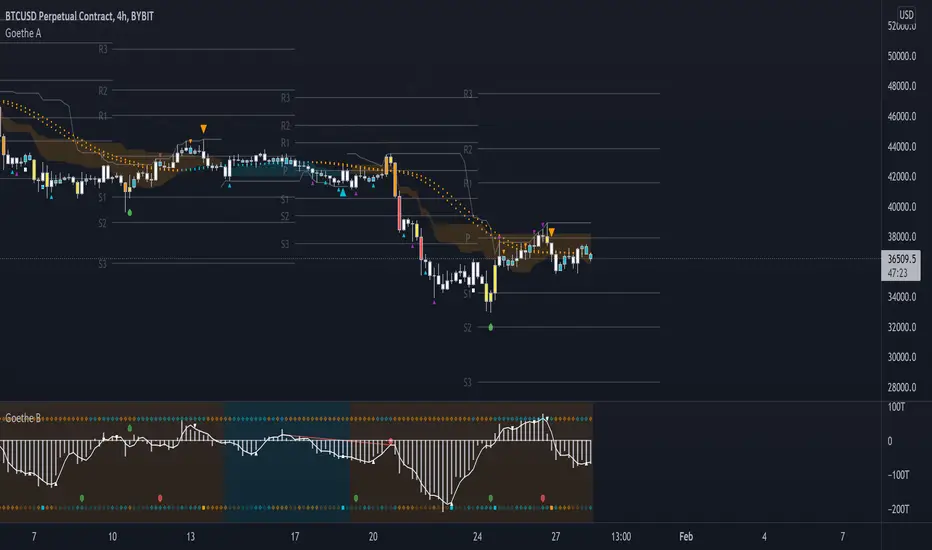
Goethe A - Multiple Leading Indicator PackageGoethe A is an Indicator Package that contains multiple leading and lagging indicators.
The background is that shows the local trend is calculated by either two Moving Averages or by a Kumo Cloud. By default the Kumo Cloud calculation is used.
What are those circles?
-These are OBV (or VPT, can be set in the options) Divergences. Red for Regular-Bearish. Orange for Hidden-Bearish. Green for Regular-Bullish. Aqua for Hidden-Bullish.
What this middle line?
-The middle line is calculated by a smoothed Heikin-Ashi indicator. I can be used as a dynamic zone of support and resistance. Many times this indicator is used as entry signal giver in trend following strategies.
What are those background lines?
-The background contains a simple Daily Pivots indicator. This indicator can be read as zones of Support and Resistance that updated based on the used timeframe.
What is this smaller thin grey line?
-This is a very simple Stoploss indicator based on Donchian Channels. The trade direction is based and calculated by the local trend (background color)
What are those small orange or aqua triangles?
- These are Pivots . They show when the OBV or wolfpack oscillators (or a double confirmation of both) might reverse, this is important to know because many times the price action follows this move.
What are those purple triangles?
- These are Pivots . They show when the PVT oscillator might reverse, this is important to know because many times the price action follows this move.
What are those big orange or aqua triangles?
- These are TSI (true strength indicator) entry signals . They are calculated by the TSI entry signal, the TSI oscillator treshold and in conjunction with the overall local trend (background color).
What are those white squares?
- These are Overbought or Oversold regions of the build-in RSI bands indicator. Every time the price crosses one of the RSI bands those squares are printed. Most of the time this happens after a move and indicates that this strong move has come to an end.
Most settings of the indicator package can be modified to your liking and based on your chosen strategy might have to be modified. Please keep in mind that this indicator is a tool and not a strategy, do not blindly trade signals, do your own research first! Use this indicator in conjunction with other indicators to get multiple confirmations.
All for One Moving AverageThis is a collection of all the moving averages available. Some are built-in, a couple were tricky to source out.
Higher timeframes can be specified so you aren't limited to your chart setting.
Repainting has been disabled by default.
There is also an option to use Heikin Ashi candles as the input source rather than standard bars.
Hope that someone finds this useful.
If you'd like anything added please DM me and I'll include it!
Feel free to copy this into your own strategies/indicators.
~Dark
