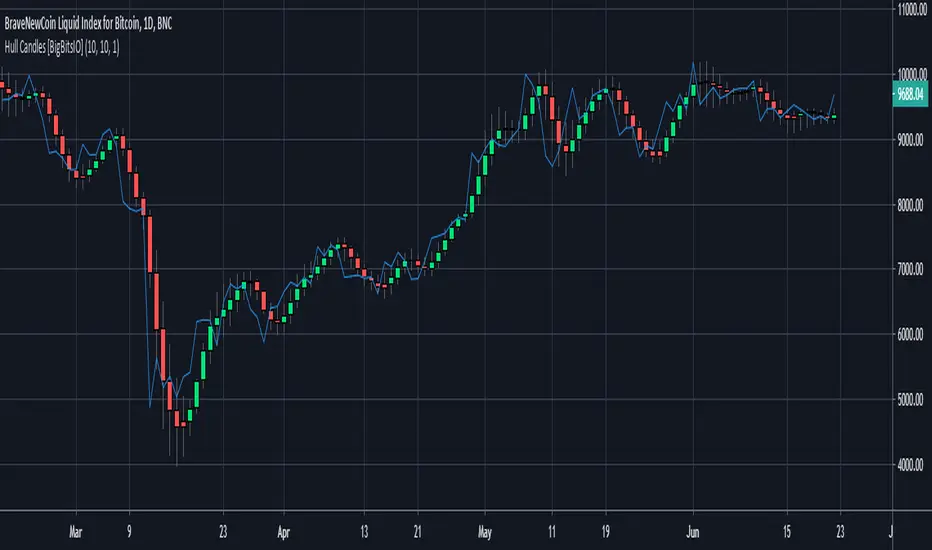
Hull Candles [BigBitsIO]This script is for custom candles based on an HMA calculation with a default period of 10 as well as an SMA of the close price, defaulted to 1 period to only show the current price. The purpose of the custom candles is to try and reduce noise from candles and help identify trends. These custom candles somewhat resemble Heikin-Ashi candles in their appearance.
Explained:
- Open, High, Low and Close (o, h, l, and c) are all calculated using an HMA calculation based on a user input length/period, defaulted at 10.
- Candle colors are determined by using the same HMA calculation on the ohcl4 and comparing it to the previous candle. Green candles have an ohlc4 greater than the previous candle, all other candles are red.
- The current price is plotted with the default blue line with an SMA calculation with 1 period to allow customization of smoothing if necessary to identify trends.
DISCLAIMER: For educational and entertainment purposes only. Nothing in this content should be interpreted as financial advice or a recommendation to buy or sell any sort of security or investment including all types of crypto. DYOR, TYOB.
"Heikin Ashi" için komut dosyalarını ara
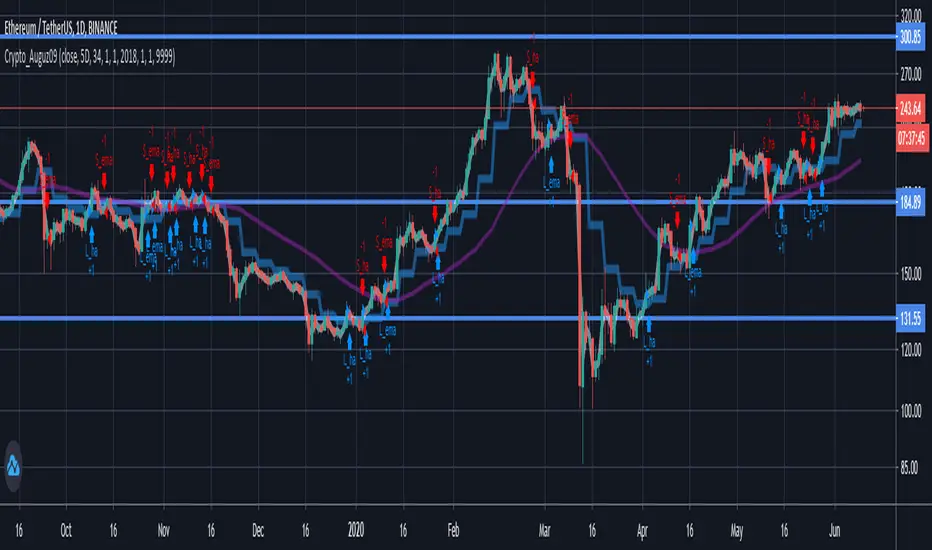
Tan_Aug09Crypto pairs: ETH/USDT
Time-frame: D1
Based on Heikin Ashi Candle and Exponential Moving Average Indicators
Crypto pick: 5D
Stock pick: 8D
Best work in strong trend.
Recommend using with trend line .
Big Picture 50/200Crazy as this may sound, it took 126 iterations to get something so simple sone right.
Big Picture helps offload some longer-term SMA lines off your chart so you can clutter it up again with some other stuff. It works by comparing SMAs 50 and 200 in histogram form. If the histogram is over the zero-line, 50 is over 200, and vice versa.
The histogram is green when the slope rises, suggesting that 50 is rising relative to 200. When the histogram turns red, 50 is falling.
Some Heikin-Ashi inspired averaging helps smooth the line just a little to help give a better idea as to overall trend.

Separated ATR - evoThis script plots two ATR (Average True Range) values, one based on only bullish and the other based on only bearish bars. If the current bar is positive, the negative ATR will use its last known negative bar for the calculation. You can smooth bar directions by using the Heikin Ashi setting.
Use this the same way how you would use the regular ATR indicator, but with the added value of knowing which side of the market has more volatility.

RSI CANDLESTICKSThis indicator display open, high, low, and close data in the form of a candlestick.
Credits to @allanster for the idea from

Ranged Volume - evoA simple script that shows mirrored regular volume bars with the purpose to show break-outs and low volume ranges, using highest and lowest of a few bars back.
Use Heikin Ashi function to smooth the colors with the trend.

Volume Moving Average - evoThis script shows regular volume bars with two separate moving averages using only bullish and only bearish candles. The moving average uses the last known value of its calculation.
Using the Heikin Ashi function will smooth the colors and moving averages (good for trends):
The crossovers are a good way to see what the dominant direction of a trend is, if you test them on your time frame and instrument they might be good to trade on their own, I have not tested this and the default settings are not tuned for that.
As always, let me know if you like it or found a good way to use it :)


3-way Trend DeterminationTrend determination in 3 different ways
Pivot lows and highs
Moving Average Crosses
Heikin Ashi

Hakimi - Ichi Based Pivot Time Prediction - V.2This indicator is based on multitime ichimoku and can be used to predict some of pivots .
How to use:
1- Select the arbitrary chart (Candles, Heikin Ashi, Line and Renko) and time frame.
2. Set the “Offset” value. Default value is -1.
3. Set the “Time Coefficient 1” to “Time Coefficient 4”. Default values are 2, 3, 4 and 5.

[RESEARCH] Point-and-Figure (P&F) Chart Identifier(Republishing of the hidden script)
A heuristic approach to identify P&F chart type. Catches all variations.
Works correctly with other chart types:
Classic Candles
Heikin-Ashi
Line Break
Kagi
ATR Renko
Traditional Renko
Range Bars

OBV Traffic LightsThe idea with On-balance volume (OBV) is to see price movement based on volume instead of the distance between the open and close of a candle. This can be used to find the relationship between volume and price action much easier than normal volume bars.
This version spices the OBV up a bit by basing it off of the current and previous close of the Heikin Ashi of the current bar, as well as adding "traffic light"
moving averages to the mix to get a better grasp of trends and when volume has shifted direction as well as by how much.
Thanks to Peter Whipp for the original idea of using the OBV with traffic light moving averages, as well as the default settings for them.

Scalping with Bill Williams AlligatorScalping strategy based on Bill Williams Alligator technique but calculated with heikin ashi candles.
This strategy has to be applied to standard candles and low time frames (1min to 5min)
Thanks to all pinescripters mentined in the code for their snippets.
It could be improved with stop loss based on ATR etc.
I have also a study with alerts.
Please use comment section for any feedback or contact me if you need support.

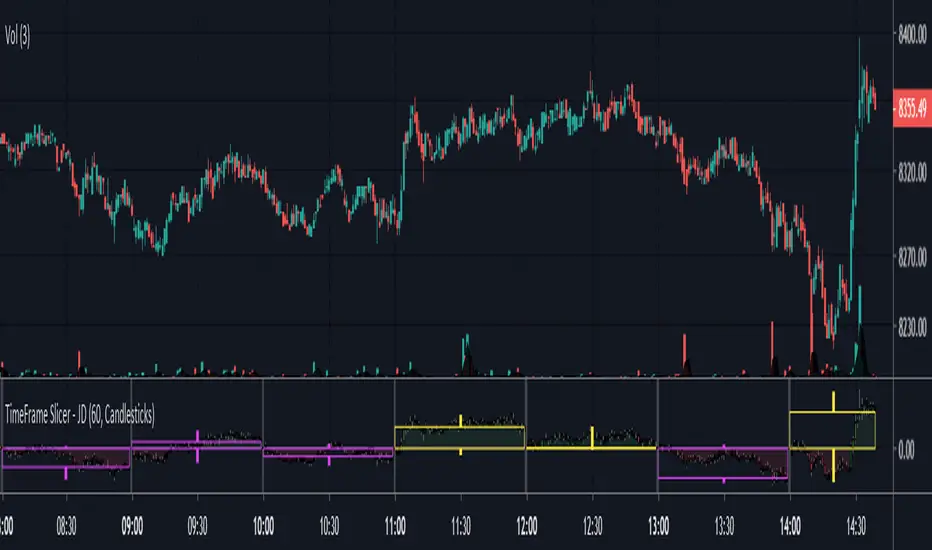
TimeFrame Slicer - JDThis script "slices up' the price action in hourly, daily, weekly,... slices
to give a view of the sentiment and price action or volume during the selected period.
Different time periods can be selected.
There is a choice to display the information in:
- normal candlesticks
- heikin ashi candles
- volume candles
JD.
#NotTradingAdvice #DYOR
Disclaimer.
I AM NOT A FINANCIAL ADVISOR.
THESE IDEAS ARE NOT ADVICE AND ARE FOR EDUCATION PURPOSES ONLY.
ALWAYS DO YOUR OWN RESEARCH!
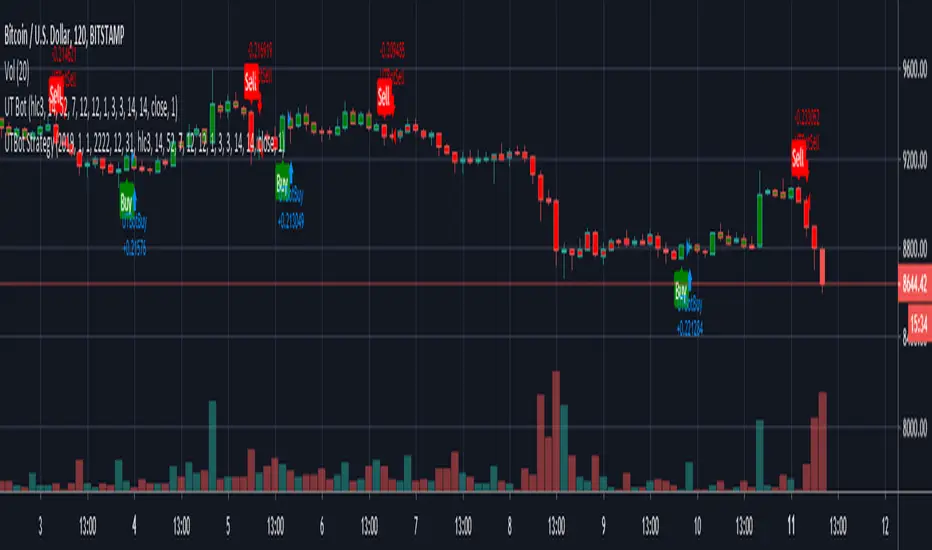
Kirk65 UTBot Strategy FixedCredits to @HPotter for the orginal code.
Credits to @Yo_adriiiiaan for recently publishing the UT Bot study based on the original code.
Credits to @TradersAITradingPlans for making UT Bot strategy.
Strategy fixed with time period by Kirk65.
UT Bot works great with 2 hour time frame with Heikin Ashi, but riskier. Use "Once per bar" In alerts with 1.5% stoploss. If the price goes against Alerts, stoploss will save your assets. Wait until next Alert.
4 hour time frame is less risky and less profitable.
Happy trading..
Kirk65
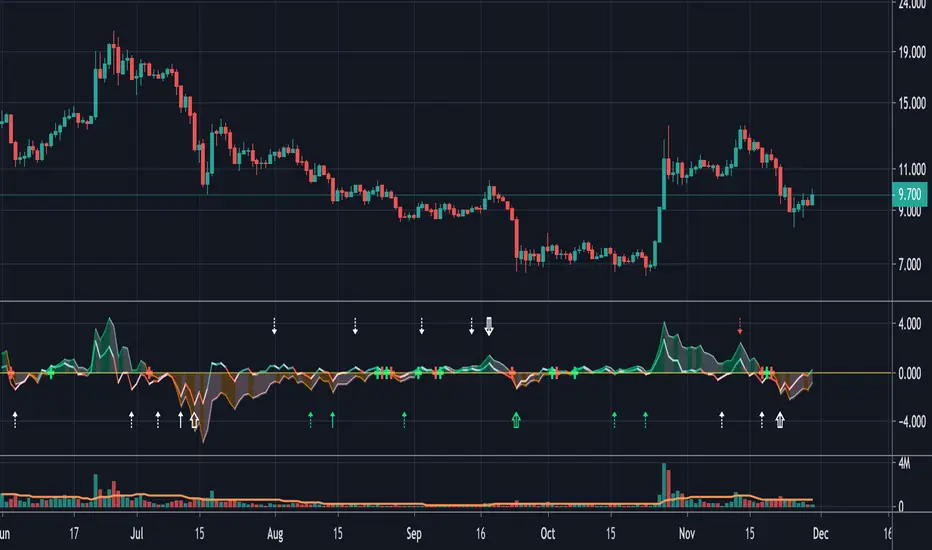
Histogram (MACD) with DivergencesThe focus with this MACD plot is solely towards the Histogram .
MACD & Signal can be made visible, but is made invisible by default.
The brighter line (green-red) is derived from the 'usual' MACD, the initial settings are completely different though:
- Fast Length 1
- 'Slow' Length 7
This is Histogram (1)
When this line crosses the 0 - line, this can give a nice early BUY - SELL sign,
especially combined with the 2nd Histogram, which uses a Slow Length of 49.
This latter Histogram (2) is filled ("Area") with a green/orange colour.
When Histogram (2) cross the 0 - line, this is visible as a green/red 'Cross'
These "Crosses", compared with the candles, gives possible/probable Support/Resistance lines.
Example,
if you bought on 5 March (Green Cross), and sold on 14 July, you'd have a nice profit!
A nice green area filled Histogram (2) (above 0 - line) can be considered as very Bullish,
an orange area filled Histogram (2) (below 0 - line) can be considered as Bearish.
Histogram (1) line can be used for shorter term Buy - Sell trades, the larger Bullish/Bearish Trend (of Histogram (2)) taking into account!
(see yellow dotted lines on the image).
All this is combined with a "Divergence" plot (with thanks to "Coingrats" (and "BabyWhale83") for the hard work!)
The small, more bright Triangles are triggered by Histogram (1)
The larger Triangles are triggered by Histogram (2)
- Green Triangles are Bullish Divergences
- Red Triangles are Bearish Divergences
- White Triangles (pointing upwards/downwards) are Bullish/Bearish Hidden Divergences
Very importantly, always combine the Divergence Triangles with another tool for confirmation, for example a MACD or RSI which produced an extra confirmation.
The movement of Histogram (2) above or below the 0 - line can be a confirmation as well.
As default these 3 options are enabled (for me this gives better results):
Simple MA (Oscillator)
Simple MA (Signal Line)
Simple MA (Signal Line 2)
This indicator can be used with normal "Candles", "Line", or "Heikin Ashi" (gives some differences)
Hope this is original and helpful!
EMA20 MA50 MA200 + T3-CCIEMA20 MA50 MA200 + T3-CCI
This combination of triple Moving Average and CCI is a strategy to be used in conjunction with Harmonical Patterns and Fibonacci Rations .
Heikin Ashi price can be used as the price source for the Moving Averages and the T3-CCI, instead of the real price.
Two instances of the indicator can be spawned to have both the triple MAs and the T3-CCI on the chart (L-Click on the Indicator > Move To > New Pane Below).
Alerts are available to warn of possible opportunities in the markets .
A single alert that can fire on both conditions can be set. It can also be used by other indicators, such as the Risk Management Wrapper .
Additional Technical Analysis is required to confirm the signals before opening a position.
This indicator is an update to MA50 EMA20 MA200 .

My Recursive Bands [ChuckBanger]This is a different type of bands. I modified Alex Pierrefeu Recursive Bands algo. It is a smoothed version of Alex's algo and imo it suites better for heikin ashi candles but it works well with regular candles.
How to use it:
When price hugs the upper band. It is a potential long and when price hugs the lower band it is a potential short.
Credits to Alex Pierrefeu: figshare.com

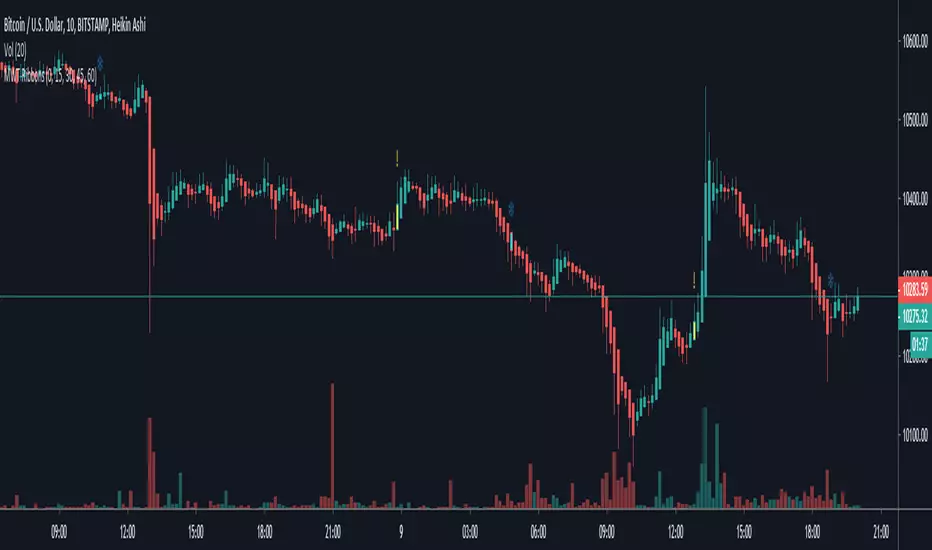
Smooth HA Candles MTF v1So this is last version of HA
this one has all MA type to choose from and MTF

HA Candles MTFJust try to make non repainting MTF candles
cross over of open and close , seen by small triangles

Multiple WaveTrend with Ribbons [CryptoFarian]This is based on LazyBear's WaveTrend Oscillator . I get the idea from klov's Kite Crossing Oscillator which adds support for multiple time frames and what I have done here is to add support for Heikin Ashi candles, ribbons and mark bars for long/short opportunities.
[RESEARCH] Chart Type IdentifierA viable and workable concept of chart type identification using Pine Script.
Was wollen wir trinken , sieben Tage lang
Was wollen wir trinken, so ein Durst!
Was wollen wir trinken, sieben Tage lang
Was wollen wir trinken, so ein Durst!

[RESEARCH] Kagi Chart IdentifierA heuristic approach to identify Kagi chart type.
This tool allows to identify:
ATR Kagi charts (see ^)
Traditional Kagi charts
Works correctly with other chart types:
Classic Candles
Heikin-Ashi
Line Break
PnF
ATR Renko
Traditional Renko
Range Bars
Do not forget @everget
