Super Guppy R1.0 by JustUncleLThis indicator is a Super Guppy version of standard Guppy GMMA as used in "CM_GUPPY_EMA Revised R2 by JustUncleL". Guppy MAs are designed to capture the inferred behaviour of traders and investors by using two groups of averages.
In this version of Super Guppy Traders Group of EMAs are:
EMA3 to EMA23 step 2 (Aqua=Uptrend, Blue=downtrend)
and Investors Group EMAs are:
EMA25 to EMA70 step 3 (Lime=Uptrend, Red=downtrend)
(Gray=Trend not established or in a Pull Back).
The idea of Guppy EMAs is to use fractal repetitions to identify points of agreement and disagreement which precede significant trend changes. For further info on how Guppy/Super Guppy can be used in trading please refer to
www.guppytraders.com
and many other articles available on the subject.
This indicator provides the following :
Swing Arrow Alerts (Red for Sell and Green for Buy) to indicate PullBack entries after new trend has been established. Also have option to wait for both fast and slow to completely separate (Confluence). Another option is to show alerts when show arrows when Candle colour changes, this is handy when using Heikin Ashi or Renko Charts.
Trend Break Arrow Alerts (Blue for Sell and Aqua for Buy) to indicate entries for aggressive trend swing point and is calculated by cross over of the average Traders EMA with the average Investors EMA. This was suggested option by Guppy.
Anchor Time frame (0=current), is the time frame that the Guppy EMAs are calculated for. In this way the 60min Guppy can be viewed on say 15min chart and help with setting up tighter Stop Loss conditions.
Alert conditions are also created for the TradingView Alarm subsystem. Only alerts for the selected alert options are generated.
"Fractal" için komut dosyalarını ara

Fibonacci Time Moving Average Ribbons [DW]This is an experimental study that takes a moving average of price, then offsets the average by up to 11 consecutive Fibonacci numbers from 1 to 144.
Choose between Kaufman's Adaptive Moving Average, Hull Moving Average, Fractal Adaptive Moving Average, Geometric Moving Average, or Exponential Moving Average.

Linear Regression TrendChannel Lines based on linear regression combined with fractal divergence indicator bands.
Taylor

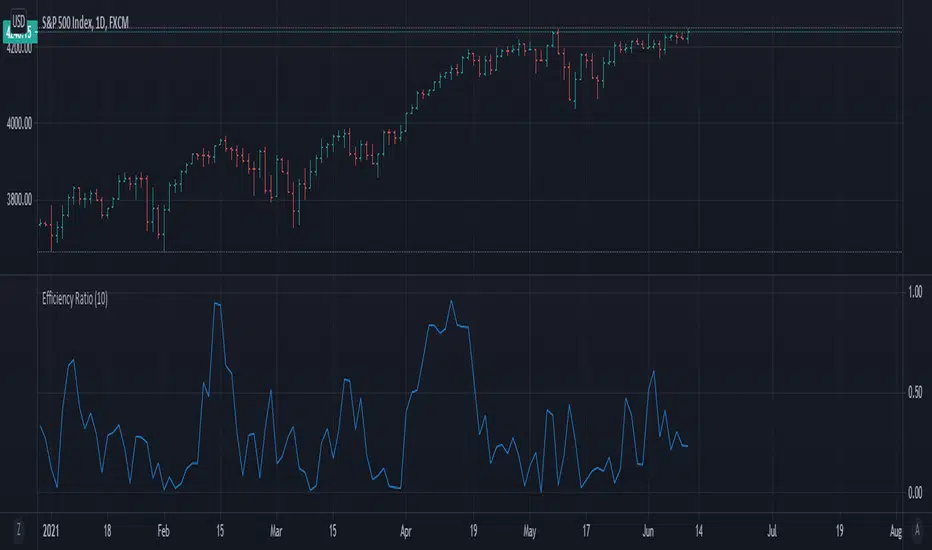
Efficiency Ratio (Kaufman)or "Generalized fractal efficiency"
Measures price trend effectiveness. Where 1.00 is trending and 0.00 not.
Calculation:
ER = Change / Sum of absolute changes
where "Change" is a price change over specified period and "Sum of Changes" sum of absolute price movements within that period
As an example, to calculate 5-day ER you have to calculate 5-day change and then calculate absolute sum of each day movements:
5-day ER = 5-day change / (|day 1 change| + |day 2 change| + |day 3 change| + |day 4 change| + |day 5 change|)
Source: www.marketvolume.com


UCS_Murrey's Math Oscillator_V2Hello, Murrey Math lovers, Thanks for those who showed interest on this. Based on a request, I have updated the plot / candle coloring, for Version - 2.
This has been in the queue for a while.
There was a Glitch found with the Multiplier. Will Fix in the next version. The Current Version (and the previous version) only supports 1/8 fractions. Will not support 0.25. The code needs to be updated, to automate the fractal line glitches for other ratios, Planned for future update.
Good Luck and Enjoy the Colorful Oscillator. Please keep your suggestions flowing. Lets make it better.

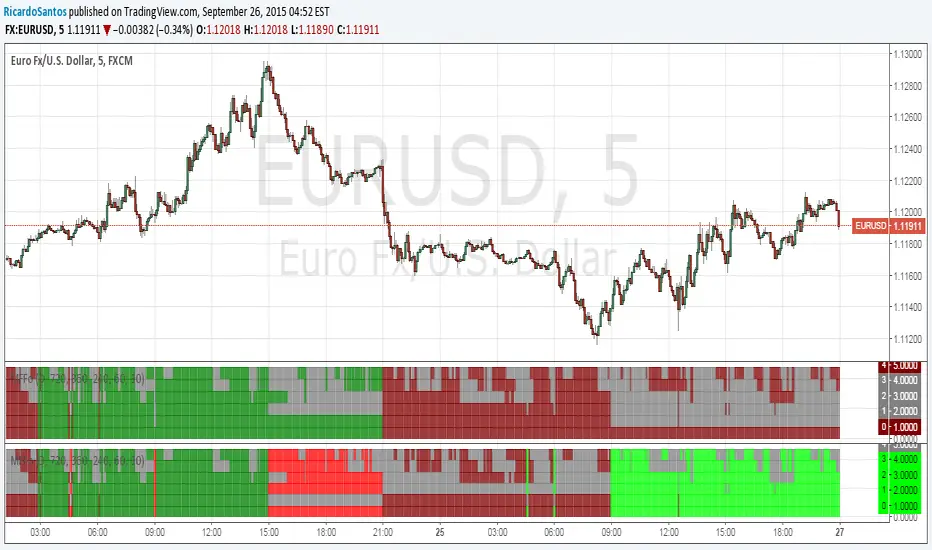
Indicators: MMA and 3 oscillatorsGuppy Multiple Moving Averages
---------------------------------
Developed by Daryl Guppy, the basic idea of Multiple moving average(MMA) is to view the trend as two band of moving averages – short term band and long term band.
Shortterm averages capture the inferred behaviour of traders and long term represents the investors. Uses fractal repetition to identify points of agreement and disagreement which precede significant trend changes.
Short intro on interpreting the signals:
drive.google.com
More info:
www.guppytraders.com
Guppy Oscillator
---------------------------------
The Guppy MMA Oscillator, developed by Leon Wilson, is an oscillator representation of difference between GMMA ribbons. Look for signal crosses for the triggers.
Linda Raschke (3/10) Oscillator
---------------------------------
This oscillator is similar to having a MACD of (3,10,16), the nuances are explained by Linda Raschke in her manual "Professional Trading Techniques":
www.lbrgroup.com
Ian Oscillator
---------------------------------
Simple EMA difference converted to an oscillator. Use the signal crosses as triggers.
