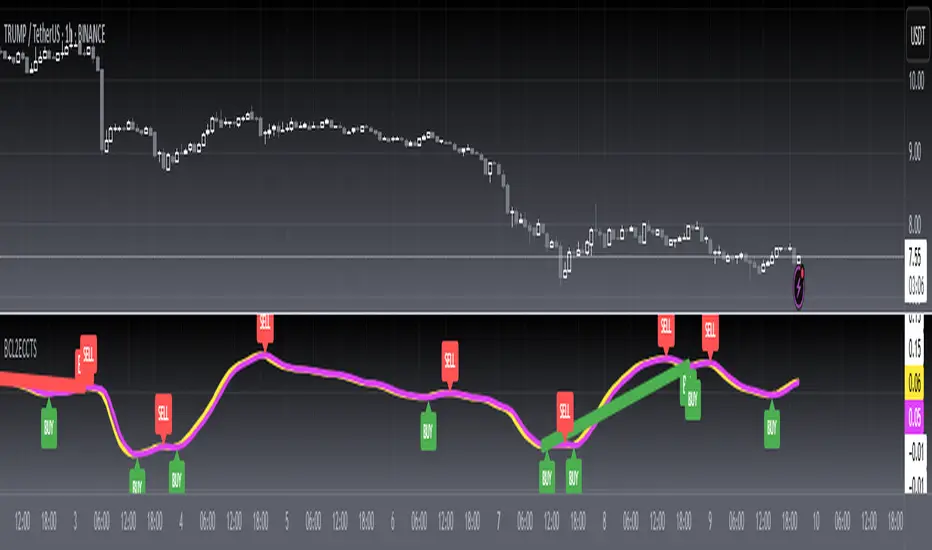
wosabi Investment assistant and Swing trading CRYPTOThis indicator works to calculate the exponential moving average (EMA) of three symbols. The first is the symbol shown on the chart in front of you, the second is for Bitcoin (it can be changed), and the third is the dollar strength index (DXY), which can be changed.
- The indicator calculates the exponential average of more than one symbol that you choose from the settings
When one of the lines appears in green, this means that the exponential average (EMA) is positive. Each line represents a different value for the averages that can be changed from the default settings to any other appropriate value.
Every five lines represent the averages of the symbol, and the three symbols are separated by a dashed white line to differentiate between the indicators of the three symbols.
Note: The colors have been changed inversely for the third symbol (dxy). When the averages are positive, the color will be red, and if they are negative, the color will be green, as the current settings are suitable for encrypted digital currency symbols that interact inversely with the Dollar Strength Index, and the colors can be changed from the indicator’s settings.
Integrating the values of the three symbols into the Relative Strength Index, which can be changed according to the leading symbols that influence positively or negatively, and this varies from one market to another to give a clearer indication when the negative symbol rises or falls and affects the rest of the symbols.
The current settings are suitable for the digital currency market, and the symbols must be changed for the rest of the markets
Note: The second symbol is the positive influence and the third symbol is the negative influence
"Exponential Moving Average" için komut dosyalarını ara

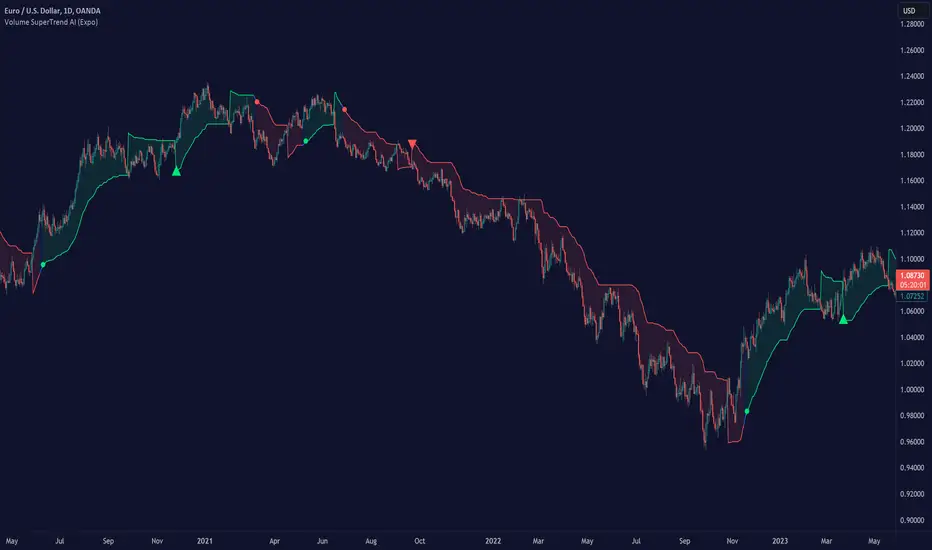
Volume SuperTrend AI (Expo)█ Overview
The Volume SuperTrend AI is an advanced technical indicator used to predict trends in price movements by utilizing a combination of traditional SuperTrend calculation and AI techniques, particularly the k-nearest neighbors (KNN) algorithm.
The Volume SuperTrend AI is designed to provide traders with insights into potential market trends, using both volume-weighted moving averages (VWMA) and the k-nearest neighbors (KNN) algorithm. By combining these approaches, the indicator aims to offer more precise predictions of price trends, offering bullish and bearish signals.
█ How It Works
Volume Analysis: By utilizing volume-weighted moving averages (VWMA), the Volume SuperTrend AI emphasizes the importance of trading volume in the trend direction, allowing it to respond more accurately to market dynamics.
Artificial Intelligence Integration - k-Nearest Neighbors (k-NN) Algorithm: The k-NN algorithm is employed to intelligently examine historical data points, measuring distances between current parameters and previous data. The nearest neighbors are utilized to create predictive modeling, thus adapting to intricate market patterns.
█ How to use
Trend Identification
The Volume SuperTrend AI indicator considers not only price movement but also trading volume, introducing an extra dimension to trend analysis. By integrating volume data, the indicator offers a more nuanced and robust understanding of market trends. When trends are supported by high trading volumes, they tend to be more stable and reliable. In practice, a green line displayed beneath the price typically suggests an upward trend, reflecting a bullish market sentiment. Conversely, a red line positioned above the price signals a downward trend, indicative of bearish conditions.
Trend Continuation signals
The AI algorithm is the fundamental component in the coloring of the Volume SuperTrend. This integration serves as a means of predicting the trend while preserving the inherent characteristics of the SuperTrend. By maintaining these essential features, the AI-enhanced Volume SuperTrend allows traders to more accurately identify and capitalize on trend continuation signals.
TrailingStop
The Volume SuperTrend AI indicator serves as a dynamic trailing stop loss, adjusting with both price movement and trading volume. This approach protects profits while allowing the trade room to grow, taking into account volume for a more nuanced response to market changes.
█ Settings
AI Settings:
Neighbors (k):
This setting controls the number of nearest neighbors to consider in the k-Nearest Neighbors (k-NN) algorithm. By adjusting this parameter, you can directly influence the sensitivity of the model to local fluctuations in the data. A lower value of k may lead to predictions that closely follow short-term trends but may be prone to noise. A higher value of k can provide more stable predictions, considering the broader context of market trends, but might lag in responsiveness.
Data (n):
This setting refers to the number of data points to consider in the model. It allows the user to define the size of the dataset that will be analyzed. A larger value of n may provide more comprehensive insights by considering a wider historical context but can increase computational complexity. A smaller value of n focuses on more recent data, possibly providing quicker insights but might overlook longer-term trends.
AI Trend Settings:
Price Trend & Prediction Trend:
These settings allow you to adjust the lengths of the weighted moving averages that are used to calculate both the price trend and the prediction trend. Shorter lengths make the trends more responsive to recent price changes, capturing quick market movements. Longer lengths smooth out the trends, filtering out noise, and highlighting more persistent market directions.
AI Trend Signals:
This toggle option enables or disables the trend signals generated by the AI. Activating this function may assist traders in identifying key trend shifts and opportunities for entry or exit. Disabling it may be preferred when focusing on other aspects of the analysis.
Super Trend Settings:
Length:
This setting determines the length of the SuperTrend, affecting how it reacts to price changes. A shorter length will produce a more sensitive SuperTrend, reacting quickly to price fluctuations. A longer length will create a smoother SuperTrend, reducing false alarms but potentially lagging behind real market changes.
Factor:
This parameter is the multiplier for the Average True Range (ATR) in SuperTrend calculation. By adjusting the factor, you can control the distance of the SuperTrend from the price. A higher factor makes the SuperTrend further from the price, giving more room for price movement but possibly missing shorter-term signals. A lower factor brings the SuperTrend closer to the price, making it more reactive but possibly more prone to false signals.
Moving Average Source:
This setting lets you choose the type of moving average used for the SuperTrend calculation, such as Simple Moving Average (SMA), Exponential Moving Average (EMA), etc.
Different types of moving averages provide various characteristics to the SuperTrend, enabling customization to align with individual trading strategies and market conditions.
-----------------
Disclaimer
The information contained in my Scripts/Indicators/Ideas/Algos/Systems does not constitute financial advice or a solicitation to buy or sell any securities of any type. I will not accept liability for any loss or damage, including without limitation any loss of profit, which may arise directly or indirectly from the use of or reliance on such information.
All investments involve risk, and the past performance of a security, industry, sector, market, financial product, trading strategy, backtest, or individual's trading does not guarantee future results or returns. Investors are fully responsible for any investment decisions they make. Such decisions should be based solely on an evaluation of their financial circumstances, investment objectives, risk tolerance, and liquidity needs.
My Scripts/Indicators/Ideas/Algos/Systems are only for educational purposes!
MW Volume ImpulseMW Volume Impulse
Settings
* Moving Average Period: The moving average period used to generate the moving average line for the bar chart. Default=14
* Dot Size: The size of the dot that indicates when the moving average of the CVD is breached. Default=10
* Dot Transparency: The transparency of the dot that indicates when the moving average of the CVD is breached. Default=50
* EMA: The exponential moving average that the price must break through, in addition to the CVD moving
* Accumulation Length: Period used to generate the Cumulative Volume Delta (CVD) for the bar chart. Default=14
Introduction
Velocity = Change in Position over time
Acceleration = Change in Velocity over time
For this indicator, Position is synonymous with the Cumulative Volume Delta (CVD) value. What the indicator attempts to do is to determine when the rate of acceleration of buying or selling volume is changing in either or buying or selling direction in a meaningful way.
Calculations
The CVD, upon which these changes is calculated using candle bodies and wicks. For a red candle, buying volume is calculated by multiplying the volume by the spread percentage of the average of the top and bottom wicks, while Selling Volume is calculated multiplying the volume by the spread percentage of the average of the top and bottom wicks - in addition to the spread percentage of the candle body.
For a green candle, buying volume is calculated by multiplying the volume by the spread percentage of the average of the top and bottom wicks - plus the spread percentage of the candle body - while Selling Volume is calculated using only the spread percentage average of the top and bottom wicks.
How to Interpret
The difference between the buying volume and selling volume is the source of what generates the red and green bars on the indicator. But, more specifically, this indicator uses an exponential moving average of these volumes (14 EMA by default) to determine that actual bar size. The change in this value indicates the velocity of volume and, ultimately, the red and green bars on the indicator.
- When the bar height is zero, that means that there is no velocity, which indicates either a balance between buyers and sellers, or very little volume.
- When the bar height remains largely unchanged from period to period - and not zero - it means that the velocity of volume is constant in one direction. That direction is indicated by the color of the bar. Buyers are dominating when the bars are green, and sellers are dominating when the bars are red.
- When the bar height increases, regardless of bar color, it means that volume is accelerating in a buying direction.
- When the bar height decreases, regardless of bar color, it means that volume is accelerating in a selling direction.
The white line represents the moving average of the bar values, while the red and white - and green and white - dots show when the moving average has been breached by the Cumulative Volume Delta value AND the price has broken the 7 EMA (which is user editable). As with most moving averages, a breach can indicate a move in a bearish or bullish direction, and the sensitivity can be adjusted for differing market conditions
Other Usage Notes and Limitations
For better use of the signal, consider the following,
1. Volume moving below the moving average can indicate that the volume may be ready to exit an overbought condition, especially if the bars were making lower highs prior to the signal - regardless of bar color.
3. Volume moving above the moving average can indicate that the volume may be ready to exit an oversold condition, especially if the bars were making higher lows prior to the signal - regardless of bar color.
Additionally, a green dot that occurs with a positive (green) Cumulative Volume Delta can indicate a buying condition, while a red dot that occurs with a negative (red) Cumulative Volume Delta can indicate a selling condition. What this means is that buying or selling momentum briefly went against the direction of buying or selling Cumulative Volume Delta , but was not strong enough to change the buying or selling direction. In cases like this, once the volume begins to accelerate again in the direction of the buying or selling volume - indicated by a red or green dot - then the price is more likely to favor the direction of the Cumulative Volume Delta and its corresponding acceleration.
Although a red or green signal can indicate a change in direction, this script cannot predict the magnitude or duration of the change. It is best used with accompanying indicators that can be used to confirm a direction change, such as a moving average, or a supply or demand range.

All in One EMA indicator with Average EMA Calculations The Indicator displays multiple exponential moving averages (EMAs) on the chart. The six available options will let you adjust and set ]exponential moving averages ( EMAS) as per your choice. Additionally I have added an Average ema which will calculate the average of all the emas that you have selected. This average ema works very strong and greatly to find potential zone of dynamic supports and resistance as well as to gauge the overall trend .. The average ema will also allow you to keep your chart clean and you wont have to add too many emas together.
The average of the selected EMAs are displayed as a single line. This helps identify trends and potential reversals in the market. i hope this indicator will help you with trading...
Plz use the chart BINANCE:LINKBTC as reference, for back testing and educational purposes only.
Thumbs up if you liked the script.
Happy trading..

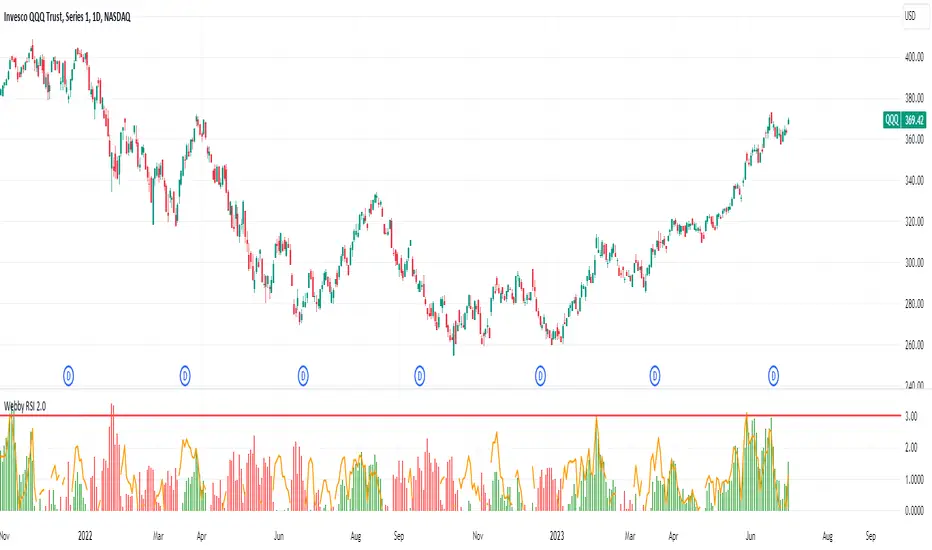
Webby's RSI 2.0Webby's RSI (Really Simple Indicator) 2.0 or version 5.150 as Mike himself calls it, builds upon the original Webby RSI by changing the way we measure extension from the 21-day exponential moving average.
Instead using the percentage of the low versus the 21-day exponential moving average, version 2 uses a multiple of the securities 50 day ATR (average true range) to determine the extension.
Version 2.0 also comes with some new additions, such as measuring the high vs 21-day exponential moving average when a security is below it, as well as an ATR extension from the 10-day simple moving average that Mike looks to as a guide to take partials.
Divergences in 52 Week Moving Averages, Adjusted and SmoothedThis script description is intended to be holistic and comprehensive for the understanding of the interested parties who view the script.
Following the PineCoders suggestions, I have provided detailed breakdowns both within the code and in the description immediately below:
► Description
This description is intended to be detailed and meaningful, conveying the understanding of the script’s intention to the user:
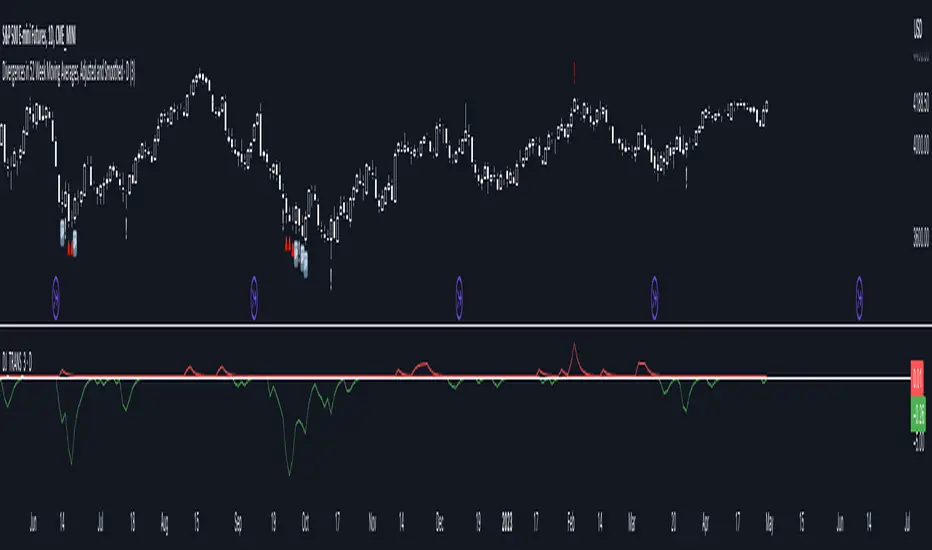
The theory: Divergences and extreme readings in 52-Week highs on major indexes can provide a view into a potential pending move in the opposite direction of how the market has been trending. By comparing the 52-Week Hi/Lo indices and applying an Exponential Moving Average (EMA), we can assess how extreme a move is from the average. If the move provides an extreme reading, it would potentially be beneficial to “fade” the move (take a position in the opposing direction).
The intention: The intentionality of this script is to provide a visualization of when the highly-probable opportunity to fade over a multi-day or multi-week period arises. In addition to this, based on backtesting prior moves and reading the various levels of significant reversals, three tiers: “Standard”, “Sensitive”, and “Highly Sensitive” have been applied, the user can choose which sensitivity level they would like to see, there are far less false positives on the Standard and Sensitive settings, while Highly Sensitive often signals multiple times with the move coming a few days later.
The application: The settings allow the user to customize their sensitivity to the fade signals, with the ability to customize the visual that shows up as well. For higher-highs that are fade-worthy, the signal will appear on the top of the candle, for lower-lows that are fade-worthy, the signal will appear on the bottom of the candle. The users risk criteria should be the primary driver of the entry/exit, although when backtesting it appears that the significant move is typically completed within a 2-4 week period at max and 3-5 day period at minimum.
A personal note: I am a futures trader intraday but would very strongly caution users when using this strategy with futures (unless their risk tolerance is higher than most). The most beneficial strategy when fading moves would be to enter in tranches, starting at the first signal and adding on any pullback (as long as the pullback is not below the initial entry point). 1-6 Week Date-To-Expiry options would be the primary method for applying this strategy. I would also like to add that SPY/SPX options (SPDR S&P 500 ETF Trust / CBOE S&P 500 Index) are the most liquid options that could be applied in this strategy.
► Description (additional)
With the understanding that few users can read pinescript (Pine), the description above contains all of the necessary information that is necessary for a user to understand the intention for script utilization. For those who do understand Pine, the code is commented in each section in order to provide an understanding of the underlying functions, calculations, and thought process that went on during the writing of the script.
► Description (additional)
This script’s description contains no delegations, all aspects of the script as well as the initial idea behind it are contained in the description above, which is self-contained in it’s entirety with a clear and defined purpose that is written with the intent to holistically capture the intent of the potential use for this indicator.
► General House Rule #2
This script and the description (as well as my profile) contain no links or associations to promotion of any kind, I am not a business, I am not an individual that will in any way make money from this script or the promotion of another person, idea, company, entity, or legal persons (foreign or domestic).
► Originality and usefulness
This is an original and custom script (and idea) that is not a rehashing or a copy of any code from any other programmers in the tradingview community.
Moonhub Cycle IndexMoonhub Cycle Index is a composite index derived from three popular technical analysis indicators: Moving Average Convergence Divergence (MACD), Schaff Trend Cycle (STC), and Detrended Price Oscillator (DPO). The indicator is designed to help identify potential trends and market sentiment by combining the unique characteristics of each indicator.
Key components of the indicator include:
Input Parameters:
COEMA Length (len_DIema): The length of the Exponential Moving Average (EMA) applied to the Custom Index. Default is set to 9.
COSMA Length (len_DIsma): The length of the Simple Moving Average (SMA) applied to the Custom Index. Default is set to 30.
Indicators:
MACD: A momentum oscillator that shows the relationship between two moving averages of a security's price. It is calculated using the difference between the 12-period and 26-period EMA, and a 9-period EMA (signal line) of the MACD.
STC: A cyclic indicator that identifies cyclical trends in the market. It is calculated using the Stochastic oscillator formula applied to the close, high, and low prices over a 10-period lookback window.
DPO: A price oscillator that eliminates the trend from price data to focus on underlying cycles. It is calculated using a custom function that shifts the price by half the length and subtracts the SMA from the shifted price.
Custom Index: The composite index is calculated by taking the average of the MACD line, STC, and DPO.
COEMA and COSMA: Exponential and Simple Moving Averages applied to the Custom Index using the lengths specified by the input parameters (len_DIema and len_DIsma).
Plots: The Custom Index, COEMA, and COSMA are plotted with different colors and line widths to visualize their interaction and provide insights into potential market trends.
This Custom Index Indicator can be useful for traders who want to analyze the market using a combination of these indicators to make more informed decisions. It can also help identify potential trends and market sentiment by combining the unique characteristics of each indicator.

Flat Market and Low ADX Indicator [CHE]Why use the Flat Market and Low ADX Indicator ?
Flat markets, where prices remain within a narrow range for an extended period, can be both critical and dangerous for traders. In a flat market, the price action becomes less predictable, and traders may struggle to find profitable trading opportunities. As a result, many traders may decide to take a break from the market until a clear trend emerges.
However, flat markets can also be dangerous for traders who continue to trade despite the lack of clear trends. In the absence of a clear direction, traders may be tempted to take larger risks or make impulsive trades in an attempt to capture small profits. Such behavior can quickly lead to significant losses, especially if the market suddenly breaks out of its flat range, causing traders to experience large drawdowns.
Therefore, it is essential to approach flat markets with caution and to have a clear trading plan that incorporates strategies for both trending and flat markets. Traders may also use technical indicators, such as the Flat Market and Low ADX Indicator, to help identify flat markets and determine when it is appropriate to enter or exit a position.
The confluence between flat markets and low ADX readings can further increase the risk of trading during these periods. The ADX (Average Directional Index) is a technical indicator used to measure the strength of a trend. A low ADX reading indicates that the market is in a consolidation phase, which can coincide with a flat market. When a flat market occurs during a period of low ADX, traders should be even more cautious, as there is little to no directional bias in the market. In this situation, traders may want to consider waiting for a clear trend to emerge or using range-bound trading strategies to avoid taking excessive risks.
Introduction:
Pine Script is a programming language used for developing custom technical analysis indicators and trading strategies in TradingView. This particular script is an indicator designed to identify flat markets and low ADX conditions. In this description, we will delve deeper into the functionality of this script and how it can be used to improve trading decisions.
Description:
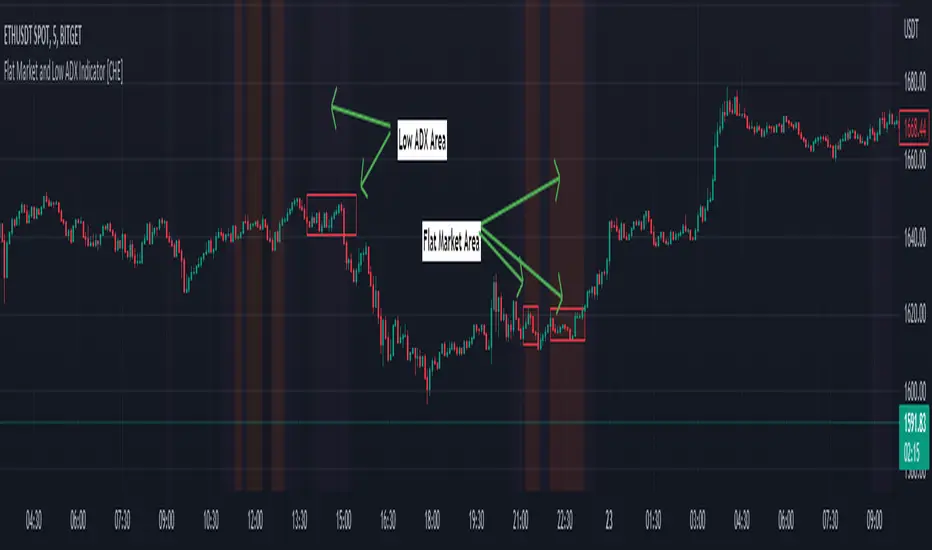
The first input in the script is the length of the moving average used for calculating the center line. This moving average is used to define the high and low range of the market. The script then calculates the middle value of the range by taking the double exponential moving average (EMA) of the high, low, and close prices.
The script then determines whether the market is flat by comparing the middle value of the range with the high and low values. If the middle value is greater than the high value or less than the low value, the market is not flat. If the middle value is within the high and low range, the script considers the market to be flat. The script also uses RSI filter settings to further confirm if the market is flat or not. If the RSI value is between the RSI min and max values, then the market is considered flat. If the RSI value is outside this range, the market is not considered flat.
The script also calculates the ADX (Average Directional Index) to determine whether it's in a low area. ADX is a technical indicator used to measure the strength of a trend. The script uses the ADX filter settings to define the ADX threshold value. If the ADX value is below the threshold value, the script considers the market to be in a low ADX area.
The script provides various input options to customize the display settings, including the option to show the flat market and low ADX areas. Users can choose their preferred colors for the flat market and low ADX areas and adjust the transparency levels to suit their needs.
Conclusion:
In conclusion, this Pine Script indicator is designed to identify flat market and low ADX conditions, which can help traders make informed trading decisions. The script uses a range of inputs and calculations to determine the market direction, RSI filter, and ADX filter. By customizing the display settings, users can adjust the indicator to suit their preferences and improve their trading strategies. Overall, this script can be a valuable tool for traders looking to gain an edge in the markets.
Acknowledgments:
Thanks to the Pine Script™ v5 User Manual www.tradingview.com
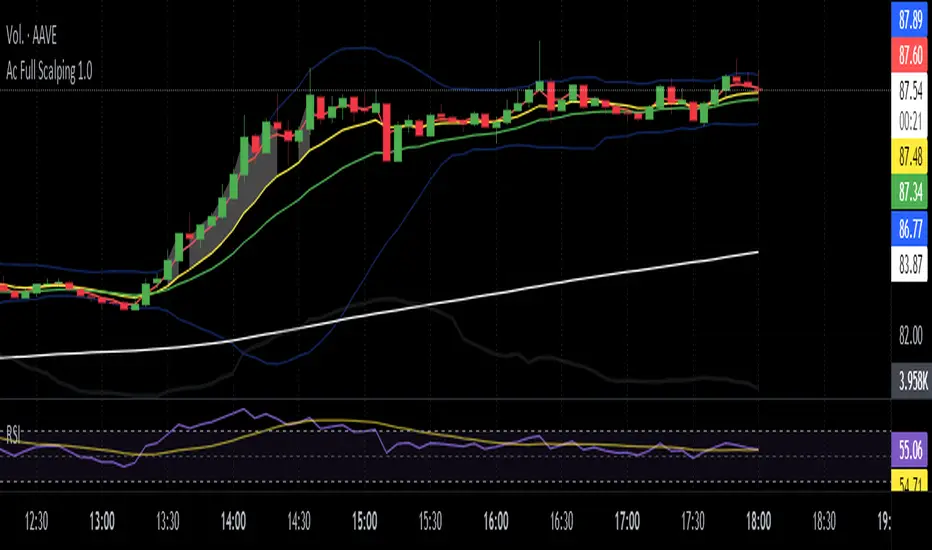
Ac Full Scalping 1.0These unified indicators are used for a 5-minute scalping strategy.
We regularly look for the RSI to be overbought and the price to be outside the bollinger bands as the main analysis.
This serves as a search protocol, to then analyze the price action by visually assisting us with 4 exponential moving averages to see wear or breakout of a move.
It also adds the distance from the price close to the 10-period exponential moving average, developed in two modes where you can mark a background color where the event occurs, or you can choose a shadow that is drawn from the exponential moving average to the closing price.
These two modes can be activated or deactivated so that each person can choose the most visually comfortable way to observe that distance, it is recommended to use one at a time and not both at the same time.
The distance indicator can also be used to change the distance percentage. The percentage as a minimum value admits 0.50%, but it is recommended to use it above 0.80% to make the analysis more effective.
People can also change colors of exponential moving averages, but it is not recommended, and the period cannot be changed to keep the analysis more specific.
The RSI indicator should be added separately, as it is used to see overbought values and divergences.
The other indicators are unified but can be turned on or off for better analysis.
As a summary, what is sought with this type of unified indicators is the attrition, break or retracement in 5-minute time frame to open only short trades.
TechnicalRating█ OVERVIEW
This library is a Pine Script™ programmer’s tool for incorporating TradingView's well-known technical ratings within their scripts. The ratings produced by this library are the same as those from the speedometers in the technical analysis summary and the "Rating" indicator in the Screener , which use the aggregate biases of 26 technical indicators to calculate their results.
█ CONCEPTS
Ensemble analysis
Ensemble analysis uses multiple weaker models to produce a potentially stronger one. A common form of ensemble analysis in technical analysis is the usage of aggregate indicators together in hopes of gaining further market insight and reinforcing trading decisions.
Technical ratings
Technical ratings provide a simplified way to analyze financial markets by combining signals from an ensemble of indicators into a singular value, allowing traders to assess market sentiment more quickly and conveniently than analyzing each constituent separately. By consolidating the signals from multiple indicators into a single rating, traders can more intuitively and easily interpret the "technical health" of the market.
Calculating the rating value
Using a variety of built-in TA functions and functions from our ta library, this script calculates technical ratings for moving averages, oscillators, and their overall result within the `calcRatingAll()` function.
The function uses the script's `calcRatingMA()` function to calculate the moving average technical rating from an ensemble of 15 moving averages and filters:
• Six Simple Moving Averages and six Exponential Moving Averages with periods of 10, 20, 30, 50, 100, and 200
• A Hull Moving Average with a period of 9
• A Volume-Weighted Moving Average with a period of 20
• An Ichimoku Cloud with a conversion line length of 9, base length of 26, and leading span B length of 52
The function uses the script's `calcRating()` function to calculate the oscillator technical rating from an ensemble of 11 oscillators:
• RSI with a period of 14
• Stochastic with a %K period of 14, a smoothing period of 3, and a %D period of 3
• CCI with a period of 20
• ADX with a DI length of 14 and an ADX smoothing period of 14
• Awesome Oscillator
• Momentum with a period of 10
• MACD with fast, slow, and signal periods of 12, 26, and 9
• Stochastic RSI with an RSI period of 14, a %K period of 14, a smoothing period of 3, and a %D period of 3
• Williams %R with a period of 14
• Bull Bear Power with a period of 50
• Ultimate Oscillator with fast, middle, and slow lengths of 7, 14, and 28
Each indicator is assigned a value of +1, 0, or -1, representing a bullish, neutral, or bearish rating. The moving average rating is the mean of all ratings that use the `calcRatingMA()` function, and the oscillator rating is the mean of all ratings that use the `calcRating()` function. The overall rating is the mean of the moving average and oscillator ratings, which ranges between +1 and -1. This overall rating, along with the separate MA and oscillator ratings, can be used to gain insight into the technical strength of the market. For a more detailed breakdown of the signals and conditions used to calculate the indicators' ratings, consult our Help Center explanation.
Determining rating status
The `ratingStatus()` function produces a string representing the status of a series of ratings. The `strongBound` and `weakBound` parameters, with respective default values of 0.5 and 0.1, define the bounds for "strong" and "weak" ratings.
The rating status is determined as follows:
Rating Value Rating Status
< -strongBound Strong Sell
< -weakBound Sell
-weakBound to weakBound Neutral
> weakBound Buy
> strongBound Strong Buy
By customizing the `strongBound` and `weakBound` values, traders can tailor the `ratingStatus()` function to fit their trading style or strategy, leading to a more personalized approach to evaluating ratings.
Look first. Then leap.
█ FUNCTIONS
This library contains the following functions:
calcRatingAll()
Calculates 3 ratings (ratings total, MA ratings, indicator ratings) using the aggregate biases of 26 different technical indicators.
Returns: A 3-element tuple: ( [(float) ratingTotal, (float) ratingOther, (float) ratingMA ].
countRising(plot)
Calculates the number of times the values in the given series increase in value up to a maximum count of 5.
Parameters:
plot : (series float) The series of values to check for rising values.
Returns: (int) The number of times the values in the series increased in value.
ratingStatus(ratingValue, strongBound, weakBound)
Determines the rating status of a given series based on its values and defined bounds.
Parameters:
ratingValue : (series float) The series of values to determine the rating status for.
strongBound : (series float) The upper bound for a "strong" rating.
weakBound : (series float) The upper bound for a "weak" rating.
Returns: (string) The rating status of the given series ("Strong Buy", "Buy", "Neutral", "Sell", or "Strong Sell").

Channels Strategy [JoseMetal]============
ENGLISH
============
- Description:
This strategy is based on Bollinger Bands / Keltner Channel price "rebounds" (the idea of price bouncing from one band to another).
The strategy has several customizable options, which allows you to refine the strategy for your asset and timeframe.
You can customize settings for ALL indicators, Bollinger Bands (period and standard deviation), Keltner Channel (period and ATR multiplier) and ATR (period).
- AVAILABLE INDICATORS:
You can pick Bollinger Bands or Keltner Channels for the strategy, the chosen indicator will be plotted as well.
- CUSTOM CONDITIONS TO ENTER A POSITION:
1. Price breaks the band (low below lower band for LONG or high above higher band for SHORT).
2. Same as 1 but THEN (next candle) price closes INSIDE the bands.
3. Price breaks the band AND CLOSES OUT of the band (lower band for LONG and higher band for SHORT).
4. Same as 3 but THEN (next candle) price closes INSIDE the bands.
- STOP LOSS OPTIONS:
1. Previous wick (low of previous candle if LONG and high or previous candle if SHORT).
2. Extended band, you can customize settings for a second indicator with larger values to use it as STOP LOSS, for example, Bollinger Bands with 2 standard deviations to open positions and 3 for STOP LOSS.
3. ATR: you can pick average true ratio from a source (like closing price) with a multiplier to calculate STOP LOSS.
- TAKE PROFIT OPTIONS:
1. Opposite band (top band for LONGs, bottom band for SHORTs).
2. Moving average: Bollinger Bands simple moving average or Keltner Channel exponential moving average .
3. ATR: you can pick average true ratio from a source (like closing price) with a multiplier to calculate TAKE PROFIT.
- OTHER OPTIONS:
You can pick to trade only LONGs, only SHORTs, both or none (just indicator).
You can enable DYNAMIC TAKE PROFIT, which updates TAKE PROFIT on each candle, for example, if you pick "opposite band" as TAKE PROFIT, it'll update the TAKE PROFIT based on that, on every single new candle.
- Visual:
Bands shown will depend on the chosen indicator and it's settings.
ATR is only printed if used as STOP LOSS and/or TAKE PROFIT.
- Recommendations:
Recommended on DAILY timeframe , it works better with Keltner Channels rather than Bollinger Bands .
- Customization:
As you can see, almost everything is customizable, for colors and plotting styles check the "Style" tab.
Enjoy!
============
ESPAÑOL
============
- Descripción:
Esta estrategia se basa en los "rebotes" de precios en las Bandas de Bollinger / Canal de Keltner (la idea de que el precio rebote de una banda a otra).
La estrategia tiene varias opciones personalizables, lo que le permite refinar la estrategia para su activo y temporalidad favoritas.
Puedes personalizar la configuración de TODOS los indicadores, Bandas de Bollinger (periodo y desviación estándar), Canal de Keltner (periodo y multiplicador ATR) y ATR (periodo).
- INDICADORES DISPONIBLES:
Puedes elegir las Bandas de Bollinger o los Canales de Keltner para la estrategia, el indicador elegido será mostrado en pantalla.
- CONDICIONES PERSONALIZADAS PARA ENTRAR EN UNA POSICIÓN:
1. El precio rompe la banda (mínimo por debajo de la banda inferior para LONG o máximo por encima de la banda superior para SHORT).
2. Lo mismo que en el punto 1 pero ADEMÁS (en la siguiente vela) el precio cierra DENTRO de las bandas.
3. El precio rompe la banda Y CIERRA FUERA de la banda (banda inferior para LONG y banda superior para SHORT).
4. Igual que el 3 pero ADEMÁS (siguiente vela) el precio cierra DENTRO de las bandas.
- OPCIONES DE STOP LOSS:
1. Mecha anterior (mínimo de la vela anterior si es LONGy máximo de la vela anterior si es SHORT).
2. Banda extendida, puedes personalizar la configuración de un segundo indicador con valores más extensos para utilizarlo como STOP LOSS, por ejemplo, Bandas de Bollinger con 2 desviaciones estándar para abrir posiciones y 3 para STOP LOSS.
3. ATR: puedes elegir el average true ratio de una fuente (como el precio de cierre) con un multiplicador para calcular el STOP LOSS.
- OPCIONES DE TAKE PROFIT:
1. Banda opuesta (banda superior para LONGs, banda inferior para SHORTs).
2. Media móvil: media móvil simple de las Bandas de Bollinger o media móvil exponencial del Canal de Keltner .
3. ATR: se puede escoger el average true ratio de una fuente (como el precio de cierre) con un multiplicador para calcular el TAKE PROFIT.
- OTRAS OPCIONES:
Puedes elegir operar sólo con LONGs, sólo con SHORTs, ambos o ninguno (sólo el indicador).
Puedes activar el TAKE PROFIT DINÁMICO, que actualiza el TAKE PROFIT en cada vela, por ejemplo, si eliges "banda opuesta" como TAKE PROFIT, actualizará el TAKE PROFIT basado en eso, en cada nueva vela.
- Visual:
Las bandas mostradas dependerán del indicador elegido y de su configuración.
El ATR sólo se muestra si se utiliza como STOP LOSS y/o TAKE PROFIT.
- Recomendaciones:
Recomendada para temporalidad de DIARIO, funciona mejor con los Canales de Keltner que con las Bandas de Bollinger .
- Personalización:
Como puedes ver, casi todo es personalizable, para los colores y estilos de dibujo comprueba la pestaña "Estilo".
¡Que lo disfrutes!

Short Selling EMA Cross (By Coinrule)BINANCE:AVAXUSDT
This short selling script works best in periods of downtrends and general bearish market conditions, with the ultimate goal to sell as the the price decreases further and buy back before a rebound.
This script can work well on coins you are planning to hodl for long-term and works especially well whilst using an automated bot that can execute your trades for you. It allows you to hedge your investment by allocating a % of your coins to trade with, whilst not risking your entire holding. This mitigates unrealised losses from hodling as it provides additional cash from the profits made. You can then choose to to hodl this cash, or use it to reinvest when the market reaches attractive buying levels.
Entry
The exponential moving average ( EMA ) 20 and EMA 50 have been used for the variables determining the entry to the short. EMAs can operate better than simple moving averages due to the additional weighting placed on the most recent data points, whereas simple moving averages weight all the data the same. This means that price is tracked more closely and the most recent volatile moves can be captured and exploited more efficiently using EMAs.
Our backtesting data revealed that the most profitable timeframe was the 30-minute timeframe, this also enabled a good frequency of trades and high profitability.
A fast (shorter term) exponential moving average , in this strategy the EMA 20, crossing under a slow (longer term) moving average, in this example the EMA 50, signals the price of an asset has started to trend to the downside, as the most recent data signals price is declining compared to earlier data. The entry acts on this principle and executes when the EMA 20 crosses under the EMA 50.
Enter Short: EMA 20 crosses under EMA 50.
Exit
This script utilises a take profit and stop loss for the exit. The take profit is set at -8% and the stop loss is set at +16% from the entry price. This would normally be a poor trade due to the risk:reward equalling 0.5. However, when looking at the backtesting data, the high profitability of the strategy (93.33%) leads to increased confidence and showcases the high probability of success according to historical data.
The take profit (-8%) and the stop loss (+16%) of the strategy are widely placed to ensure the move is captured without being stopped out due to relief rallies. The stop loss also plays a role of mitigating losses and minimising risk of being stuck in a short position once there has been a fundamental trend reversal and the market has become bullish .
Exit Short: -8% price decrease from entry price.
OR
Exit Short: +16% price increase from entry price.
Tip: Research what coins have consistent and large token unlocks / highly inflationary tokenomics, and target these during bear markets to short as they will most likely have substantial selling pressure that outweighs demand - leading to declining prices.
The strategy assumes each order is using 30% of the available coins to make the results more realistic and to simulate you only ran this strategy on 30% of your holdings. A trading fee of 0.1% is also taken into account and is aligned to the base fee applied on Binance.
The backtesting data was recorded from December 1st 2021, just as the market was beginning its downtrend. We therefore recommend analysing the market conditions prior to utilising this strategy as it operates best on weak coins during downtrends and bearish conditions.

Squeeze M + ADX + TTM (Trading Latino & John Carter) by [Rolgui]About this indicator:
This indicator aims to combine two good performing strategies, which can be used separately or together, mainly for investment positions, although it can also be used for intraday trading.
Strategy 1) Squeeze Oscillator and Average Directional Index:
This strategy is taught by Jaime Aibsai, which determines market entries based on reading the direction of the price movement (Directionality of the Oscillator) along with the strength of the Oscillator (Slope of the ADX).
Both tools are configured according to Jaime Abisai's strategy, by default (note that point 23 of the ADX is represented by point 0 on the panel, to make reading easier, its interpretation is not affected). Anyway you can adjust the input data according to your interest.
*You can see this setting in the first panel.
Strategy 2) Squeeze Momentum and Trade The Market Waves:
This strategy can be consulted either in John F. Carter's books or on his website.
This market reading is based on Price Volatility (Bollinger Bands and Keltner Channels interaction) and its Trend (Exponential Moving Averages), showing entries at times when price volatility is low and taking filtering active trend using T.T.M. Waves.
To configure the indicator in the same way that Carter does, it would be enough to turn off the ADX, turn on the Squeeze Momentum signals along with the T.T.M. Waves, and importantly, change the Linear Momentum value to 12 (this configuration can be found in his book).
*You can see this setting in the second panel.
Why this indicator?
I've added and removed the above flags as I needed to query them (which became tedious for me). The main objective of having merged them into one is to make their reading more agile and comfortable and thus improve the decision-making capacity of the trader who wishes to use them.
Credits and Acknowledgments:
I would like to give credits to other authors, for the sections of code that I have used to make this technical indicator. Thanks to @LazyBear, @matetaronna, @jombie and @joren for contributing to the community and keeping their code open. It is priceless!
Feel free to combine and practice your trading with both strategies, personally, they improved my profitability and this is why I recommend researching more about them. I've been using it for crypto investing, let me know if it's worth for you on stock market!
If you have any questions or suggestions you can leave it in the comments!
Greetings!

DEMA / EMA moving averagesSince a moving average averages values, they lag recent price action. So when there’s a sudden price spike or when a new trend begins, the moving average is a bit late to the party. Over the years several people have developed moving averages that reduce price lag as much as possible.
One of those tweaked moving averages is the Double Exponential Moving Average (DEMA). This indicator was introduced by Patrick Mulloy in a 1994 article named “Smoothing Data With Faster Moving Averages” (Mitchell, 2019).
You can easily switch DEMA or EMA averages and show crossover signals
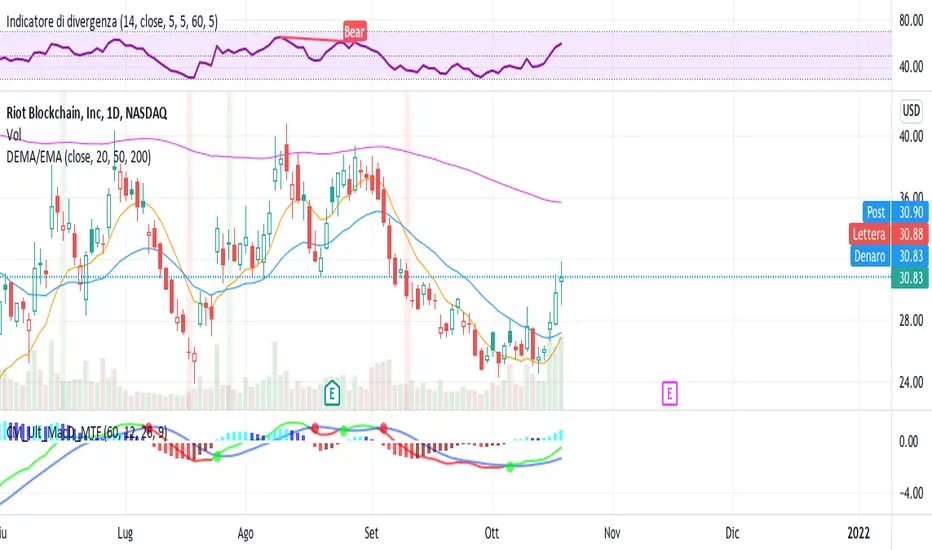
MACD-EDT "EMA DEMA TEMA" [DM]Greetings to all colleagues
Today I share a MACD with the EMA , DEMA , TEMA variants.
The aim is that they can see how the signals vary from a normal MACD to one with the averages created by Patrick Mulloy (1994)
Variables of this MACD:
EMA = Exponential Moving Average
DEMA = Double Exponential Moving Average
TOPIC = Triple Exponential Moving Average
He also has in the arsenal:
SMA Simple Moving Average
WMA Weighted Moving Average
Plus...:
Volume-weighted variant in all of them
Visual options:
Points at the crossroads
Shadows on the body of the signals
All colors are customizable
Histogram and shadow are gradients at 15 steps
It has switches for:
Shadow
Histogram
Macd and signal
Crosses
Some minor details remain to be incorporated in the next few days.
Pre-cross calculation.
Alerts
Bar color
Enjoy!!! ;-)

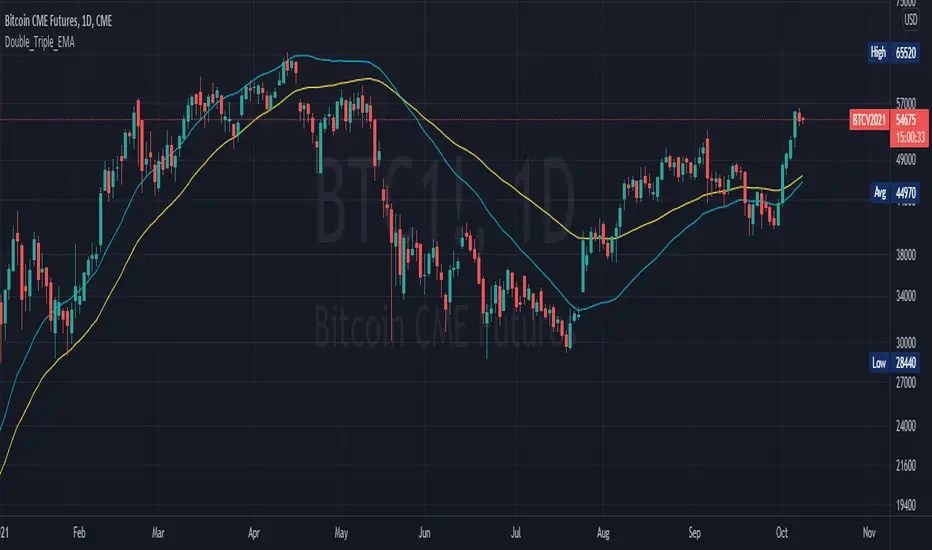
Double_Triple_EMALibrary "Double_Triple_EMA"
Provides the functions to calculate Double and Triple Exponentional Moving Averages (DEMA & TEMA).
dema(_source, _length) Calculates Double Exponentional Moving Averages (DEMA)
Parameters:
_source : -> Open, Close, High, Low, etc ('close' is used if no argument is supplied)
_length : -> DEMA length
Returns: Double Exponential Moving Average (DEMA) of an input source at the specified input length
tema(_source, _length) Calculates Triple Exponentional Moving Averages (TEMA)
Parameters:
_source : -> Open, Close, High, Low, etc ('close' is used if no argument is supplied)
_length : -> TEMA length
Returns: Triple Exponential Moving Average (TEMA) of an input source at the specified input length
Moving Average Crossover with Shading Signals This script uses 3 moving averages (2 simple moving averages and 1 exponential moving average ) to signal long and short opportunities based on moving average crossovers.
A long SMA (Signal SMA2) is used to determine longer term trend. When the EMA crosses above the Slow SMA1 and price is above the Signal SMA2. The space between the moving averages will shade green and the Signal SMA should also be green.
A sell signal occurs when the EMA crosses below the Slow SMA1 and price is below the Signal SMA2. The space between the moving averages will turn red and the Signal SMA should also be red.
A retracement, consolidation, or reversal may be occurring if the shaded color is yellow.
Use the identifying shapes to learn when to open or close positions.

Overbought/Oversold BandsThe basis of this script is my "Hybrid Overbought/Oversold Detector" which uses many different oscillators to confirm overbought/oversold conditions. The main idea is to generate higher and lower bands around the desired moving average using an average of the volatility (ATR) and the standard deviation (StDev), of course by interfering detected overbought/oversold condition.
Simply put, the more the asset become overvalued/undervalued, the tighter the channel would be and every breakout of the bands announces a return back into the channel in near future.
By default, the multiplier of the standard deviation in the indicator settings is set to 2 which means only less than 5% of price actions would appear outside the bands. Also the default multiplier of the ATR is set to 3 which leads to some similar result, but to achieve more strict results setting StDev multiplier to 3 and ATR multiplier to 4 would be useful.
The type of the central moving average could be picked up from 6 different types which are:
- SMA (Simple Moving Average)
- EMA (Exponential Moving Average)
- HMA (Hull Moving Average)
- LSMA (Least Squares Moving Average)
- TMA (Triangular Moving Average)
- MAEMA (My Personalized Momentum Adjusted EMA)
The latter one leads to a useful combination of the channel with the momentum.
Also the script has multi-timeframe features and the user could apply calculations from other time frames to the current chart.
Hope the idea would be helpful!
[blackcat] L2 Ehlers Cyber Cycle Trading StrategyLevel: 2
Background
John F. Ehlers introuced Cyber Cycle Trading Strategy in his "Cybernetic Analysis for Stocks and Futures" chapter 4 on 2004.
Function
With cyber cycle alone, the Trigger lags the Cycle by one bar, so that their crossing introduces at least another bar of lag. Finally, Dr Ehler concluded that we can’t execute the trade until the bar after the signal is observed. In total, that means our trade execution will be at least four bars late. If we are working with an eight-bar cycle, that means the signal will be exactly wrong. We could do better to buy when the signal says sell, and vice versa.
The difficulties arising from the lag suggest a way to build an automatic trading strategy. Suppose we choose to use the trading signal in the opposite direction of the signal. That will work if we can introduce lag so the correct signal will be given in the more general case, not just the case of an eight-bar cycle. Therefore, the Cyber Cycle trading strategy was introduced by Dr. Ehlers. It starts exactly the same as the Cyber Cycle Indicator. Dr. Ehlers then introduce the variable Signal, which is an exponential moving average of the Cycle variable. The exponential moving average generates the desired lag in the trading signal. The relationship between the alpha of an exponential moving average and lag is alpha2 = 1/ (Lag+1). This relationship is used to create the variable alpha2 in the code and the variable Signal using the exponential moving average. The trading signals using the variable Signal crossing itself delayed by one bar are exactly the opposite of the trading signals I would have used if there were no delay. But, since the variable Signal is delayed such that the net delay is less than half a cycle, the trading signals are correct to catch the next cyclic reversal. The idea of betting against the correct direction by waiting for the next cycle reversal can be pretty scary because that reversal may “never” happen because the market takes off in a trend. For this reason Dr. Ehlers included two lines of code that are escape mechanisms if we were wrong in our entry signal. These last two Signal lines of code reverse the trading position if we have been in the trade for more than eight bars and the trade has an open position loss.
Key Signal
Cycle ---> Cyber Cycle fast line
Cycle (2) ---> Cyber Cycle slow line
Signal ---> Trading signal fast line
Signal(1) ---> Trading signal slow line
Pros and Cons
100% John F. Ehlers definition translation of original work, even variable names are the same. This help readers who would like to use pine to read his book. If you had read his works, then you will be quite familiar with my code style.
Remarks
The 25th script for Blackcat1402 John F. Ehlers Week publication.
Readme
In real life, I am a prolific inventor. I have successfully applied for more than 60 international and regional patents in the past 12 years. But in the past two years or so, I have tried to transfer my creativity to the development of trading strategies. Tradingview is the ideal platform for me. I am selecting and contributing some of the hundreds of scripts to publish in Tradingview community. Welcome everyone to interact with me to discuss these interesting pine scripts.
The scripts posted are categorized into 5 levels according to my efforts or manhours put into these works.
Level 1 : interesting script snippets or distinctive improvement from classic indicators or strategy. Level 1 scripts can usually appear in more complex indicators as a function module or element.
Level 2 : composite indicator/strategy. By selecting or combining several independent or dependent functions or sub indicators in proper way, the composite script exhibits a resonance phenomenon which can filter out noise or fake trading signal to enhance trading confidence level.
Level 3 : comprehensive indicator/strategy. They are simple trading systems based on my strategies. They are commonly containing several or all of entry signal, close signal, stop loss, take profit, re-entry, risk management, and position sizing techniques. Even some interesting fundamental and mass psychological aspects are incorporated.
Level 4 : script snippets or functions that do not disclose source code. Interesting element that can reveal market laws and work as raw material for indicators and strategies. If you find Level 1~2 scripts are helpful, Level 4 is a private version that took me far more efforts to develop.
Level 5 : indicator/strategy that do not disclose source code. private version of Level 3 script with my accumulated script processing skills or a large number of custom functions. I had a private function library built in past two years. Level 5 scripts use many of them to achieve private trading strategy.
@theCF StochasticStochastic with Bullish , Bearish and Neutral Ranges as well as a modification to check the %D line with a Exponential Moving Average .
Since Exponential Moving Averages put more weight onto recent values, they react differently than the Standard Simple Moving Average .
On Stochastic I have observed, that there can often occur false crossover signals. While this also happens with an Exponential Moving Average as %D indeed, the amount is more limited, therefore giving less false signals.
I prefer to display both at the same time, for more information.
The ranges act as general support and resistance zones on Stochastic . Whenever Stochastic oscillates within one of the ranges, one can interpret it as either bullish , neutral or bearish for price.
A Stochastic that oscillates mainly within the bullish range can be interpreted rather bullish , the opposite goes for the bearish range which is interpreted bearish .
I have coded these ranges into the Standard Stochastic Script, as well as the option to display the %D line as a Exponential Moving Average .
For more information about the indicator, feel free to leave a comment and ask.

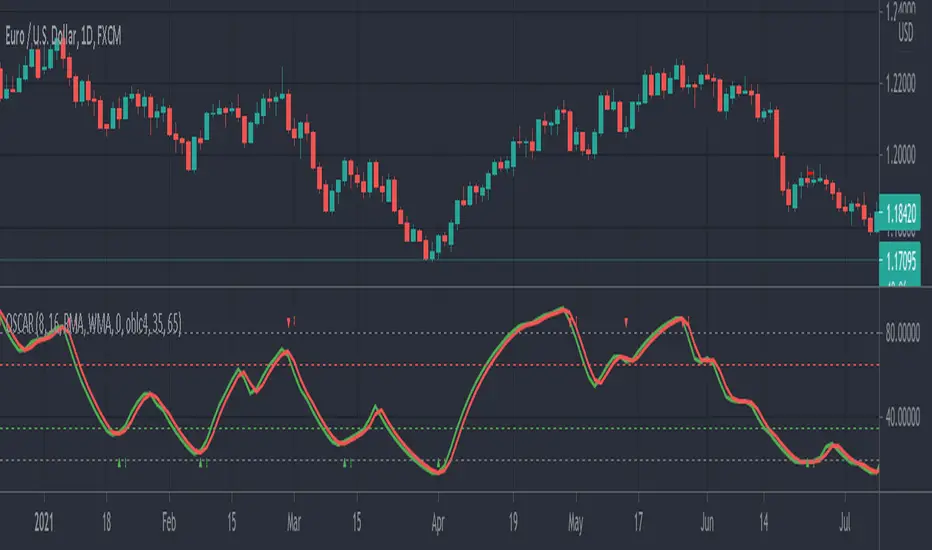
OSCAR Oscillator by GenZai - NNFXOSCAR Oscillator by GenZai
Green line is the Oscar Rough
Red line is the Oscar
By default based on the 8 last candles and smoothed using RMA
Purple line is the Slow Oscar
By default based on the 16 last candles and smoothed using WMA
HOW TO USE
Exit signaling
This indicator can be used as an exit indicator when line cross each other.
Entry signaling
When the green line crosses up, it indicates a long entry
When the red line crosses up, it indicates a short entry
Overbought/Oversold
When the indicator crosses the dashed grey lines it indicates Overbought Oversold
Slow Oscar Add-on
This is an Add-on to the orignal Oscar indicator
Can be hidden if you want the original experience of the Oscar indicator.
Can be used as a confirmation indicator by looking at the direction of the slope to verify is your are trending long or trending short.
Can be used as a baseline to confirm signals given by Oscar
Can be used to tweak your signals and test different settings.
Stock or Forex?
The program was originally written for stocks, but works equally well with the Forex market.
How this indicator is calculated ?
This is the formula we use to calculate the Oscar:
let A = the highest high of the last eight days (including today)
let B = the lowest low of the past eight days (including today)
let C = today's closing price
let X = yesterday's oscillator figure (Oscar)
Today's "rough" oscillator equals (C-B) divided by (A-B) times 100.
Next we "smooth" our rough number (let's call it Y) like this:
Final oscillator number = ((X divided by 3) times 2), plus (Y divided by 3).
SETTINGS:
You can choose between different smoothing options:
RMA: Moving average used in RSI. It is the Adjusted exponential moving averages (also known as Wilder's exponential moving average)
SMA : Simple moving average
EMA : Exponential moving average
WMA : Weighted moving average
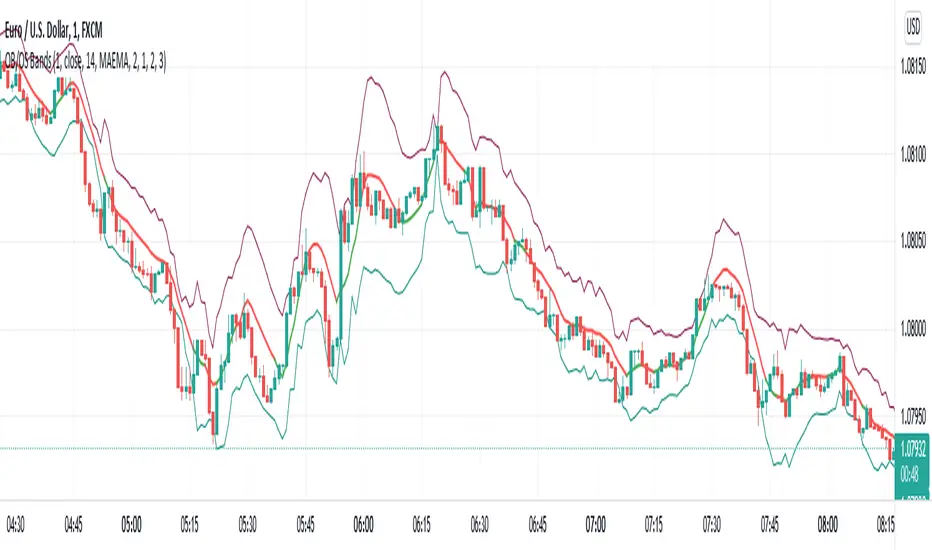
RV-Scalping 34EAV ChannelWorks well with 1/3/5/15 min & above
//34 Exponential Moving Average of the Close
//34 Exponential Moving Average of the High
//34 Exponential Moving Average of the Low
//https://www.forexstrategiesresources.com/scalping-forex-strategies/106-1-min-scalping-with-34-exponential-moving-average-channel/
// When price is above the MAs (Moving Averages) we are only looking to buy as price comes back to the MAs.
// And when price is below the MAs, we are only looking to sell when price comes back to the MAs
// What we’re looking for when price pulls back to the MAs is for it to hold and then show that it is going to continue.
// We look for this continuation signal in terms of a strong, momentumdriven bar.
// 1) – Wait for pullback
// 2) – Enter when momentum comes into market
// 3) – Exit when momentum slows
// When the market has already moved a significant amount that day – Lets not enter in the same direct expecting a further move.

Phicube EMASAR ( EMA Support and Resistance )Indicator based on the Concept created by Bo Williams. But unlike the original that uses MIMAs, EMAs are used here.
Exponential moving averages will be shown according to fractal alignment, in order to show the important support and resistance levels ( SAR ).
When the fractals are aligned to become support,
we will have the EMA in the graph with a bright color.
When the fractals are aligned to become resistance, we will have EMA in the graph with a matte color.
Available exponential moving averages: 17,34,72,144,305,610,1292 and 2584
____________________________________________________//_____________________________________________________________________
Indicador baseado no Conceito criado pelo Bo Williams. Mas diferente do original que utiliza MIMAs, aqui é utilizado EMAs.
As médias móveis exponenciais serão mostradas de acordo com o alinhamento dos fractais, com objetivo de mostrar os níveis importantes
de suporte e resistência( SAR ).
Quando estiver com os fractais alinhados virando suporte, teremos no gráfico a EMA com uma cor em tom brilhante.
Quando estiver com os fractais alinhados virando resistência, teremos no gráfico a EMA com uma cor em tom fosco.
Médias móveis exponenciais disponíveis: 17,34,72,144,305,610,1292 e 2584
