"Divergence" için komut dosyalarını ara
Zigzag Trend/Divergence DetectorPullbacks are always hardest part of the trade and when it happen, we struggle to make decision on whether to continue the trade and wait for recovery or cut losses. Similarly, when an instrument is trending well, it is often difficult decision to make if we want to take some profit off the table. This indicator is aimed to make these decisions easier by providing a combined opinion of sentiment based on trend and possible divergence.
⬜ Process
▶ Use any indicator to find trend bias. Here we are using simple supertrend
▶ Use any oscillator. I have added few inbuilt oscillators as option. Default used is RSI.
▶ Find divergence by using zigzag to detect pivot high/low of price and observing indicator movement difference between subsequent pivots in the same direction.
▶ Combine divregence type, divergence bias and trend bias to derive overall sentiment.
Complete details of all the possible combinations are present here along with table legend
⬜Chart Legend
C - Continuation
D - Divergence
H - Hidden Divergence
I - Indeterminate
⬜ Settings
▶ Zigzag parameters : These let you chose zigzag properties. If you check "Use confirmed pivots", then unconfirmed pivot will be ignored in the table and in the chart
▶ Oscillator parameters : Lets you select different oscillators and settings. Available oscillators involve
CCI - Commodity Channel Index
CMO - Chande Momentum Oscillator
COG - Center Of Gravity
DMI - Directional Movement Index (Only ADX is used here)
MACD - Moving average convergence divergence (Can chose either histogram or MACD line)
MFI - Money Flow Index
MOM - Momentum oscillator
ROC - Rate Of Change
RSI - Relative Strength Index
TSI - Total Strength Index
WPR - William Percent R
BB - Bollinger Percent B
KC - Keltner Channel Percent K
DC - Donchian Channel Percent D
ADC - Adoptive Donchian Channel Percent D ( Adoptive-Donchian-Channel )
▶ Trend bias : Supertrend is used for trend bias. Coloring option color candles in the direction of supertrend. More option for trend bias can be added in future.
▶ Stats : Enables you to display history in tabular format.
Overview of settings present here:
⬜ Notes
Trend detection is done only with respect to previous pivot in the same direction. Hence, if chart has too many zigzags in short period, try increasing the zigzag length or chart timeframe. Similarly, if there is a steep trend, use lower timeframe charts to dig further.
Oscillators does not always make pivots at same bar as price. Due to this some the divergence calculation may not be correct. Hence visual inspection is always recommended.
⬜ Possible future enhancements
More options for trend bias
Enhance divergence calculation. Possible options include using oscillator based zigzag as primary or using close prices based zigzag instead of high/low.
Multi level zigzag option - Can be messy to include more than one zigzag. Option can be added to chose either Level1 or Level2 zigzags.
Alerts - Alerts can only be added for confirmed pivots - otherwise it will generate too many unwanted alerts. Will think about it :)
If I get time, I will try to make a video.

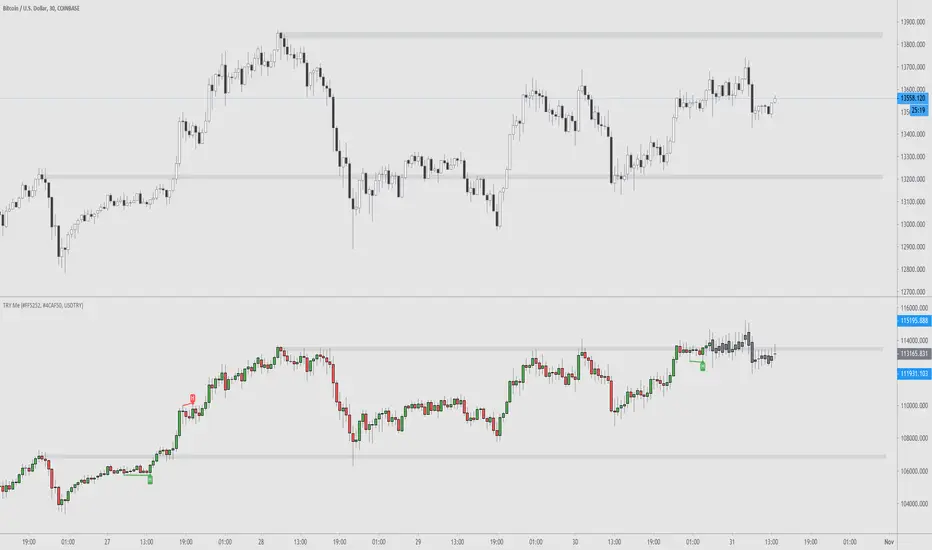
TRY Me - Turkish Lira Quote Currency DivergencesThis is a conceptual indicator that converts the main chart series' quote currency from U.S. dollar to Turkish Lira. Should only be used with USD pairs unless you change the 'Pair' input.
Divergences are created by the difference in price due to the incredible changes in TRY value. The candle colors turn to grey when the forex exchange is closed; this is done to show you that the quote currency value won't change.
Support and resistance levels are also possible to be drawn.
Options to configure are changing the quote pair, colors, and turning the divergences on or off.
Chaikin Oscillator Z-Score With Divergences [MAXmks]Hello Traders,
This is my take on the Chaikin Oscillator — statistically normalized into a Z-Score with built-in divergence detection.
The problem with raw Chaikin
The standard ChO is unbounded and extremely sensitive to volume spikes. A single anomalous bar can flatten the entire oscillator, making it hard to compare signals across time or between instruments.
The fix
Z-Score normalization with asinh (inverse hyperbolic sine) transformation. While standard Z-Scores assume a normal distribution, market data often features "fat tails" (extreme outliers). This transformation compresses those spikes effectively, ensuring the indicator remains responsive without getting stuck during high-volatility events. The result: a more comparable scale across instruments.
What's inside:
Adaptive normalization + EMA-based variance for smooth Z calculation
Regular and hidden divergence detection with segment validation (fewer false signals)
Gradient coloring that intensifies toward extremes
Dashboard with current Z value
Pre-built alerts for OB/OS entries/exits and all divergence types
Note: This is a volume-based indicator. No volume = no signal. If you see "No Volume Data" in the dashboard, switch to a data source that provides volume.
Works on any timeframe. Feedback welcome.
For analysis purposes, not financial advice.

OBV with Volume/Momentum DivergenceCredits go to vyperphi696 and LazyBear for the original OBV with Divergence script.
This indicator has the new option to check for momentum divergence, which I have done by adding RSI and MACD data.
Hence the indicator allows combined testing of volume and momentum divergence. This feature aims to improve trend reversal detection by reducing false positives.
In summary, 3 divergence categories are shown by default as lines:
Volume + RSI + MACD (dark green/red)
Volume + RSI / Volume + MACD (light green/red)
Volume (gray)
Line colors can be adjusted via plot settings. Therefore it is also possible to distinguish Volume + RSI and Volume + MACD divergence if necessary.
Lastly, I edited the indicator scaling mechanism when changing from one timeframe to another; the transitions are smoother now. This only applies when auto-scaling is off.

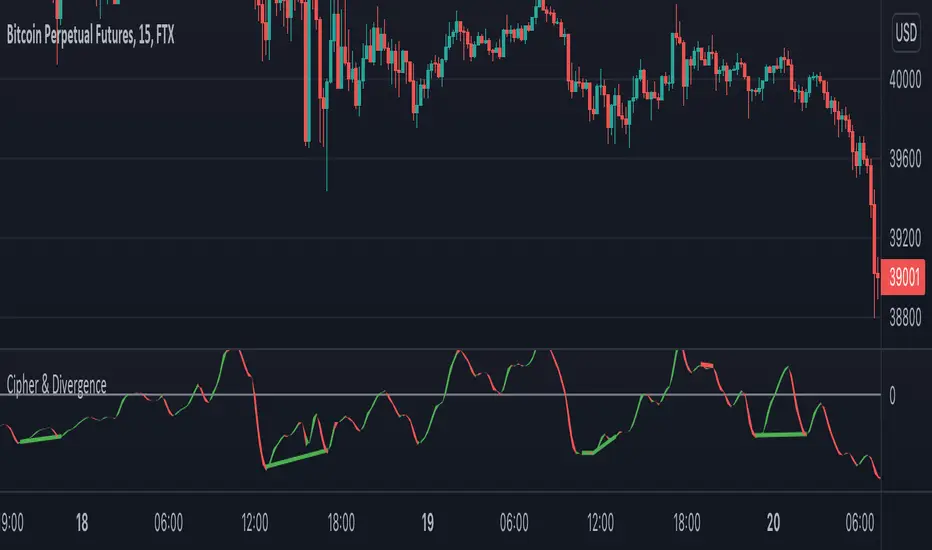
Cipher & DivergenceFor a long time I've been using complicated script with too much informations in it.
In this one I try to have just the bare minimum information to be able to analyse and find a potential reversal zone.
It is inspired from different wave trend / cipher script but has been tuned after months of backtest.
Extending the usage of the wave trend oscillator, which can be used with overbuy & oversell zone it might be better to wait for a confirmation of the movement. This confirmation can be identified by a pull back of the wave trend & price.
We can even confort ourself by waiting for reversal indicators.
Reversal may occurs after a divergence, wait for it, a cross of zero line followed by a PB to find your entry.
You can setup alert on bear / bull divergence but also when the wave trend cross the zero line to never miss a potential trade.
Huge thanks to LazyBear for his wave trend
And thanks vumanchu for his huge cipher script which was very useful for divergence finder
Divergence RSI-OBVDivergence detector on RSI of On Balance Volume. Using a modified script from XaviZ(RSI-VWAP) but instead of VWAP as a source in this script source is OBV, for divergence detector is a script from Libertus. In this version, results are filtered using STOCH oversold or overbought filter from matt_b script MFI Divergence v2.
An indicator for entry in choppy markets, signals for entry in trending market to follow the trend work well. A good way to spot if there is a weakness in a trend but gives too many false positives for spot reversal, so only good for scalping with tight stops if betting against the trend. Multiple divergences in combination with indicator hitting the overbought or oversold should give good places for entry.

OBV with DivergenceAll I did was combine the logic from LazyBear for his OBV Oscillator to regular RSI divergence logic (where I replaced the RSI input to use LazyBear's OBV).
I didn't use any original code! Neither OBV (written by LazyBear) nor DIvergence (author unknown) was written by me. I merely modified the sytax a little to combine them.
Very useful for spotting divergences with OBV oscillator.

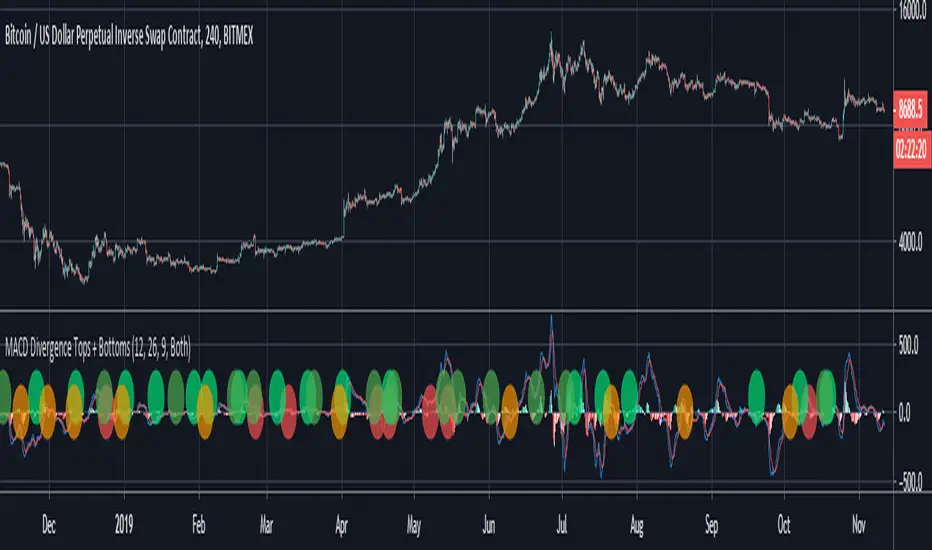
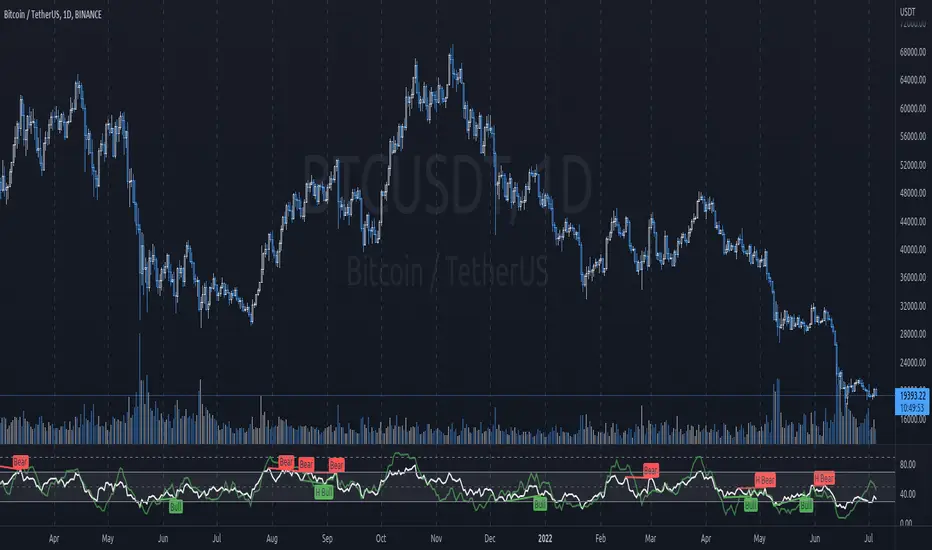
MACD Divergence Tops + BottomsMACD Indicator which plots local peaks and troughs in divergence.
"Classic" Divergence is specified as:
- A higher price, with reduced MACD high --> Potential Sell Point
- A lower price, with higher MACD low --> Potential Buy Point
"Alternative" Divergence is specified as:
- A higher MACD high, with reduced price --> Potential Sell Point
- A lower MACD low, with higher price --> Potential Buy Point
MACD Divergence should be used in combination with other indicators. This indicator identifies local tops and bottoms, with potential for macro trend shifts.
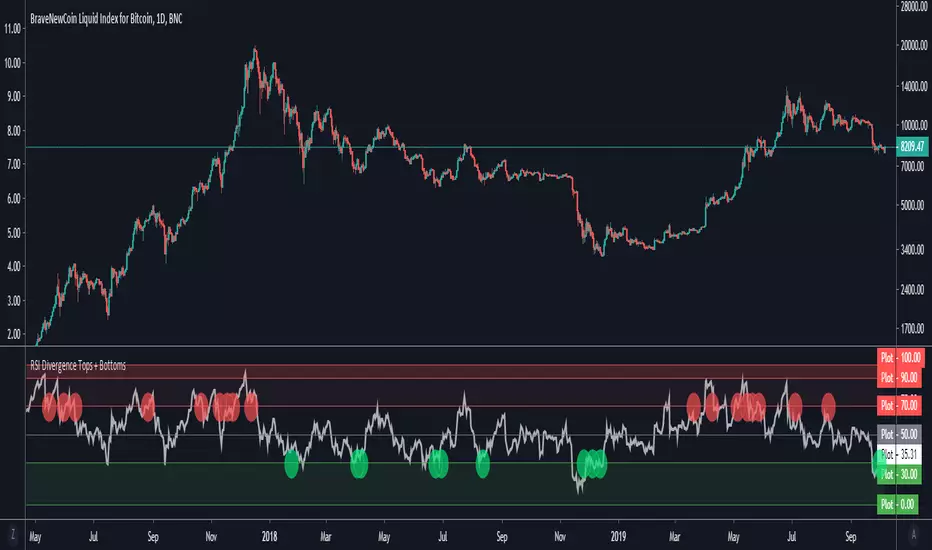
RSI Divergence Tops + BottomsRSI Indicator which plots local peaks and troughs in divergence.
Divergence is specified as:
- A higher price, with reduced RSI --> Potential Sell Point
- A lower price, with higher RSI --> Potential Buy Point
RSI Divergence should be used in combination with other indicators. This indicator identifies local tops and bottoms, with potential for macro trend shifts.
Read more about trading RSI Divergence on Investopedia here: www.investopedia.com
RSI Divergence UltimateHere it is Everyone - What was once hidden is now revealed
This is the Ultimate RSI Divergence Indicator
Not only does it plot Regular and Hidden Divergence lines for an RSI smoothed by an EMA and for its Signal Line
The RSI can be set to change color with direction or can be set as single color with or with out OB / OS highlights
Color Changing RSI helps when trading Multiple Time Frames as you can look for confluence in the direction of RSI
Included options for the Signal Line include;
Various calculations EMA, SMA and Linear Regression which provides very accurate signal line crossover signals
Color Changing with direction
Second RSI with different Length
Multi Time Frame RSI
Bollinger Bands applied to the RSI
RSI Stochastic that has been compressed to fit into RSI OB / OS so that it doesnt compress the RSI when in these regions
There are also Background Highlights (thanks to Chris Moody) for when the RSI Stochastic moves into OB / OS and crosses its signal line
There are plenty of Alerts for signals with more complex alerts coming soon
I have also added Hima Reddy's Power Zones for support and resistance so now you can also
Take full advantage of trading; signal line crosses, 50 crosses and Power Zone RSI support and resistance and much more
The divergence script is thanks to @RicardoSantos, I've just adjusted it to suite my indicator
Remember that divergences work best when traded with the trend or very late in a trend when going against the trend

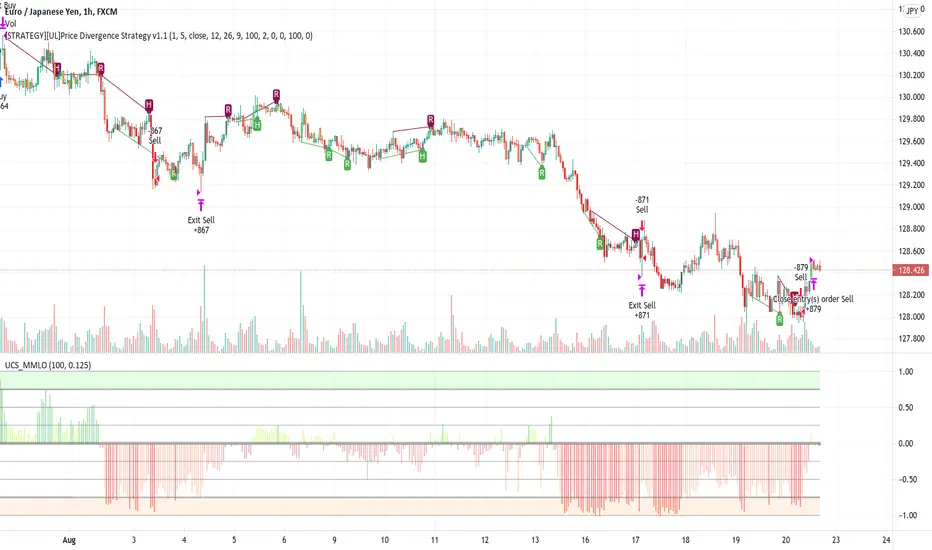
[STRATEGY][UL]Price Divergence Strategy v1.0Created by Request: This is a trend trading strategy that uses Price Divergence detection signals that are confirmed by the "Murrey's Math Oscillator" (Donchanin Channel based).
Strategy Code Based on:
Price Divergence Detector V2 by RicardoSantos
UCS_Murrey's Math Oscillator by Ucsgears
Strategy Risk Management Based on:
Strategy Code Example by JayRogers
Information on Divergence Trading:
- www.babypips.com
*** USE AT YOUR OWN RISK ***
MACD Divergence MultiTimeFrame [FantasticFox]This is a MACD divergence on 3 time-frames, 1h, 4h and 1D.
Please insert the indicator into a 1h chart, otherwise change the lengths' inputs.
you will see H1,H2, H3, R1, R2 and R3 in green and maroon colors.
H means hidden divergence, 1 regards to 1h, 2 to 4h, and 3 to 1D. If the color is green, its bullish, and if its maroon the divergence is bearish.
Gray circles on 4h macd is for those traders who want to check the confirmation on Elliott wave changes.
*Thanks to RicardoSantos MACD divergence.

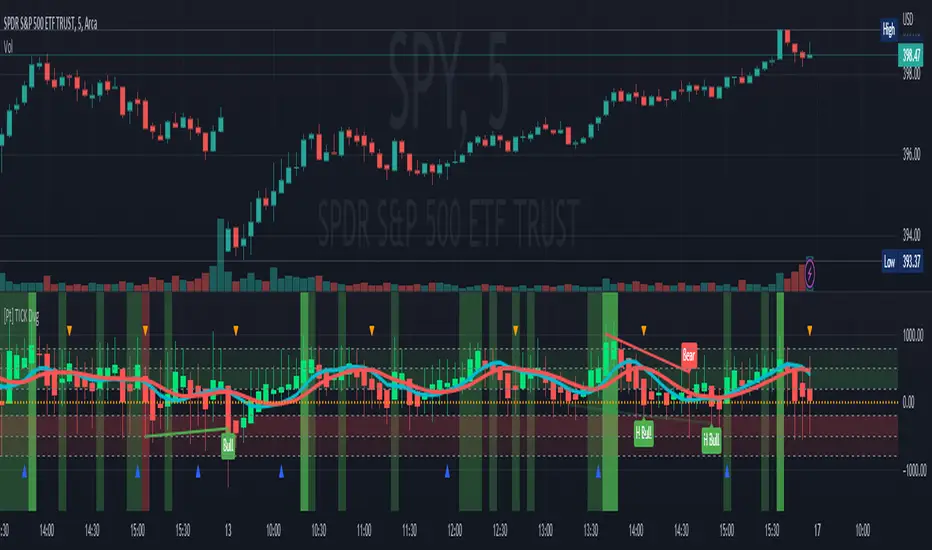
TICK Divergence + Heikin Ashi [Pt]This indicator identifies divergence between NYSE TICK and price, displays TICK in line, bar, or Heikin Ashi format, calculates various types of moving average lines and shows moving average crossovers.
What is TICK
NYSE TICK, also known as the TICK index, is a technical analysis indicator that shows the number of stocks on the New York Stock Exchange (NYSE) that are trading on an uptick or a downtick in a particular period of time. The TICK index is calculated by subtracting the number of stocks trading on a downtick from the number of stocks trading on an uptick. A reading of +1000 on the TICK index, for example, would indicate that there are 1000 more stocks trading on an uptick than on a downtick. The TICK index is often used as a measure of market sentiment, as it can provide insight into whether there is more buying or selling pressure in the market at a given time. A high TICK index reading may suggest that there is strong buying pressure, while a low TICK index reading may indicate that there is more selling pressure in the market.
The TICK index is usually very volatile, so this indicator is best suited for lower timeframes, such as 1 to 5 min charts.
Features
1) Shows bullish, bearish, hidden bullish and hidden bearish divergences
2) Three display modes for TICK data: Line, Bar, Heikin-Ashi
3) Plot various moving average lines and crossovers. Overall background
4) Configurable significant zones. Background colors will change based on closing TICK value.
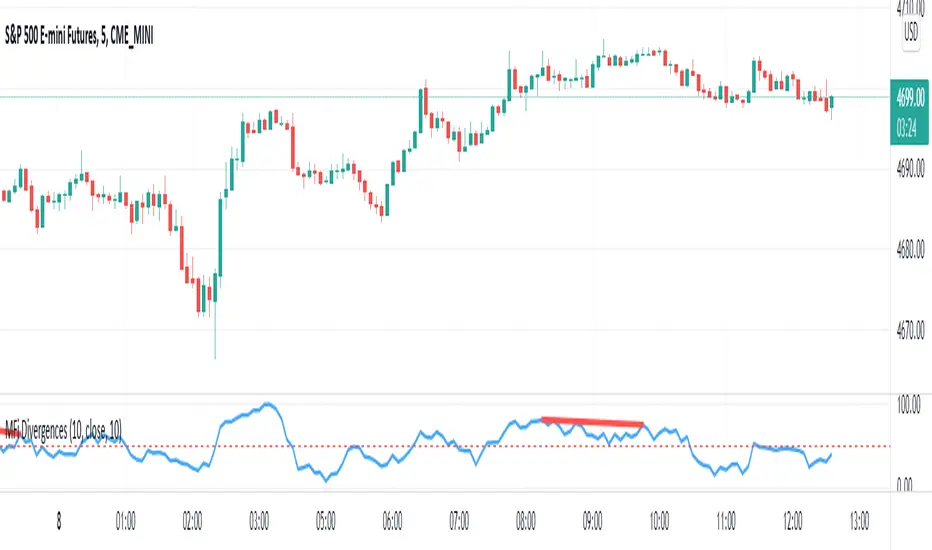
JG RSI/MFI/divergence IndicatorThis is a combination of
- RSI (relative strength index)
- MFI (money flow index)
- Divergences on the RSI
MFI behaves much the same as RSI but it more responsive/to some degree a leading indicator. I find it helps having this overlayed with RSI to help gauge price action and sentiment, as well as for confluence with RSI.
MA Divergences StrategyThis is the Strategy version of the Study I published. It is a Moving Average that can be applied to any plot to plot divergences on any oscillator, as well as perform backtesting. You'll need a REALLY good oscillator to perform live trades using this alone, but I think it is a valuable tool and had the Strategy hanging around and for some reason didn't upload it yet.
So here it is.
Turn Length to 1 to follow the oscillator without lag. Turn Length up if you are getting too many false signals or tweak the original oscillator settings.
Accelerator Oscillator DivergencesDiscover divergences found by the Accelerator Oscillator indicator.

Stochastic RSI DivergencesAdapted from TradingView's RSI Divergences to instead use Stochastic RSI as the oscillator.

Price Convergence DivergenceSimple Price convergence divergence. Current close minus past or in other words lagging price.

RSI Overbought Divergence Indicator with AlertsThis indicator alerts you only if there are divergences after price was oversold or overbought

Uber Oscillator with DivergencesThis is a simple mod of the Uber Oscillator with more periods added to the mix and combined with a the Tradingview Divergence spotter.
Compare it to the standard Ultimate Oscillator and see the difference. Good to even overlay them even.
It basically just adds more detail. You won't always need it but sometimes it can catch big drops/peaks earlier then the standard AO while still retaining relative relaxedness during other periods.

Volume Divergence by MMIt's a simply volume indicator. You should watch for breaks on both volume uptrend and volume downtrend. It uses fibonacci numbers to build smoothed moving average of volume.
Also you can check divergences for trend reversal and momentum loss.

WaveTrend Oscillator + Divergence + Direction Detection +AlertsMake this version of the famous WaveTrend indicator has the following characteristics:
- WaveTrend direction detection
- Customizable overbought and oversold level (set by default just like the original version)
- Possibility to modify the length of the channel (set by default same as the original version)
- Possibility of modifying mobile period (set by default same as the original version)
- Show ONLY overbought sales.
- Show all sales.
- Show ONLY purchases in oversold.
- Show all purchases.
- See histogram.
- See half signal.
- Paint Bars.
- Modification of colors.
Alerts:
The indicator has the following alerts:
- Sales in oversold
- All Sales
- Purchases in oversold
- All Purchases
- Purchases / Overbought sales / Sales
- All Sales / Purchases
- Change WT Direction
NOTE: This single indicator should not be taken as a trading strategy is only a tool for the trader that gives a sense of depth market and potential opportunities for purchase / sale which must be evaluated in the context generally used this indicator to look for positions in areas of overbought / sell, also for detecting differences, other aspects such as the direction of Wavetrend, levels, histogram, etc, also provide useful information.
Release Notes: Add a field to change reaction and color change direction WT, is set to 1 as fast (default), better greater number address filter but is slower.
Release Notes: Add a Hidden Divergences detector and Regulars (bulls and the bears), from setup can activate them, also can turn off the labels and leave only the lines, configure it to your liking.
NOTE: SCRIPT IN SPANISH
