RSI Divergence Overlay with BGRSI Divergence Overlay with Bullish (Green) and Bearish (Red) notations
"Divergence" için komut dosyalarını ara

Capital Rotational Event (CRE)What is a Capital Rotational Event (CRE)?
A Capital Rotational Event is when money shifts from one asset to another — e.g., rotation from stocks into bonds, from tech into commodities, or from one sector into another.
In technical terms it typically shows:
✔ Divergence between two asset price series
✔ Relative strength switching direction
✔ Volume/flow confirming rotation
✔ Often precedes trend acceleration in the “receiver” asset

Price vs CVD Divergence Zones (All Types)This is an indicator which shows the divergence between the running price and the CVD

Zero Lag Moving Average Convergence Divergence (ZLMACD) [EVAI]Zero Lag Moving Average Convergence Divergence (ZLMACD)
ZLMACD is a MACD-style momentum oscillator that keeps the standard MACD structure while adding a practical “zero-lag” option through ZLEMA. It is intended for traders who like the familiar MACD workflow but want an oscillator that can respond earlier during transitions without turning into an overly noisy trigger.
The indicator plots the MACD line, the signal line, and the histogram around a zero baseline. If you already understand MACD, you already understand how to read this. The difference is that you can choose whether the oscillator and signal are driven by EMA, SMA, or ZLEMA, which changes the responsiveness and smoothness of the indicator.
Default behavior
This script defaults to the preset mode “ZLEMA osc + EMA signal.” In this configuration, the fast and slow oscillator averages are computed using ZLEMA, while the signal line remains an EMA of the MACD line. The reason for this mix is simple: ZLEMA tends to reduce lag in the oscillator, while EMA on the signal line helps keep crossovers readable and avoids excessive micro-signals.
In practice, this default preset often behaves like a “faster MACD” that still feels like MACD. It can highlight momentum turns earlier than a traditional EMA MACD while keeping the signal line stable enough to use for timing and confirmation.
Custom mode and MA selection
If you switch Mode to “Custom,” the indicator will use your selected moving average types for both the oscillator and the signal line. In Custom mode, the oscillator type applies to both fast and slow averages, and the signal type applies to the smoothing of the MACD line.
If you are in the default preset mode, the custom MA dropdowns will not change the calculations. This is intentional: the preset locks the MA types so the default behavior remains consistent and reproducible across charts and users.
Reading the indicator
The histogram reflects the distance between the MACD line and the signal line. When the histogram is above zero, the MACD line is above the signal line and momentum is biased upward; when it is below zero, the MACD line is below the signal line and momentum is biased downward. Changes in histogram height help visualize strengthening versus weakening momentum, while the zero baseline provides regime context by indicating whether the fast average is above or below the slow average.
Crossovers between MACD and signal behave exactly as they do in standard MACD, but the timing and “feel” will vary depending on the MA choices. ZLEMA on the oscillator typically makes turns appear earlier; SMA typically smooths more but can be slower; EMA tends to be the balanced baseline.
Alerts
Two alert conditions are included to detect histogram polarity shifts. One triggers when the histogram switches from non-negative to negative, and the other triggers when it switches from non-positive to positive. These are useful if you want simple notifications for momentum regime flips without staring at the chart continuously.
Notes
This indicator is provided for informational and educational purposes only and is not financial advice. Always test settings per instrument and timeframe and use risk management.

RSI Divergence + RSI Indicator MegartCombined RSI Divergence Indicator and RSI.
Highlights important RSI levels 70–80–90 and 30–20–10.
All calculations are always based on standard Japanese candlesticks, even when used on other chart types.

NQ vs ES-RTY-YM Divergence MTF OSOpen source script version for my NQ vs ES-RTY-YM Divergence MTF indicator

PSP 4H USD Divergence Highlighter (EURUSD + GBPUSD vs DXY)PSP indicator for the 4H chart. This compares the divergence between the EURUSD, GBPUSD, & DXY

AI Reversal Signals Custom [wjdtks255]📊 Indicator Overview: AI Reversal Signals Custom
This indicator is a comprehensive trend-following and reversal detection tool. It combines the long-term trend bias of a 200 EMA with highly sensitive RSI-based reversal signals and momentum visualization. It is designed to capture market bottoms and tops by identifying exhaustion points in price action.
Key Features
200 EMA (Trend Filter): A gold line representing the long-term institutional trend. It helps traders distinguish between "buying the dip" and "catching a falling knife."
Reversal Buy/Sell Labels: Real-time signals that appear when the market recovers from extreme overbought or oversold conditions.
Dynamic Background Clouds: Visual indicators of trend strength changes, highlighting potential entry zones.
Momentum Histogram: Internal calculations mimic the "Bottom Bars" seen in professional suites to track the velocity of price movement.
📈 Trading Strategy (How to Trade)
1. High-Probability Long Setup (Buy)
Trend Confirmation: Price should ideally be trading above the 200 EMA for the highest success rate.
Signal: Wait for the "BUY" label to appear below the candle.
Momentum: Confirm with the Light Green background or histogram shift indicating recovery.
Entry: Enter on the close of the signal candle.
2. High-Probability Short Setup (Sell)
Trend Confirmation: Price should ideally be trading below the 200 EMA.
Signal: Wait for the "SELL" label to appear above the candle.
Momentum: Confirm with the Red background or histogram fading from green to red.
Entry: Enter on the close of the signal candle.
3. Risk Management
Stop Loss: Place your Stop Loss slightly below the recent swing low for Buy orders, or above the recent swing high for Sell orders.
Take Profit: Exit when the price reaches a major support/resistance level or when an opposing signal appears.
💡 Professional Tip
For the best results, use this indicator on the 15-minute or 1-hour timeframes. The most powerful "Ultimate Reversal" signals occur when there is a Bullish Divergence (Price making lower lows while the RSI makes higher lows) followed by a confirmed "BUY" label.


RSI + EMA Dynamic Zones + Volume + Divergence (with RSI 50 line)RSI + EMA Dynamic Zones + Volume + Divergence (with RSI 50 line)

Volume Divergence(FULLAUTO)MINHPHUOCKBVolume Divergence( 5 COLOR)
BB50
AUTO TIME
bullishDivergence = color.lime
bearishDivergence =color.red
volSpike =color.rgb
volContraction = color.aqua
incVolTrend =color.new
decVolTrend =color.new
color.rgb

[CASH] Crypto And Stocks Helper (MultiPack w. Alerts)ATTENTION! I'm not a good scripter. I have just learned a little basics for this project, stolen code from other public scripts and modified it, and gotten help from AI LLM's.
If you want recognition from stolen code please tell me to give you the credit you deserve.
The script is not completely finished yet and contains alot of errors but my friends and family wants access so I made it public.
_________________________________________________________________________________
CASH has multiple indicators (a true all-in-one multipack), guides and alerts to help you make better trades/investments. It has:
- Bitcoin Bull Market Support Band
- Dollar Volume
- 5 SMA and 5 EMA
- HODL Trend (a.k.a SuperTrend) indicator
- RSI, Volume and Divergence indicators w. alerts
More to come as well, like Backburner and a POC line from Volume Profile.
Everything is fully customizable, appearance and off/on etc.
More information and explainations along with my guides you can find in settings under "Input" and "Style".

RSI Divergence on 1-Hour with 15min & 5min CorrectionUsing the 15 minute timeframe, rsi divergence on the hourly chart is "tracked" by the 15 and 5 min rsi levels to watch for the hourly chart's rsi correction.

RSI Divergence on Daily with 4hr & 1hr CorrectionRSI Divergence on Daily chart viewed in 4 hr timeframe to identifty 4 hr/1hr rsi corrections inside of the identified, Daily RSI level (source high)

Hidden Bullish Divergence - B166erThis script will paint a line on the chart when hidden bullish divergence is occurring.
Element Squared RSI Divergence IndicatorRSI Divergence indicator developed by the team at Element Squared Private Wealth.

CCI [Hash Adaptive]Adaptive CCI Pro: Professional Technical Analysis Indicator
The Commodity Channel Index is a momentum oscillator developed by Donald Lambert in 1980. CCI measures the relationship between an asset's price and its statistical average, identifying cyclical turns and overbought/oversold conditions. The indicator oscillates around zero, with values above +100 indicating overbought conditions and values below -100 suggesting oversold conditions.
Standard CCI Formula: (Typical Price - Moving Average) / (0.015 × Mean Deviation)
This indicator transforms the traditional CCI into a sophisticated visual analysis tool through several key enhancements:
Implements dual exponential moving average smoothing to eliminate market noise
Preserves signal integrity while reducing false signals
Adaptive smoothing responds to market volatility conditions
Dynamic Color Visualization System
Continuous gradient transitions from red (bearish momentum) to green (bullish momentum)
Real-time color intensity reflects momentum strength
Eliminates discrete color jumps for fluid visual interpretation
Adaptive Intelligence Features
Dynamic overbought/oversold thresholds adapt to market conditions
Reduces false signals during high volatility periods
Maintains sensitivity during low volatility environments
Momentum Vector Analysis
Incorporates velocity calculations for early trend identification
Crossover detection with momentum confirmation
Advanced signal filtering reduces market noise
Extreme Level Analysis
Values above +100: Strong overbought conditions, potential reversal zones
Values below -100: Strong oversold conditions, potential buying opportunities
Zero-line crossovers: Momentum shift confirmation
Optimization Parameters
CCI Period (Default: 14)
Shorter periods (10-12): Increased sensitivity, more signals
Standard periods (14-20): Balanced responsiveness and reliability
Longer periods (21-30): Reduced noise, stronger signal confirmation
Smoothing Factor (Default: 5)
Lower values (1-3): Maximum responsiveness, suitable for scalping
Medium values (4-6): Balanced approach for swing trading
Higher values (7-10): Institutional-grade smoothness for position trading
Signal Sensitivity (Default: 6)
Conservative (7-10): High-probability signals, reduced frequency
Balanced (5-6): Optimal risk-reward ratio
Aggressive (1-4): Maximum signal generation, requires additional confirmation
Strategic Implementation
Oversold reversals in red zones with momentum confirmation
Zero-line breaks with sustained color transitions
Extreme readings followed by momentum divergence
Risk Management
Use extreme levels (+100/-100) for position sizing decisions
Monitor color intensity for momentum strength assessment
Combine with price action analysis for comprehensive market view
Market Context Application
Trending markets: Focus on momentum direction and extreme readings
Range-bound markets: Utilize overbought/oversold levels for mean reversion
Volatile markets: Increase smoothing parameters and signal sensitivity
Professional Advantages
Instantaneous momentum assessment through color visualization
Reduced cognitive load compared to traditional oscillators
Professional presentation suitable for client reporting
Adaptive Technology
Self-adjusting parameters reduce manual optimization requirements
Consistent performance across varying market conditions
Advanced mathematics eliminate common CCI limitations
The Adaptive CCI Pro represents the evolution of momentum analysis, combining Lambert's foundational CCI concept with modern computational techniques to deliver institutional-grade market intelligence through an intuitive visual interface.

Cumulative Volume Delta Divergence Periodic EMACumulative Volume Delta Divergence Periodic EMA
extended indicator
JNGO - Moving Average Convergence DivergenceMACD Script Im testing out among friends for Moving Average Convergence Divergence
RSI Cloud v1.0 [PriceBlance] RSI Cloud v1.0 — Ichimoku-style Cloud on RSI(14), not on price.
Recalibrated baselines: EMA9 (Tenkan) for speed, WMA45 (Kijun) for stability.
Plus ADX-on-RSI to grade strength so you know when momentum persists or fades.
1. Introduction
RSI Cloud v1.0 applies an Ichimoku Cloud directly on RSI(14) to reveal momentum regimes earlier and cleaner than price-based views. We replaced Tenkan with EMA9 (faster, more responsive) and Kijun with WMA45 (slower, more stable) to fit a bounded oscillator (0–100). Forward spans (+26) and a lagging line (−26) provide a clear framework for trend bias and transitions.
To qualify signals, the indicator adds ADX computed on RSI—highlighting whether strength is weak, strong, or very strong, so you can decide when to follow, fade, or stand aside.
2. Core Mapping (Hook + Bullets)
At a glance: Ichimoku on RSI(14) with recalibrated baselines for a bounded oscillator.
Source: RSI(14)
Tenkan → EMA9(RSI) (fast, responsive)
Kijun → WMA45(RSI) (slow, stable)
Span A: classic Ichimoku midline, displaced +26
Span B: classic Ichimoku baseline, displaced +26
Lagging line: RSI shifted −26
3. Key Benefits (Why traders care)
Momentum regimes on RSI: position vs. Cloud = bull / bear / transition at a glance.
Cleaner confirmations: EMA9/WMA45 pairing cuts noise vs. raw 30/70 flips.
Earlier warnings: Cloud breaks on RSI often lead price-based confirmations.
4. ADX on RSI (Enhanced Strength Normalization)
Grade strength inside the RSI domain using ADX from ΔRSI:
ADX ≤ 20 → Weak (transparency = 60)
ADX ≤ 40 → Strong (transparency = 15)
ADX > 40 → Very strong (transparency = 0)
Use these tiers to decide when to trust, fade, or ignore a signal.
5. How to Read (Quick rules)
Bias / Regime
Bullish: RSI above Cloud and RSI > WMA45
Bearish: RSI below Cloud and RSI < WMA45
Neutral / Transition: all other cases
6. Settings (Copy & use)
RSI Length: 14 (default)
Tenkan: EMA9 on RSI · Kijun: WMA45 on RSI
Displacement: +26 (Span A/B) · −26 (Lagging)
Theme: PriceBlance Dark/Light
Visibility toggles: Cloud, Baselines, Lagging, labels/panel, Overbought/Oversold, Divergence, ADX-on-RSI (via transparency coloring)
7. Credits & License
Author/Brand: PriceBlance
Version: v1.0 (Free)
Watermark: PriceBlance • RSI Cloud v1.0
Disclaimer: Educational content; not financial advice.
8. CTA
If this helps, please ⭐ Star and Follow for updates & new tools.
Feedback is welcome—comment what you’d like added next (alerts, presets, visuals).

icreature RSI Divergence Indicator with Customizable OB/OS Spotsicreature RSI Divergence Indicator with Customizable OB/OS Spots
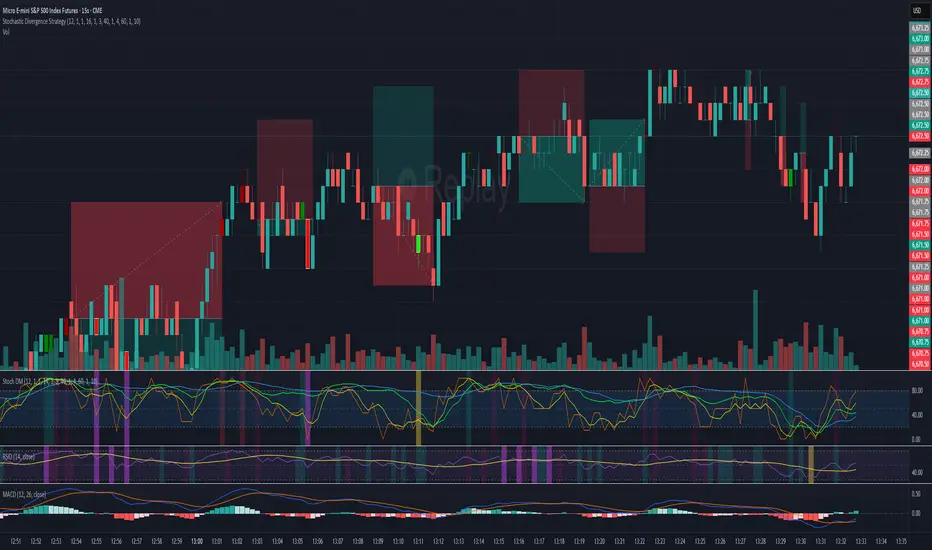
Stochastic Divergence Indicatorshows bullish and bearish divergence with green and red candles. white border for double dip
MACD Bullish Divergence + Multi-TF RSI Buy SignalsNew script to overlap MACD Bullish Divergence and RSI signals to give confluence.
