Normalized RSI Oscillator with DivergencesNormalized RSI with Divergences {A Next-Level Trading Tool}
The Normalized RSI with Divergences indicator is a powerful and innovative tool designed to enhance your trading precision. By normalizing the Relative Strength Index (RSI) and detecting divergences between the standard and normalized RSI, this script helps traders identify potential trend reversals and continuations with remarkable clarity.
Key Features
🔹 Advanced RSI Normalization
• Transforms the traditional RSI into a normalized range of , making overbought and oversold conditions more intuitive.
• Utilizes a dynamic lookback period to adapt to market conditions.
🔹 Divergence Detection for Smarter Trading
• Identifies Bullish, Hidden Bullish, Bearish, and Hidden Bearish divergences by analyzing RSI pivot points.
• Provides early signals of trend reversals and continuations for better trade execution.
🔹 Clear & Visual Trade Signals
• Divergences are automatically labeled on the chart:
o Bullish Divergence: 🟢 “Bull” (Green) – Possible upward reversal.
o Hidden Bullish Divergence: 🟢 “Hid.” (Lime) – Continuation of an uptrend.
o Bearish Divergence: 🔴 “Bear” (Red) – Possible downward reversal.
o Hidden Bearish Divergence: 🟠 “Hid.” (Orange) – Continuation of a downtrend.
🔹 Fully Customizable Inputs
• Adjust RSI period, normalization lookback, and divergence parameters to fit your strategy.
• Tailor the indicator to your preferred trading style and market conditions.
________________________________________
How It Works
🔹 RSI Normalization Formula:
Norm=2×(RSI−MinMax−Min)−1\text{Norm} = 2 \times \left(\frac{\text{RSI} - \text{Min}}{\text{Max} - \text{Min}}\right) - 1Norm=2×(Max−MinRSI−Min)−1
• Min & Max represent the lowest and highest RSI values over the selected lookback period.
🔹 Divergence Detection Process:
• Identifies pivot points in both the normalized RSI and the standard RSI.
• Compares their directions to detect potential trading signals.
🔹 Real-Time Chart Labeling:
• Uses label.new to visually highlight divergence points for quick and efficient decision-making.
________________________________________
Input Parameters
• Source: Price source for RSI calculation (Default: hlc3).
• Signal Period: RSI calculation period (Default: 50).
• Lookback Range: Normalization period (Default: 200, Max: 5000).
• Trend Length: Smoothing period for normalized RSI (Default: 5).
• Band Width: Center line & bands calculation period (Default: 34).
• Divergence Range: Lookback period for divergence detection (Default: 5).
________________________________________
How to Use
1. Add the script to your trading chart.
2. Customize the settings to match your trading approach.
3. Watch for divergence labels to identify potential market moves:
o 🟢 Bullish Divergence: Possible upward reversal.
o 🟢 Hidden Bullish Divergence: Continuation of an uptrend.
o 🔴 Bearish Divergence: Possible downward reversal.
o 🟠 Hidden Bearish Divergence: Continuation of a downtrend.
________________________________________
Why Use This Indicator?
✅ Enhanced RSI Analysis: Normalization simplifies overbought/oversold conditions.
✅ Crystal-Clear Divergence Signals: Instantly spot key trend shifts.
✅ Fully Customizable: Adjust settings for your specific strategy.
✅ Improve Trade Accuracy: Gain an edge with precise divergence detection.
________________________________________
⚠️ Disclaimer
This script is for educational and informational purposes only. It does not constitute financial advice. Always conduct thorough research and backtesting before using it in live trading.
📜 License
This script is released under the Mozilla Public License 2.0.
Enjoy the Normalized RSI with Divergences indicator, and happy trading! 🚀📈
— Kerem Ertem
"Divergence" için komut dosyalarını ara

Market Breadth Toolkit [LuxAlgo]The Market Breadth Toolkit allows traders to use up to 6 different market breadth measures on two different exchanges, for a total of 12 different views of the market.
This toolkit includes divergence detection and allows setting custom fixed levels for traders who want to experiment with them.
🔶 USAGE
The main idea behind Breadth is to measure the number of advancing and declining issues and/or volume by exchange to have an idea of the underlying strength of the whole exchange.
On the other hand, thrusts represent big impulses in the breadth, as it is described by technicians to be the start of a new bullish trend.
By default, the Toolkit is set to "Breadth Thrust Zweig", with divergences enabled.
We will now explain all the different breadth measures available in the toolkit.
🔹 Deemer Breakaway Momentum
The "Breakaway Momentum" is a concept related to market breadth introduced by legendary technical analyst Walter Deemer.
As stated on his website:
We coined the term "breakaway momentum" in the 1970's to describe this REALLY powerful upward momentum
and:
We now know that the stock market generates breakaway momentum when the 10-day total advances on the NYSE are greater than 1.97 times the 10-day total NYSE declines OR the 20-day total advances on the NYSE are greater than 1.72 times the 20-day total NYSE declines.
As we can see in the chart above, which shows both methods, momentum is identified when the ratio of advancing issues to declining issues is greater than 1.97 for the 10-day average or 1.72 for the 20-day average.
🔹 Zweig Breadth Tools
Legendary trader and author Marting Zweig, best known as the author of "Winning on Wall Street" and the creator of the Put/Call Ratio.
In this toolkit, we feature two of his other tools:
Breadth Thrust: Number of Advancing / (Number of Advancing + Number of Declining Stocks)
Market Thrust: (Number of Advancing × Advancing Volume) — (Number of Declining Stocks × Declining Volume)
As we can see on the above chart, the Breadth Thrust printed a new signal on April 24, 2025, which is a bullish signal on the daily chart that can last several months, considering the previous signals.
On the right side, we have the Market Thrust as the delta between advancing minus declining volume weighted.
🔹 Whaley Measures
Wayne Whaley received the 2010 Charles Dow Award from the CMT Association, as stated on their website: "In 1994, the CMT Association established the Charles H. Dow Award to recognize outstanding research in technical analysis."
We include two of the tools from this paper:
Advance Decline Thrust: Number of Advancing / (Number of Advancing + Number of Declining Stocks)
Up/Down Volume Thrust Advancing Volume / (Advancing Volume + Declining Volume)
The chart above shows Thrust signals at extreme readings as described in the paper.
🔹 Divergences
The divergence detector is enabled by default, traders can disable it and fine-tune the detection length in the settings panel.
🔹 Fixed Levels
Traders can adjust the Thrust detection thresholds in the settings panel.
In the image above, we can see the Deemer Breakaway Momentum 10 with the original threshold (below) and with the 3.0 threshold (above).
🔶 SETTINGS
Breadth: Choose between 6 different breadth thrust measurement methods.
Data: Choose between NYSE or NASDAQ exchanges.
Divergences: Enable/Disable divergences and select the length detection.
🔹 Levels
Use Fixed Levels: Enable/Disable Fixed Levels.
Top Level: Select the top-level threshold.
Bottom Level: Select bottom level threshold.
Levels Style: Choose between dashed, dotted, or solid style.
🔹 Style
Breadth: Select breadth colors
Divergence: Select divergence colors

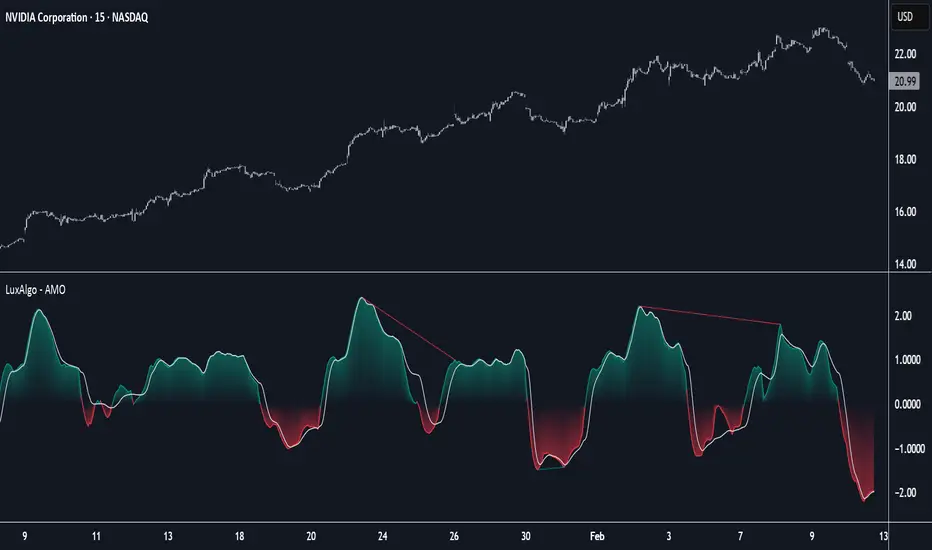
Adaptive Momentum Oscillator [LuxAlgo]The Adaptive Momentum Oscillator tool allows traders to measure the current relative momentum over a given period using the maximum delta in price.
It features a histogram with gradient color, divergences, and an adaptive moving average that allows traders to clearly see the smoothed trend direction.
🔶 USAGE
This unbounded oscillator has positive momentum when values are above 0 and negative momentum when values are below 0. The adaptive moving average is used as a minimum lag smoothing tool over the momentum histogram.
🔹 Signal Line
There are two main uses for the signal line drawn on the chart above.
Momentum crosses above or below the signal line: acceleration in momentum.
Signal line crosses the 0 value: positive or negative momentum.
🔹 Data Length
On the chart above, we can compare different length sizes and how the tool values change, allowing traders to get a shorter or longer-term view of current market strength.
🔹 Smoothing Length
In the previous figure, we can compare how different Smoothing Length values affect the oscillator output.
🔹 Divergences
The divergence detector is disabled by default. Traders can enable it and adjust the divergence length from the settings panel.
As we can see in the chart above, by changing the length of the divergences, traders can fine-tune their detection, a small number will detect smaller divergences, and use a larger number for larger divergences.
🔶 SETTINGS
Data: Select data source, close price by default
Data Length: Select the length for data gathering
Smoothing Length: Select the length for data smoothing
Divergences: Enable/Disable divergences detection and length
Weighted Oscillator Convergence DivergenceThe Weighted Oscillator Convergence Divergence (WOCD) aims to help traders identify potential trend reversals or momentum shifts in financial markets by calculating and visualizing the difference between a smoothed oscillator (WMA) value and its exponential moving average (EMA) and simple moving average (SMA) counterparts. This indicator is particularly useful for traders who want an alternative perspective on price momentum and divergence.
Key Features:
Inputs:
Length: The user can specify the number of bars to consider for calculations (default is 9).
Smoothing 1: Defines the smoothing factor for the first smoothed value (default is 5).
Smoothing 2: Specifies the smoothing factor for the second smoothed value (default is 7).
Ma Type: There are three types of moving averages you can choose (Wilder, non-lag, Weighted is by default).
Color Settings: Users can customize the indicator's colors for various elements, such as length, smoothing values, and different sections of the histogram.
Calculation:
WOCD calculates the raw oscillator value by subtracting the close price from a 3-period High, Low, Close (HLC3) moving average.
It then applies smoothing to this raw oscillator value using two different methods: exponential moving average (EMA) and simple moving average (SMA) with user-defined smoothing periods.
Histogram Plot:
The indicator plots a histogram based on the difference between the smoothed oscillator and the first smoothed value.
When the histogram is above zero and rising, it is colored according to the "Above Grow" color setting. When it's above zero and falling, it uses the "Fall" color for visualization.
Similarly, when the histogram is below zero and rising, it is colored according to the "Below Grow" color setting, and when it's below zero and falling, it uses the "Fall" color.
Oscillator and Smoothed Values:
The indicator also plots the smoothed oscillator, smoothed value 1 (EMA-based), and smoothed value 2 (SMA-based) on the chart.
Zero Line:
A horizontal line at zero is drawn on the chart for reference.
How to Use the WOCD Indicator:
Trend Identification: Observe the histogram's direction and color. A rising histogram above zero may indicate bullish momentum, while a falling histogram below zero could signal bearish momentum.
Divergence: Look for divergences between price action and the histogram. When the histogram and price move in opposite directions, it can be a potential reversal signal.
Crossovers: Pay attention to crossovers between the smoothed oscillator and its smoothed counterparts (EMA and SMA). These crossovers can indicate changes in trend strength or direction.
Zero Line: The zero line can act as a reference point. Positive histogram values suggest bullish sentiment, while negative values indicate bearish sentiment.
Comparison to MACD Indicator:
The WOCD indicator shares some similarities with the Moving Average Convergence Divergence (MACD) indicator but also has distinct differences:
Similarities:
Both WOCD and MACD are momentum oscillators designed to identify potential trend reversals and divergences.
They use moving averages (EMA in the case of MACD) to smooth the raw oscillator values.
Both indicators provide histogram representations of the difference between the oscillator and its smoothed counterpart.
Differences:
WOCD uses a 3-period High, Low, Close (HLC3) moving average to calculate the raw oscillator value, whereas MACD uses the difference between two exponential moving averages (usually 12-period and 26-period EMAs).
The smoothing in WOCD employs both EMA and SMA, while MACD exclusively uses EMA.
WOCD allows users to customize colors for various elements, enhancing visual clarity.

RSI Mansfield +RSI Mansfield+ – Adaptive Relative Strength Indicator with Divergences
Overview
RSI Mansfield+ is an advanced relative strength indicator that compares your instrument’s performance against a configurable benchmark index or asset (e.g., Bitcoin Dominance, S&P 500). It combines Mansfield normalization, adaptive smoothing techniques, and automatic detection of bullish and bearish divergences (regular and hidden), delivering a comprehensive tool for assessing relative strength across any market and timeframe.
Originality and Motivation
Unlike traditional relative strength scripts, this indicator introduces several distinctive improvements:
Mansfield Normalization: Scales the ratio between the asset and the benchmark relative to its moving average, transforming it into a normalized oscillator that fluctuates around zero, making it easier to spot outperformance or underperformance.
Adaptive Smoothing: Automatically selects whether to use EMA or SMA based on the market type (crypto or stocks) and timeframe (intraday, daily, weekly, monthly), avoiding manual configuration and providing more robust results under varying volatility conditions.
Divergence Detection: Identifies four types of divergences in the Mansfield oscillator to help anticipate potential reversal points or trend confirmations.
Multi-Market Support: Offers benchmark selection among major crypto and global stock indices from a single input.
These enhancements make RSI Mansfield+ more practical and powerful than conventional relative strength scripts with static benchmarks or without divergence capabilities.
Core Concepts
Relative Strength (RS): Compares price evolution between your asset and the selected benchmark.
Mansfield Normalization: Measures how much the RS deviates from its historical moving average, expressed as a scaled oscillator.
Divergences: Detects regular and hidden bullish or bearish divergences within the Mansfield oscillator.
Timeframe Adaptation: Dynamically adjusts moving average lengths based on timeframe and market type.
How It Works
Benchmark Selection
Choose among over 10 indices or market domains (BTC Dominance, ETH Dominance, S&P 500, European indices, etc.).
Ratio Calculation
Computes the price-to-benchmark ratio and smooths it with the adaptive moving average.
Normalization and Scaling
Transforms deviations into a Mansfield oscillator centered around zero.
Dynamic Coloring
Green indicates relative outperformance, red signals underperformance.
Divergence Detection
Automatically identifies bullish and bearish (regular and hidden) divergences by comparing oscillator pivots against price pivots.
Baseline Reference
A clear zero line helps interpret relative strength trends.
Usage Guidelines
Benchmark Comparison
Ideal for traders analyzing whether an asset is outperforming or lagging its sector or market.
Divergence Analysis
Helps detect potential reversal or continuation signals in relative strength.
Multi-Timeframe Compatibility
Can be applied to intraday, daily, weekly, or monthly charts.
Interpretation
Oscillator >0 and green: outperforming the benchmark.
Oscillator <0 and red: underperforming.
Bullish divergences: potential relative strength reversal to the upside.
Bearish divergences: possible loss of momentum or reversal to the downside.
Credits
The concept of Mansfield Relative Strength is based on Stan Weinstein’s original work on relative performance analysis. This script was built entirely from scratch in TradingView Pine Script v6, incorporating original logic for adaptive smoothing, normalized scaling, and divergence detection, without reusing any external open-source code.

CVD Divergence Insights📘 CVD Divergence Insights – by Colicoid
Pine Script v6 | Volume Delta Divergence Oscillator with Spike Detection
⸻
🔍 Overview
CVD Divergence Insights is a volume-aware oscillator and divergence spike detector that helps you spot smart money activity, absorption, failed pressure, and hidden strength or weakness — even when price action alone gives little away.
It works by comparing normalized Cumulative Volume Delta (CVD) against normalized price movement, and optionally applying a volume-weighting layer to highlight when aggressive participation is truly behind the divergence. The result is a dynamic visual tool that identifies tension in the market, and helps you trade based on how that tension resolves.
⸻
🧠 Core Concept
• When price moves one way and CVD moves another, it reflects imbalance between aggression and result.
• Divergence is not a trigger — it’s a build-up of pressure.
• The real edge lies in the resolution of that pressure.
• Optional volume-weighting helps you ignore noise and focus on high-conviction moves only.
⸻
⚙️ How It Works
1. CVD Calculation
CVD is generated using lower-timeframe delta volume (buy vs. sell pressure), accumulated per bar.
2. Oscillator
A normalized divergence between the smoothed CVD and smoothed price.
3. Volume Weighting (optional)
Emphasizes divergences occurring on higher-than-normal volume, deprioritizes low-volume noise.
4. Signal Line (optional)
A short EMA of the oscillator to help track momentum shifts (hidden by default).
5. Divergence Spikes
Statistical spike detection using standard deviation — green/red dots highlight unusually large divergence activity.
⸻
🎛️ Inputs
Anchor Period
Higher timeframe where the CVD is accumulated and processed.
Lower Timeframe
Optional override for granularity of buy/sell volume data.
SMA Length
Used for smoothing both price and CVD before divergence is calculated.
Volume Weighted?
Enables adaptive weighting based on relative volume size.
Volume Normalization Length
Lookback period used to define what is “normal” volume.
Divergence Spike Threshold
StdDev-based threshold to detect abnormally large divergences.
Signal Line Length
Controls the EMA smoothing of the optional signal line (hidden by default).
⸻
📈 Trade Setup Example: Hidden Bullish Divergence
1. Price forms a higher low, but CVD forms a lower low — hidden bullish divergence.
2. This shows aggressive sellers are trying, but price is resilient — likely absorption.
3. You wait for a "convergent signal bar":
• A bullish candle with strong structure or body
• Confirmed by CVD starting to turn upward
4. That’s your trigger bar — the tension resolves upward.
⸻
🤝 Recommended Pairings
For best results, combine CVD Divergence Insights with the companion script:
🔗 Cumulative Volume Delta Line (also by Colicoid)
This lets you:
• See the raw CVD line and its SMA visually
• Spot standard and hidden divergences in price/CVD directly
• Use the Insights indicator to evaluate divergence quality and flag aggressive bull/bear behavior
• Use the same SMA length on both indicators for alignment
👉 Tip: To save screen space, drag the CVD Line indicator into the same panel as CVD Divergence Insights.
⸻
🧰 Why Use This?
• ✅ Catch absorption setups and failed pressure zones
• ✅ Filter out low-quality divergences using volume context
• ✅ Understand why price is hesitating or breaking out
• ✅ Add smart confirmation to breakout/reversal trades
• ✅ Align your execution with who’s actually in control
⸻
📎 Created by Colicoid
Built in Pine Script v6 for advanced price-volume analysis, with focus on effort vs result, market psychology, and smart money detection.

Advanced Divergence IndicatorAdvanced Divergence Indicator
Unlock the full potential of your trading strategy with the Advanced Divergence Indicator, a powerful tool designed to identify and analyze bullish and bearish divergences using multiple technical indicators. Whether you're a seasoned trader or just starting out, this indicator provides clear, actionable signals to help you make informed trading decisions.
What It Does
The Advanced Divergence Indicator detects divergences between price movements and key technical indicators, specifically the Relative Strength Index (RSI) and On-Balance Volume (OBV). Divergence occurs when the price trends in one direction while the indicator trends in the opposite direction, signaling potential reversals or continuations in the market.
Key Features
Multi-Indicator Analysis
RSI Divergence: Identifies bullish and bearish divergences using the RSI, helping you spot potential reversals based on momentum.
OBV Divergence: Utilizes OBV to detect divergences related to volume flow, providing insights into the strength behind price movements.
Bullish and Bearish Signals
Bullish Divergence: Signals when indicators show higher lows while the price forms lower lows, suggesting a potential upward reversal.
Bearish Divergence: Alerts when indicators display lower highs while the price creates higher highs, indicating a possible downward reversal.
Signal Strength Classification
Standard Signals: Represent typical divergence occurrences, marked with green (bullish) and red (bearish) labels.
Strong Signals: Highlighted with yellow (strong bullish) and blue (strong bearish) labels when divergences coincide with overbought or oversold conditions, enhancing signal reliability.
Customizable Settings
Indicator Selection: Choose to enable RSI, OBV, or both based on your trading preferences.
Pivot Points: Adjust the number of bars left and right to fine-tune pivot detection for more accurate divergence identification.
Range Configuration: Set minimum and maximum bar ranges to control the sensitivity of divergence detection, suitable for different timeframes and trading styles.
Noise Cancellation: Reduce false signals by enabling noise filtering, ensuring that only significant divergences are highlighted.
Visual Clarity
Color-Coded Labels: Easily distinguish between different types of divergences with intuitive color codes—green for bullish, red for bearish, yellow for strong bullish, and blue for strong bearish signals.
Clean Chart Display: The indicator overlays seamlessly on your chart without clutter, ensuring that signals are easily identifiable without distracting from price action.
Real-Time Alerts
Custom Alert Conditions: Receive instant notifications for bullish and bearish divergences, enabling you to act promptly on potential trading opportunities.
Combined Alerts: Get alerts for either bullish or bearish signals, or both, based on your selected criteria.
How to Use
Add the Indicator to Your Chart
Apply the Advanced Divergence Indicator to your desired chart and timeframe.
Configure Settings
Select Indicators: Choose to enable RSI, OBV, or both under the "Indicator Settings" group.
Adjust Parameters: Customize RSI length, pivot points, and divergence ranges to match your trading strategy and the specific asset you are analyzing.
Enable Noise Cancellation: Activate this feature to filter out minor divergences and focus on more significant signals.
Interpret the Signals
Bullish Signals: Look for green or yellow labels below the price bars indicating potential upward reversals.
Bearish Signals: Identify red or blue labels above the price bars signaling possible downward reversals.
Strong Signals: Pay special attention to yellow and blue labels as they denote stronger divergences with higher reliability.
Set Up Alerts
Configure alert conditions within the indicator to receive real-time notifications when bullish or bearish divergences are detected, ensuring you never miss a trading opportunity.
Why Choose Advanced Divergence Indicator
Comprehensive Analysis : By combining RSI and OBV, the indicator provides a more robust analysis compared to single-indicator tools, enhancing the accuracy of divergence detection.
Flexibility : Highly customizable settings allow traders to tailor the indicator to their unique strategies and market conditions.
User-Friendly : Clear labels and color codes make it easy for traders of all levels to understand and act on the signals.
Reliability : Strong signal classification and noise cancellation features help reduce false positives, providing more trustworthy trading signals.

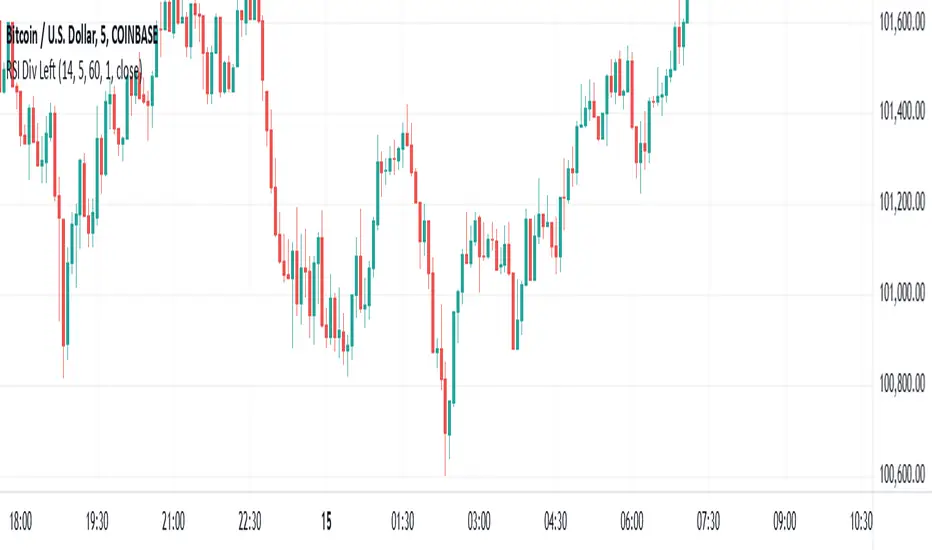
RSI Divergence - Left Candles Onlyrsi
The **RSI Divergence** indicator in this script is designed to highlight **divergence** between the **Relative Strength Index (RSI)** and **price action** on a chart. Divergence can be a key signal for potential trend reversals or continuation in technical analysis.
### **Key Components of the Indicator:**
1. **RSI Calculation:**
- The **Relative Strength Index (RSI)** is calculated using a typical 14-period length, but the user can customize this input.
- RSI is a momentum oscillator that measures the speed and change of price movements, oscillating between 0 and 100. Values above 70 indicate overbought conditions, and values below 30 indicate oversold conditions.
2. **Divergence Logic:**
- **Bullish Divergence:** Occurs when the price forms a **lower low**, but the RSI forms a **higher low**. This suggests that despite price continuing to drop, momentum (RSI) is strengthening, which may indicate a potential price reversal to the upside.
- **Bearish Divergence:** Occurs when the price forms a **higher high**, but the RSI forms a **lower high**. This indicates that even though price is rising, the momentum (RSI) is weakening, which could signal a price reversal to the downside.
3. **Pivot Identification:**
- The script identifies **pivot points** (local highs and lows) on both price and RSI.
- **Bullish Divergence:** A lower price low with a higher RSI low.
- **Bearish Divergence:** A higher price high with a lower RSI high.
4. **Lookback Periods:**
- **Lookback Left (lookbackLeft):** Defines the number of bars to look back for pivot confirmation. This allows for adjusting the sensitivity of the divergence.
- The **divergence range** is constrained by two parameters:
- **Minimum range (rangeLower):** The minimum number of bars for divergence to be considered.
- **Maximum range (rangeUpper):** The maximum number of bars for divergence to be considered.
5. **Signal Generation and Plotting:**
- When a **bullish divergence** is detected, a **green label** is plotted below the bar where the divergence occurs.
- When a **bearish divergence** is detected, a **red label** is plotted above the bar.
- The script uses **`plotshape()`** to plot these labels on the chart.
6. **Alerts:**
- Alerts are configured for both **bullish** and **bearish divergences** so that you can be notified when a divergence signal occurs.
---
### **How the Indicator Works:**
- The RSI and price action are compared using **pivots**: The script checks whether the price and RSI are forming new highs or lows within the specified **lookback period**.
- If the conditions for divergence (higher/lower RSI pivot vs price pivot) are met, a signal is plotted on the chart.
- The script helps to visually identify potential reversal points and allows users to set alerts for these divergence signals.
---
### **Use Case:**
- This script is useful for traders looking to trade potential trend reversals based on **divergence** between price and RSI.
- **Bullish divergence** can indicate a **buy** opportunity, while **bearish divergence** can suggest a **sell** opportunity.
- The indicator works best in **volatile markets** and when combined with other technical analysis tools for confirmatio
RSI Divergence AlertsIndicator Description: RSI Divergence Alerts
The RSI Divergence indicator is a technical analysis tool that identifies divergences between the Relative Strength Index (RSI) and the price of an asset. The RSI is a momentum indicator that measures the speed and magnitude of recent changes in an asset's price, while divergences occur when there is a disparity between price movements and the RSI.
Indicator Customization:
Overbought and Oversold: The indicator allows you to customize the overbought and oversold levels of the RSI. This allows traders to adjust parameters according to their preferences and the historical behavior of the asset in question.
Indicator Settings and Recommended Adjustments:
Max Bar Distance: This parameter determines the maximum distance allowed between two low or high points for a divergence to be recognized. A higher value may result in more signals, but may also increase the number of false signals. It is recommended to adjust this value based on the volatility of the asset and the time period in which it is being traded.
RSI Length: This is the time period used to calculate the RSI. A longer period smoothes the indicator, while a shorter period makes it more sensitive to price changes. The default value is 14, but traders can adjust it based on their trading strategy and the asset's volatility.
RSI Overbought and Oversold: These values determine the levels at which the RSI is considered overbought and oversold, respectively. The default value for overbought is 75 and for oversold is 35. Traders can adjust these values according to the asset's volatility and its historical analysis. For example, in more volatile assets, it may be useful to use more extreme levels, such as 80 for overbought and 20 for oversold.
When adjusting indicator settings, traders must consider the balance between sensitivity and accuracy. Careful tuning of these parameters can help filter out false signals and identify more reliable trading opportunities.
The alerts functionality in this RSI Divergence indicator is designed to notify traders when a bearish divergence or a bullish divergence is detected. Here's how it works:
Conditionally Triggered Alerts:
Alerts are triggered based on the boolean variables bearishDivergence and bullishDivergence.
If bearishDivergence is true, it indicates that a bearish divergence has been detected.
If bullishDivergence is true, it indicates that a bullish divergence has been detected.
Alert Message:
When a divergence is detected, an alert message is generated to inform the trader about the event.
The message includes details about the divergence, such as the difference in the RSI value between the two points forming the divergence.
For example, for a bearish divergence, the message will include the phrase "Bearish RSI Divergence Detected" and the RSI difference between the high and low points of the divergence.
Alert Frequency:
Alerts are configured to be triggered once per bar close (alert.freq_once_per_bar_close), which means the alert will only be sent once at the close of each bar.
This helps to avoid multiple alerts for the same divergence during the same time period.
Additional Alert Conditions:
In addition to conditionally triggered alert messages, alert conditions are defined for both bearish and bullish divergences.
These alert conditions are useful for configuring custom alerts on trading platforms that support running Pine Script code.
Overall, this alert functionality allows traders to stay informed about potential trading opportunities based on divergences detected by the indicator. This can help traders make faster and more informed decisions in their trading processes.

Open Interest-RSI + Funding + Fractal DivergencesIndicator — “Open Interest-RSI + Funding + Fractal Divergences”
A multi-factor oscillator that fuses Open-Interest RSI, real-time Funding-Rate data and price/OI fractal divergences.
It paints BUY/SELL arrows in its own pane and directly on the price chart, helping you spot spots where crowd positioning, leverage costs and price action contradict each other.
1 Purpose
OI-RSI – measures conviction behind position changes instead of price momentum.
Funding Rate – shows who pays to hold positions (longs → bull bias, shorts → bear bias).
Fractal Divergences – detects HH/LL in price that are not confirmed by OI-RSI.
Optional Funding filter – hides signals when funding is already extreme.
Together these elements highlight exhaustion points and potential mean-reversion trades.
2 Inputs
RSI / Divergence
RSI length – default 14.
High-OI level / Low-OI level – default 70 / 30.
Fractal period n – default 2 (swing width).
Fractals to compare – how many past swings to scan, default 3.
Max visible arrows – keeps last 50 BUY/SELL arrows for speed.
Funding Rate
mode – choose FR, Avg Premium, Premium Index, Avg Prem + PI or FR-candle.
Visual scale (×) – multiplies raw funding to fit 0-100 oscillator scale (default 10).
specify symbol – enable only if funding symbol differs from chart.
use lower tf – averages 1-min premiums for smoother intraday view.
show table – tiny two-row widget at chart edge.
Signal Filter
Use Funding filter – ON hides long signals when funding > Buy-threshold and short signals when funding < Sell-threshold.
BUY threshold (%) – default 0.00 (raw %).
SELL threshold (%) – default 0.00 (raw %).
(Enter funding thresholds as raw percentages, e.g. 0.01 = +0.01 %).
3 Visual Outputs
Sub-pane
Aqua OI-RSI curve with 70 / 50 / 30 reference lines.
Funding visualised according to selected mode (green above 0, red below 0, or other).
BUY / SELL arrows at oscillator extremes.
Price chart
Identical BUY / SELL arrows plotted with force_overlay = true above/below candles that formed qualifying fractals.
Optional table
Shows current asset ticker and latest funding value of the chosen mode.
4 Signal Logic (Summary)
Load _OI series and compute RSI.
Retrieve Funding-Rate + Premium Index (optionally from lower TF).
Find fractal swings (n bars left & right).
Check divergence:
Bearish – price HH + OI-RSI LH.
Bullish – price LL + OI-RSI HL.
If Funding-filter enabled, require funding < Buy-thr (long) or > Sell-thr (short).
Plot arrows and trigger two built-in alerts (Bearish OI-RSI divergence, Bullish OI-RSI divergence).
Signals are fixed once the fractal bar closes; they do not repaint afterwards.
5 How to Use
Attach to a liquid perpetual-futures chart (BTC, ETH, major Binance contracts).
If _OI or funding series is missing you’ll see an error.
Choose timeframe:
15 m – 4 h for intraday;
1 D+ for swing trades.
Lower TFs → more signals; raise Fractals to compare or use Funding filter to trim noise.
Trade checklist
Funding positive and rising → longs overcrowded.
Price makes higher high; OI-RSI makes lower high; Funding above Sell-threshold → consider short.
Reverse logic for longs.
Combine with trend filter (EMA ribbon, SuperTrend, etc.) so you fade only when price is stretched.
Automation – set TradingView alerts on the two alertconditions and send to webhooks/bots.
Performance tips
Keep Max visible arrows ≤ 50.
Disable lower-TF premium aggregation if script feels heavy.
6 Limitations
Some symbols lack _OI or funding history → script stops with a console message.
Binance Premium Index begins mid-2020; older dates show na.
Divergences confirm only after n bars (no forward repaint).
7 Changelog
v1.0 – 10 Jun 2025
Initial public release.
Added price-chart arrows via force_overlay.

RSI Candlestick Oscillator [LuxAlgo]The RSI Candlestick Oscillator displays a traditional Relative Strength Index (RSI) as candlesticks. This indicator references OHLC data to locate each candlestick point relative to the current RSI Value, leading to a more accurate representation of the Open, High, Low, and Close price of each candlestick in the context of RSI.
In addition to the candlestick display, Divergences are detected from the RSI candlestick highs and lows and can be displayed over price on the chart.
🔶 USAGE
Translating candlesticks into the RSI oscillator is not a new concept and has been attempted many times before. This indicator stands out because of the specific method used to determine the candlestick OHLC values. When compared to other RSI Candlestick indicators, you will find that this indicator clearly and definitively correlates better to the on-chart price action.
Traditionally, the RSI indicator is simply one running value based on (typically) the close price of the chart. By introducing high, low, and open values into the oscillator, we can better gauge the specific price action throughout the intrabar movements.
Interactions with the RSI levels can now take multiple forms, whether it be a full-bodied breakthrough or simply a wick test. Both can provide a new analysis of price action alongside RSI.
An example of wick interactions and full-bodied interactions can be seen below.
As a result of the candlestick display, divergences become simpler to spot. Since the candlesticks on the RSI closely resemble the candlesticks on the chart, when looking for divergence between the chart and RSI, it is more obvious when the RSI and price are diverging.
The divergences in this indicator not only show on the RSI oscillator, but also overlay on the price chart for clearer understanding.
🔹 Filtering Divergence
With the candlesticks generating high and low RSI values, we can better sense divergences from price, since these points are generally going to be more dramatic than the (close) RSI value.
This indicator displays each type of divergence:
Bullish Divergence
Bearish Divergence
Hidden Bullish Divergence
Hidden Bearish Divergence
From these, we get many less-than-useful indications, since every single divergence from price is not necessarily of great importance.
The Divergence Filter disregards any divergence detected that does not extend outside the RSI upper or lower values.
This does not replace good judgment, but this filter can be helpful in focusing attention towards the extremes of RSI for potential reversal spotting from divergence.
🔶 DETAILS
In order to get the desired results for a display that resembles price action while following RSI, we must scale. The scaling is the most important part of this indicator.
To summarize the process:
Identify a range on Price and RSI
Consider them as equal to create a scaling factor
Use the scaling factor to locate RSI's "Price equivalent" Upper, Lower, & Mid on the Chart
Use those prices (specifically the RSI Mid) to check how far each OHLC value lies from it
Use those differences to translate the price back to the RSI Oscillator, pinning the OHLC values at their relative location to our anchor (RSI Mid)
🔹 RSI Channel
To better understand, and for your convenience, the indicator includes the option to display the RSI Channel on the chart. This channel helps to visualize where the scaled RSI values are relative to price.
If you analyze the RSI channel, you are likely to notice that the price movement throughout the channel matches the same movement witnessed in the RSI Oscillator below. This makes sense since they are the exact same thing displayed on different scales.
🔹 Scaling the Open
While the scaling method used is important, and provides a very close view of the real price bar's relative locations on the RSI oscillator… It is designed for a single purpose.
The scaling does NOT make the price candles display perfectly on the RSI oscillator.
The largest place where this is noticeable is with the opening of each candle.
For this reason, we have included a setting that modifies the opening of each RSI candle to be more accurate to the chart's price candles.
This setting positions the current bar's opening RSI candlestick value accurately relative to the price's open location to the previous closing price. As seen below.
🔶 SETTINGS
🔹 RSI Candles
RSI Length: Sets the Length for the RSI Oscillator.
Overbought/Oversold Levels: Sets the Overbought and Oversold levels for the RSI Oscillator.
Scale Open for Chart Accuracy: As described above, scales the open of each candlestick bar to more accurately portray the chart candlesticks.
🔹 Divergence
Show on Chart: Choose to display divergence line on the chart as well as on the Oscillator.
Divergence Length: Sets the pivot width for divergence detection. Normal Fractal Pivot Detection is used.
Divergence Style: Change color and line style for Regular and Hidden divergences, as well as toggle their display.
Divergence Filter: As described above, toggle on or off divergence filtering.
🔹 RSI Channel
Toggle: Display RSI Channel on Chart.
Color: Change RSI Channel Color

Dollar Volume DivergenceOverview
The Dollar Volume Profile and Divergence Indicator is a comprehensive tool designed to analyze both standard volume and dollar volume activity in the market. It visualizes dollar volume (calculated as close * volume) and highlights divergences between dollar volume and standard volume, providing insights into underlying market dynamics that aren't immediately visible with traditional volume analysis.
Key Features
Dollar Volume Profile:
Plots dollar volume as a histogram.
Highlights high-dollar volume bars in green (indicating significant trading activity).
Includes an optional average dollar volume line to show trends over time.
Volume-Divergence Analysis:
Calculates the difference (divergence) between dollar volume and standard volume.
Displays positive divergence (dollar volume > standard volume) in green and negative divergence (dollar volume < standard volume) in red.
Supports both histogram and boolean point visualization for divergence, offering flexibility in how the data is displayed.
Customizable Visualization:
Users can toggle between a Histogram or Boolean Points for divergence visualization.
Option to enable or disable the dollar volume profile and its average line.
Adjustable length parameter to fine-tune sensitivity for averages and divergences.
Use Cases
Volume Confirmation: Analyze whether dollar volume aligns with standard volume to confirm strong price movements.
Divergence Detection: Identify areas where dollar volume and standard volume deviate, which may signal potential reversals or exhaustion in a trend.
Market Strength Analysis: Assess the intensity of trading activity at specific price levels to determine key areas of interest.
How It Works
Dollar Volume Calculation:
Dollar volume is derived by multiplying the close price by the volume for each bar.
A moving average of dollar volume is used to determine relative activity levels.
Divergence Calculation:
The script calculates the difference between dollar volume and standard volume.
Positive values indicate that dollar volume exceeds standard volume, suggesting institutional or larger-scale trades.
Negative values highlight areas of lower dollar volume compared to standard volume.
Visualization:
The Dollar Volume Profile is displayed as a histogram, with high-dollar volume bars highlighted.
Divergences are overlaid as either a histogram or triangle markers, depending on user preference.
Average lines (optional) provide smoother trends for both dollar volume and divergence.
Customization Options
Length: Adjusts the period for moving average calculations.
Plot Style: Choose between Histogram or Boolean Points for divergence visualization.
Toggle Visibility: Enable or disable the Dollar Volume Profile and its average line for a cleaner chart.
Why Use This Indicator?
This indicator bridges the gap between traditional volume analysis and dollar volume analysis, offering deeper insights into market behavior. By combining these metrics, traders can detect nuanced patterns, validate trends, and identify divergences that may signal market turning points or continuation.
Best Practices
Use this indicator in conjunction with price action and other technical indicators for confirmation.
Look for divergences in high-dollar volume areas to detect potential trend reversals.
Analyze the interaction between the dollar volume profile and divergence histogram for a comprehensive view of market activity.
Important Notice:
Trading financial markets involves significant risk and may not be suitable for all investors. The use of technical indicators like this one does not guarantee profitable results. This indicator should not be used as a standalone analysis tool. It is essential to combine it with other forms of analysis, such as fundamental analysis, risk management strategies, and awareness of current market conditions. Always conduct thorough research or consult with a qualified financial advisor before making trading decisions. Past performance is not indicative of future results.
Disclaimer:
Trading financial instruments involves substantial risk and may not be suitable for all investors. Past performance is not indicative of future results. This indicator is provided for informational and educational purposes only and should not be considered investment advice. Always conduct your own research and consult with a licensed financial professional before making any trading decisions.
Note: The effectiveness of any technical indicator can vary based on market conditions and individual trading styles. It's crucial to test indicators thoroughly using historical data and possibly paper trading before applying them in live trading scenarios.

RSI/MFI Divergence Finder [idahodev]Monitoring RSI (Relative Strength Index) and MFI (Money Flow Index) divergences on a stock or index chart offers several benefits to traders and analysts. Let's break down the advantages:
Comprehensive Market View: Combining both indicators provides a more complete picture of market conditions, as they measure different aspects of price movement. RSI focuses on recent gains/losses relative to price change, while MFI incorporates volume data to assess money flow in and out of a security.
Enhanced Signal Accuracy: When divergences occur simultaneously in both RSI and MFI, it may be considered a stronger signal than if only one indicator showed divergence. This can potentially lead to more reliable trading decisions.
Identification of False Breakouts: Divergences between these indicators and price action can help identify false breakouts or misleading price movements that are not supported by underlying market strength or volume.
More Nuanced Market Understanding: By examining divergent behavior between money flow (MFI) and momentum (RSI), traders gain a more detailed comprehension of the interplay between these factors in shaping market trends.
Early Warning Signs: These divergences can act as early warning signs for potential trend reversals or changes in market sentiment, allowing traders to adjust their strategies proactively.
It's important to note that RSI/MFI divergences should be used as part of a broader trading strategy rather than solely relying on them for buy/sell signals. They can serve as valuable tools for confirming trends, identifying potential turning points, or warning against overbought/oversold conditions.
When using these indicators together, traders must be cautious of false signals, especially in choppy markets or during periods of high volatility. It's crucial to combine this analysis with other technical and fundamental factors before making trading decisions.
In summary, monitoring RSI/MFI divergences may offer a way to gain insights into the underlying strengths and weaknesses of market movements.
This utility differs from other in that it allows for a choke/threshold/sensitivity setting to help weed out noisy signals. This needs to be carefully adjusted per chart.
It also allows for tuning of the MFI smoothing length (number of bars on the current chart) as well as how many previous bars it will take into consideration when calculating RSI and MFI divergences. It will signal when it sees alignment forming between RSI and MFI divergences in a direction. You will likely need to tune this script's settings every few days or at least anytime there is a change in overall market behavior or sustained volatility.
Ultimately, the goal with this script is to provide an additional level of confirmation of weakness or strength. It should be combined with other indicators such as exhaustion, pivots, supply/demand, trendline breaks or tests, and structure changes, to name a few complementary tools or strategies. It's not meant to be a standalone buy/sell signal indicator!
Here are some settings for futures that may help you get started:
ES (4m chart)
RSI Length: 26
MFI Length: 8
MFI Smoothing Length: 32
Divergence Sensitivity: 124
Left Bars for Pivot: 10
Right Bars for Pivot: 1
NQ (4m chart)
RSI Length: 14
MFI Length: 14
MFI Smoothing Length: 21
Divergence Sensitivity: 400
Left Bars for Pivot: 21
Right Bars for Pivot: 1
YM (4m chart)
RSI Length: 14
MFI Length: 14
MFI Smoothing Length: 21
Divergence Sensitivity: 810
Left Bars for Pivot: 33
Right Bars for Pivot: 1

Ichimoku Oscillator With Divergences [ChartPrime]The Ichimoku Oscillator is a trading indicator designed to streamline the interpretation of Ichimoku clouds. It aims to refine and condense the complexities of the Chikou (the lag line), presenting its implications in real-time through an oscillator format, beneficial for those familiar with Ichimoku components but to have a new interpretation of their indicators.
The basics of an Ichimoku:
Conversion Line (Tenkan-Sen): It represents a midpoint of the highest and lowest prices over a specific period, usually 9 periods, reflecting short-term price movements.
Base Line (Kijun-Sen): It acts similarly to the Conversion Line but over a longer period, typically 26 periods, representing medium-term price movements.
Leading Span A & B (Kumo): Span A is the average of the Conversion Line and Base Line, and Span B is the midpoint of the highest and lowest prices over a usually longer period, typically 52 periods. Their interaction denotes trend direction, and the cloud color changes depending on whether Span A is above or below Span B, indicating bullish or bearish market conditions, respectively.
Lagging Span (Chikou Span): It is the current closing price plotted 26 periods behind, assisting in confirming the trend direction and potential momentum.
Advantage of an Oscillator:
Utilizing the oscillator format allows traders to interpret market dynamics more efficiently by visualizing the momentum and trend strength in a bounded range, enabling quick assessments of overbought or oversold conditions. Creating this oscillator provides multiple advantageous; particularly in sideway markets, helping to identify potential reversal points and offering insights on market entries and exits. When building this oscillator we've put a focus on unique interpretations such as overbought and sold areas and divergences; otherwise not found in traditional Ichimoku techniques. It is important to note these divergences are naturally not 100% real time.
When the oscillator turns green; the market is in an uptrend, red for downtrend and yellow for a transitioning market. The center line and the inner most cloud represent a balanced market state.
Key Features & Input Parameters:
Signal Source: Allows the selection of the price data source for signal generation, such as closing prices, and it’s the foundational parameter upon which the oscillator functions.
Normalization Settings: Users can select the normalization mode (“All”, “Window”, or “Disabled”), influencing how the oscillator scales its values. When enabled, it will scale from 100 to -100, allowing the user to understand better the relative positioning of price data.
Smoothing: This indicator offers advanced smoothing features, with options for additional smoothing, allowing traders to adjust the signal's sensitivity to price movements.
Kumo & Chikou Visibility: Traders can customize the visibility settings of Kumo and Chikou, tailoring the display of each component to their preference, enabling a cleaner and more intuitive view of market conditions.
Color Coding: Each component and condition, like bullish or bearish states, can be color-coded, providing visual cues to enhance the interpretability of market trends and states.
Color on Conversion: The oscillator provides an option to color the signal based on the crossover of the conversion and base lines.
Divergence: The oscillator can detect and highlight regular and hidden bullish and bearish divergences between the signal and price, aiding traders in identifying potential trend reversals or continuations.
Alerts:
The list of inbuilt alerts are provided below:
Inside Cloud: The signal line is inside the cloud.
Up Out of Cloud: The signal line crossed above the cloud.
Down Out of Cloud: The signal line crossed below the cloud.
Future Kumo Cross Bullish: The future Kumo lines have crossed in a bullish manner.
Future Kumo Cross Bearish: The future Kumo lines have crossed in a bearish manner.
Current Kumo Cross Bullish: The current Kumo lines have crossed in a bullish manner.
Current Kumo Cross Bearish: The current Kumo lines have crossed in a bearish manner.
Conversion Base Bullish: The conversion line crossed above the base line.
Conversion Base Bearish: The conversion line crossed below the base line.
Signal Bullish on Conversion Base: The signal line crossed above the maximum of conversion and base lines.
Signal Bearish on Conversion Base: The signal line crossed below the minimum of conversion and base lines.
Chikou Bullish: The Chikou line crossed above zero.
Chikou Bearish: The Chikou line crossed below zero.
Signal Over Max: The signal line crossed above the max level.
Signal Over High: The signal line crossed above the high level.
Signal Under Min: The signal line crossed below the min level.
Signal Under Low: The signal line crossed below the low level.
Chikou Over Max: The Chikou line crossed above the max level.
Chikou Over High: The Chikou line crossed above the high level.
Chikou Under Min: The Chikou line crossed below the min level.
Chikou Under Low: The Chikou line crossed below the low level.
Signal Crossover MA: The signal line crossed over the moving average.
Signal Crossunder MA: The signal line crossed under the moving average.
Regular Bullish Divergence: Regular bullish divergence detected.
Hidden Bullish Divergence: Hidden bullish divergence detected.
Regular Bearish Divergence: Regular bearish divergence detected.
Hidden Bearish Divergence: Hidden bearish divergence detected.
Bounce off of Kumo Up: Bullish Bounce off of Kumo.
Bounce off of Kumo Down: Bearish Bounce off of Kumo.
By providing a cohesive visualization of the Ichimoku elements and market momentum within a bounded range, this oscillator is a unique tool and insight into markets.

The Divergent LibraryLibrary "TheDivergentLibrary"
The Divergent Library is only useful when combined with the Pro version of The Divergent - Advanced divergence indicator . This is because the Basic (free) version of The Divergent does not expose the "Divergence Signal" value.
Usage instructions:
1. Create a new chart
2. Add The Divergent (Pro) indicator to your chart
3. Create a new strategy, import this library, add a "source" input, link it to "The Divergent: Divergence Signal", and use the library to decode the divergence signals from The Divergent (You can find example strategy code published in our profile)
4. Act on the divergences signalled by The Divergent
---
isRegularBullishEnabled(context) Returns a boolean value indicating whether Regular Bullish divergence detection is enabled in The Divergent.
Parameters:
context : The context of The Divergent Library.
Returns: A boolean value indicating whether Regular Bullish divergence detection is enabled in The Divergent.
isHiddenBullishEnabled(context) Returns a boolean value indicating whether Hidden Bullish divergence detection is enabled in The Divergent.
Parameters:
context : The context of The Divergent Library.
Returns: A boolean value indicating whether Hidden Bullish divergence detection is enabled in The Divergent.
isRegularBearishEnabled(context) Returns a boolean value indicating whether Regular Bearish divergence detection is enabled in The Divergent.
Parameters:
context : The context of The Divergent Library.
Returns: A boolean value indicating whether Regular Bearish divergence detection is enabled in The Divergent.
isHiddenBearishEnabled(context) Returns a boolean value indicating whether Hidden Bearish divergence detection is enabled in The Divergent.
Parameters:
context : The context of The Divergent Library.
Returns: A boolean value indicating whether Hidden Bearish divergence detection is enabled in The Divergent.
getPivotDetectionSource(context) Returns the 'Pivot Detection Source' setting of The Divergent. The returned value can be either "Oscillator" or "Price".
Parameters:
context : The context of The Divergent Library.
Returns: One of the following string values: "Oscillator" or "Price".
getPivotDetectionMode(context) Returns the 'Pivot Detection Mode' setting of The Divergent. The returned value can be either "Bodies" or "Wicks".
Parameters:
context : The context of The Divergent Library.
Returns: One of the following string values: "Bodies" or "Wicks".
isLinked(context) Returns a boolean value indicating the link status to The Divergent indicator.
Parameters:
context : The context of The Divergent Library.
Returns: A boolean value indicating the link status to The Divergent indicator.
init(firstBarSignal, displayLinkStatus, debug) Initialises The Divergent Library's context with the signal produced by The Divergent on the first bar. The value returned from this function is called the "context of The Divergent Library". Some of the other functions of this library requires you to pass in this context.
Parameters:
firstBarSignal : The signal from The Divergent indicator on the first bar.
displayLinkStatus : A boolean value indicating whether the Link Status window should be displayed in the bottom left corner of the chart. Defaults to true.
debug : A boolean value indicating whether the Link Status window should display debug information. Defaults to false.
Returns: A bool array containing the context of The Divergent Library.
processSignal(signal) Processes a signal from The Divergent and returns a 5-tuple with the decoded signal: [ int divergenceType, int priceBarIndexStart, int priceBarIndexEnd, int oscillatorBarIndexStart, int oscillatorBarIndexEnd]. `divergenceType` can be one of the following values: na → No divergence was detected, 1 → Regular Bullish, 2 → Regular Bullish early, 3 → Hidden Bullish, 4 → Hidden Bullish early, 5 → Regular Bearish, 6 → Regular Bearish early, 7 → Hidden Bearish, 8 → Hidden Bearish early.
Parameters:
signal : The signal from The Divergent indicator.
Returns: A 5-tuple with the following values: [ int divergenceType, int priceBarIndexStart, int priceBarIndexEnd, int oscillatorBarIndexStart, int oscillatorBarIndexEnd].

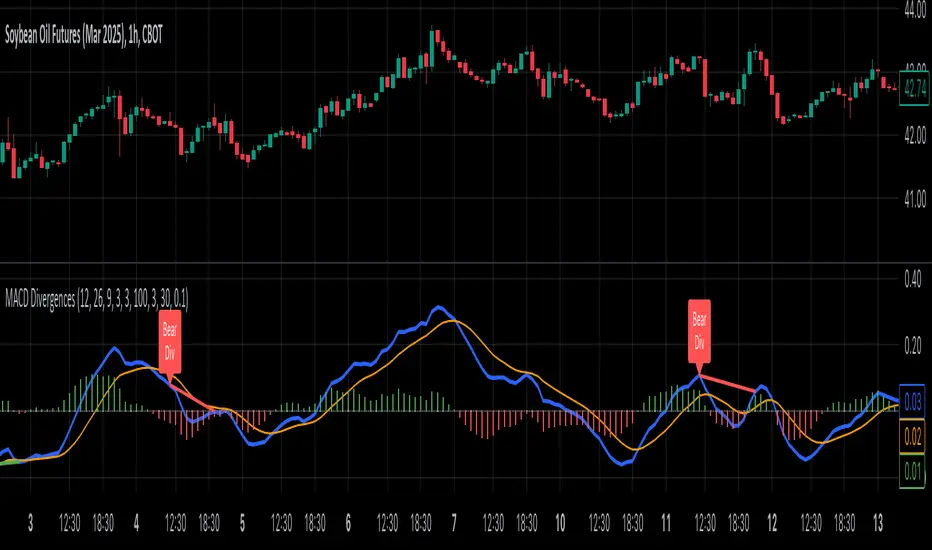
MACD Divergence all in oneMACD Divergence all in one
It can also be named as MACD dual divergence detector pro !
A sophisticated yet user-friendly tool designed to identify both bullish and bearish divergences using the MACD (Moving Average Convergence Divergence) indicator. This advanced script helps traders spot potential trend reversals by detecting hidden momentum shifts in the market, offering a comprehensive solution for divergence trading.
🎯 Key Features:
• Automatic detection of bullish and bearish divergences
• Clear visual signals with color-coded lines (Green for bullish, Red for bearish)
• Smart filtering system to eliminate false signals
• Customizable parameters to match your trading style
• Clean, uncluttered chart presentation
• Optimized performance for real-time analysis
• Easy-to-read labels showing divergence types
• Built-in signal spacing to avoid clustering
📊 How it works:
The indicator uses an advanced algorithm to analyze the relationship between price action and MACD momentum to identify:
Bullish Divergences:
- Price makes higher lows while MACD shows lower lows
- Signals potential trend reversal from bearish to bullish
- Marked with green lines and upward labels
Bearish Divergences:
- Price makes lower highs while MACD shows higher highs
- Signals potential trend reversal from bullish to bearish
- Marked with red lines and downward labels
⚙️ Customizable Settings:
1. MACD Parameters:
- Fast Length (default: 12)
- Slow Length (default: 26)
- Signal Length (default: 9)
2. Divergence Detection:
- Left/Right Pivot Bars
- Divergence Lookback Period
- Minimum/Maximum Divergence Length
- Divergence Strength Filter
3. Visual Settings:
- Clear color coding for easy identification
- Adjustable line thickness
- Customizable label size
💡 Best Practices:
- Most effective on higher timeframes (1H, 4H, Daily)
- Combine with support/resistance levels
- Use with trend lines and price action
- Consider volume confirmation
- Best results during trending markets
- Use appropriate stop-loss levels
🎓 Trading Tips:
1. Look for bullish divergences near support levels
2. Watch for bearish divergences near resistance zones
3. Confirm signals with other technical indicators
4. Consider market context and overall trend
5. Use proper position sizing and risk management
⚠️ Important Notes:
- Past performance doesn't guarantee future results
- Always use proper risk management
- Test settings on historical data first
- Different timeframes may require parameter adjustments
- Not all divergences lead to reversals
Created by: Anmol-max-star
Last Updated: 2025-02-25 16:15:08 UTC
📌 Regular updates and improvements planned!
Disclaimer:
This indicator is for informational purposes only. Always conduct your own analysis and use proper risk management techniques. Trading involves risk of loss, and past performance does not guarantee future results.
🤝 Support:
Feel free to leave comments for:
- Suggestions
- Improvements
- Feature requests
- Bug reports
- General feedback
Your feedback helps make this tool better for everyone!
Happy Trading and May the Trends Be With You! 📈
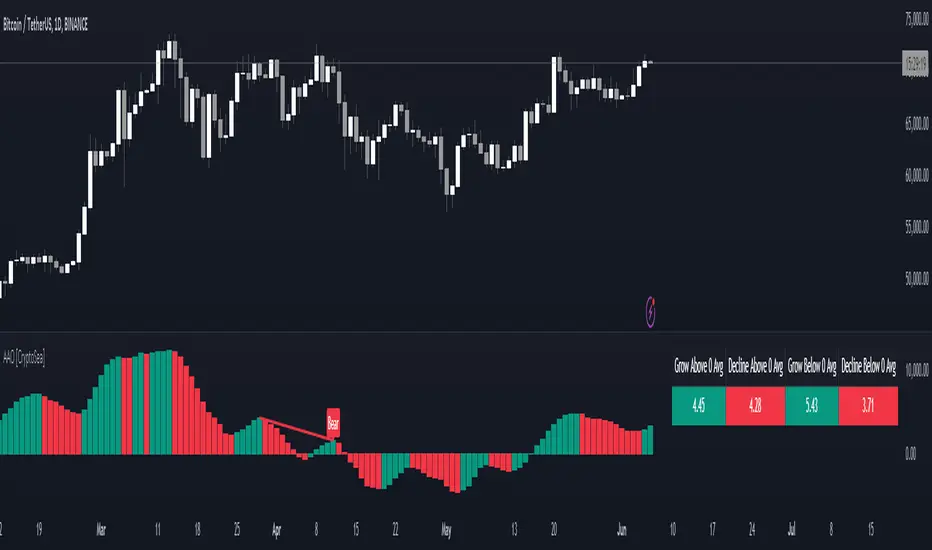
Advanced Awesome Oscillator [CryptoSea]Advanced AO Analysis Indicator
The Advanced AO Analysis indicator is a sophisticated tool designed to evaluate the Awesome Oscillator (AO) in search of regular and hidden divergences that signal potential price reversals. By tracking the intensity and duration of the AO's movements, this indicator aids traders in pinpointing critical points in price action.
Key Features
Divergence Detection: Identifies both regular and hidden bullish and bearish divergences, providing early signs of potential market reversals.
Customizable Lookback Periods: Allows users to set specific lookback windows to define the strength and relevance of detected divergences.
Adaptive Oscillator Display: Features customizable display options for the AO, enabling users to view data in different modes suited to their analysis needs.
Alert System: Includes configurable alerts to notify users of potential divergence formations, helping traders respond promptly.
How it Works
AO Calculation: Computes the AO as the difference between short-term and long-term moving averages of the midpoints of bars, highlighting momentum shifts.
Pivot Point Analysis: Utilizes advanced algorithms to find low and high pivot points based on the oscillator values, crucial for spotting trend reversals.
Range Validation: Verifies that divergences occur within a predefined range from pivot points, ensuring their validity and strength.
Visualisation: Plots AO values and potential divergences directly on the chart, aiding in quick visual analysis.
Application
Strategic Decision-Making: Assists traders in making informed decisions by providing detailed analysis of AO movements and divergence.
Trend Confirmation: Reinforces trading strategies by confirming potential reversals with pivot point detection and divergence analysis.
Behavioural Insight: Offers insights into market dynamics and sentiment by analyzing the depth and duration of AO cycles above and below zero.
The Advanced AO Analysis indicator equips traders with a powerful analytical tool for studying the Awesome Oscillator in-depth, enhancing their ability to spot and act on divergence-based trading opportunities in the cryptocurrency markets.
MAC-Z & MACD Leader signal [ChuckBanger]This is a combination of my MACD Leader script and MAC-Z with option to add Laguerre filter. The advantage of the MAC-Z over MACD is that it is a more accurate and “assumption-free” indicator that can more accurately describe how a market actually perform. But you can use this as a regular MACD indicator.
Crossovers signals
The MAC-Z line and signal line can be utilized in the same way as a stochastic oscillator, with the crossover between the two lines providing buy and sell signals. As with most crossover strategies, a buy signal comes when the shorter-term, more reactive line – in this case the MAC-Z line (blue line) crosses above the slower signal line (orange line). For example, when the MAC-Z line crosses below the signal line it provides a bearish sell signal.
Zero line crossing
The zero cross strategy is based on either of the lines crossing the zero line. If the MAC-Z crosses the zero line from below, it is a signal for a possible new uptrend, while the MAC-Z crossing from above is a signal that a new downtrend may be starting. This is special powerful if the lines has a fast up or down movement but the price action doesn't reflect that movement.
Divergences
Bearish and bullish divergences is my favorite signals. When price action and oscillators follow the same path it is called Convergences, when they don’t, it’s called a Divergence. Don't confuse the two because they have not the same meaning. But be aware that for example during consolidation or low liquidity, some small divergences between price and indicators might form, but that doesn't mean we should consider them as real divergences.
There is many different types of divergences. It is easier to show a picture then explaining it so I recommend you to check out the link below. Especially the top image. It sums this up very well
medium.com
MACD Leader
The MACD leader is only showing the crossing of MACD as a vertical line
Green vertical line = MACD Leader Bullish Cross
Red vertical line = MACD Leader Bearish Cross
MACD Leader:
MAC-Z:
More Information
cssanalytics.wordpress.com
en.wikipedia.org
drive.google.com

RSI Divergence Screener [Pineify]RSI Divergence Screener
Key Features
Multi-symbol and multi-timeframe support for advanced market screening.
Real-time detection and visualization of bullish and bearish RSI divergences.
Seamless integration with core technical indicators and custom divergences.
Highly customizable parameters for precise adaptation to personal trading strategies.
Comprehensive screener table for swift asset comparison and analysis.
How It Works
The RSI Divergence Screener leverages the power of Relative Strength Index (RSI) to systematically track momentum shifts across cryptocurrencies and their respective timeframes. By monitoring both fast and slow RSI calculations, the screener isolates divergence signals—key reversal points that often precede major price moves.
The indicator calculates two RSI values for each selected asset: one with a short lookback (Fast RSI) and another with a longer period (Slow RSI).
It runs a comparative algorithm to find divergences—whenever Fast RSI deviates significantly from Slow RSI, it flags the signal as bullish or bearish.
All detected divergences are dynamically presented in a table view, allowing traders to scan symbols and timeframes for optimal trading setups.
Trading Ideas and Insights
Spot early momentum reversals and preempt major price swings via divergence signals.
Combine multiple symbols and timeframes for cross-market trending opportunities.
Identify high-probability scalping and swing trading setups informed by RSI divergence logic.
Quickly compare crypto asset strength and trend exhaustion across short and long-term horizons.
How Multiple Indicators Work Together
This screener’s edge lies in its synergistic use of multi-setting RSI calculations and customizable input groups.
The dual-RSI approach (Fast vs. Slow) isolates subtle trend shifts missed by traditional single-period RSI.
Safe and reliable divergences arise only when the mathematical difference between Fast RSI and Slow RSI meets predefined thresholds, minimizing false positives.
Divergences are contextualized using tailored color codes and backgrounds, rendering insights immediately actionable.
You can expand analysis with additional moving average filters or overlays for further confirmation.
Unique Aspects
First-of-its-kind screener dedicated solely to RSI divergence, designed especially for crypto volatility.
Efficient screening of up to eight assets and multiple timeframes in one compact dashboard.
Intuitive iconography, color logic, and table layouts optimized for rapid decision-making.
Advanced input group design for fine-tuning indicator settings per symbol, timeframe, and source.
How to Use
Select up to eight cryptocurrency symbols to screen for divergence signals.
Assign individual timeframes and source prices for each asset to customize analysis.
Set Fast RSI and Slow RSI lengths according to your preferred strategy (e.g., scalping, swing, or trend following).
Review the screener table: colored cells highlight actionable bullish (green) and bearish (red) divergences.
Confirm trade setups with additional indicators or price action for robust risk management.
Customization
Symbols: Choose any crypto pair or ticker for dynamic divergence tracking.
Timeframes: Scan across 1m, 5m, 10m, 30m, and more for full market coverage.
RSI lengths: Configure Fast and Slow RSI periods based on volatility and trading style.
Visuals: Tailor table colors, fonts, and alert backgrounds per your preference.
Conclusion
The RSI Divergence Screener is a versatile, original TradingView indicator that empowers traders to scan, compare, and act on divergence signals with speed and precision. Its multi-symbol design, robust logic, and extensive customization options set a new standard for market screening tools. Integrate it into your crypto trading process to capture actionable opportunities ahead of the crowd and optimize your technical analysis workflow.

XMR Divergences vs KrakenSUMMARY
This script finds the percentage difference between Kraken, and multiple other exchanges, for the price of XMRUSD, and then runs a variable length moving average of those differences. Optionally, you can multiply by the reported volume of the exchange in question. Skip to "USAGE" at the bottom for a quick view of the settings. But I recommend reading DETAILED DESCRIPTION as well.
PURPOSE
The purpose of this script is to get a look into the relative funds flows of XMR between Kraken and the other exchanges. So long as an exchange withdraws are open: 1) Negative divergences indicate XMR outflows from the exchange under consideration, 2) Postive divergences indicate XMR inflows from Kraken to the exchange.
This appears to be moderately correlated with price movements in Monero (but not always). There is also the theory that positive accumulation is a leading indication of a growing probability of postive price action in the general crypto market, and negative accumulation is a leading indicator of an upcoming peak. In other words, exchanges like to accumulate Monero quietly during calm downtimes, and they like to manage its price from gaining too much attention (pump) during broad market positivity.
BACKGROUND
It's well known among XMR traders that most exchanges are operating on a heavy fractional reserve basis as regards Monero. The past 2 years have seen regular and repeated withdraw freezes, sometimes for weeks/months at a time. Occasionally, liquidity stress tests have been performed, with predictable results - none of these exchanges are able to continue supporting withdraws.
Kraken is the only exchange of meaningful volume that has never frozen withdraws for more than an hour or so. Thus, we theorize that Kraken is operating with all, or most of the XMR they claim to have.
Furthermore, we have seen in the past, large price negative price divergences of these fractional reserve exchanges relative to Kraken. As the social outcry grew stronger for this malfeasance, these exchanges have gone to greater lengths to hide their price divergences.
On minute-by-minute ; hour-by-hour basis, typically, a look with the naked eye would show oscillation around the zero point. But when you average it out, especially on lower timeframes (like the 1 and 5 min candles), you can very clearly see that when withdraws are shut down, these exchanges simultaneously diverge their prices downwards as well.
DETAILED DESCRIPTION
The ideal view of price divergence would compare second-by-second prices, and then run something like a rolling 4-hr or 1-day SMA to average out the overall divergences. However, due to limitations of TradingView, this is impractical/impossible for actual usage/viewing. As a result, a balance must be struck, when selecting the combination of the candle period, and the SMA lookback length.
I find that 5min candles, with a 48-period lookback (that equates to a rolling 4-hour SMA), offers the best view of recent and historical price divergence activity. This of course means that we're only sampling price divergences once every 5 minutes, but it still provides a decent look at what's happening. If this script gets popular, I wouldn't be surprised if these exchanges start timing their candle closes to mask their misdeeds, but that's of course speculative on my part.
The other important factor here, *IS TO MULTIPLY BY VOLUME*. Some of these no-volume exchanges have large price divergences. But if they're not doing any real volume, then it doesn't really have any real market impact. Thus, I recommend keeping the "Make volume adjustment" option on.
If that ends up happening, we'll have to infer that by comparing the difference in close prices, vs the difference in the highest or lowest intra-candle prices (wicks). Typically a divergence should have all 3 showing similar results.
Notes regarding "Sum_of_All": This only makes sense when multiplying by volume. So only check this if you also made the volume adjustment. Generally I believe that *Binance* sets the tone. However, we have seen numerous occasions where Binance diverges down, and the others diverge up. I believe this is a social influence tactic, since most people look at Binance price. Meanwhile, they're trying to accumulate some small amount on the other exchanges to minimize their overall loss. This of course assumes collusion by these exchanges, which is a high likely hood, seeing as how in May 2021, they all diverged together simultaneously (among other evidence).
USAGE
I recommend using your browser zoom, to see data beyond 1 month in the past.
Lookback - The number of candles over which to conduct a moving average. On 5-min candles for example, here's how the math works out:
12 - Equates to a 1 hr MA
24 - 2 hrs
48 - 4 hrs (default)
288 - 1 day
2880 - 10 days
Make Volume Adjustment - Recommend that you usually keep this on.
Line Widths - Set to preference
Show_Close_Price? - You can compute the difference at candle close. Or you can check the other boxes to compare the highest/lowest prices for intra candle prices (wicks).
Show Sum_of_All? - You can sum all of the differences, which only makes sense if you're making the volume adjustement. Default is off. Below, you can also choose which exchanges to include in the sum.
This works best on lower timeframes, like the 1m, 5, and 15m charts. I personally use 5m, with 48 or 96 length lookback. You get a better view of the real time price divergences that way.
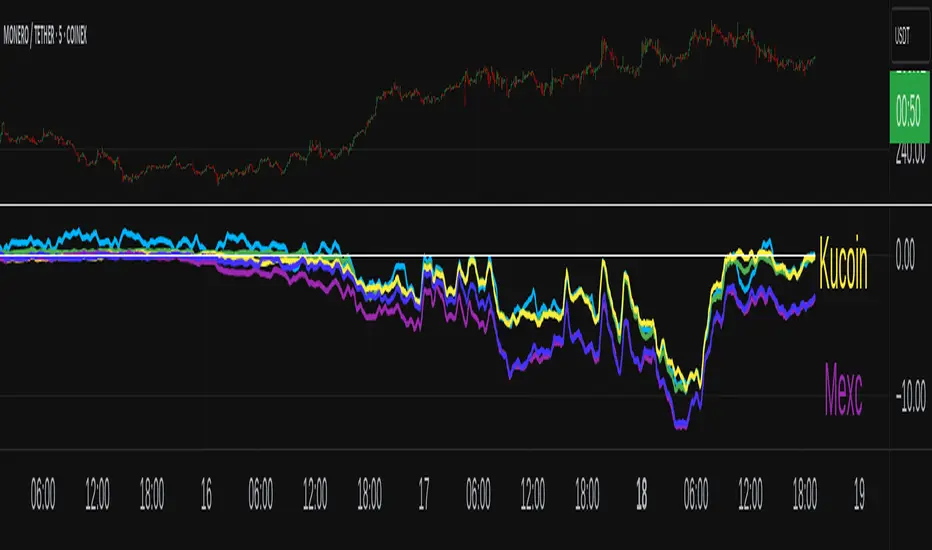
Dskyz (DAFE) Aurora Divergence – Quant Master Dskyz (DAFE) Aurora Divergence – Quant Master
Introducing the Dskyz (DAFE) Aurora Divergence – Quant Master , a strategy that’s your secret weapon for mastering futures markets like MNQ, NQ, MES, and ES. Born from the legendary Aurora Divergence indicator, this fully automated system transforms raw divergence signals into a quant-grade trading machine, blending precision, risk management, and cyberpunk DAFE visuals that make your charts glow like a neon skyline. Crafted with care and driven by community passion, this strategy stands out in a sea of generic scripts, offering traders a unique edge to outsmart institutional traps and navigate volatile markets.
The Aurora Divergence indicator was a cult favorite for spotting price-OBV divergences with its aqua and fuchsia orbs, but traders craved a system to act on those signals with discipline and automation. This strategy delivers, layering advanced filters (z-score, ATR, multi-timeframe, session), dynamic risk controls (kill switches, adaptive stops/TPs), and a real-time dashboard to turn insights into profits. Whether you’re a newbie dipping into futures or a pro hunting reversals, this strat’s got your back with a beginner guide, alerts, and visuals that make trading feel like a sci-fi mission. Let’s dive into every detail and see why this original DAFE creation is a must-have.
Why Traders Need This Strategy
Futures markets are a battlefield—fast-paced, volatile, and riddled with institutional games that can wipe out undisciplined traders. From the April 28, 2025 NQ 1k-point drop to sneaky ES slippage, the stakes are high. Meanwhile, platforms are flooded with unoriginal, low-effort scripts that promise the moon but deliver noise. The Aurora Divergence – Quant Master rises above, offering:
Unmatched Originality: A bespoke system built from the ground up, with custom divergence logic, DAFE visuals, and quant filters that set it apart from copycat clutter.
Automation with Precision: Executes trades on divergence signals, eliminating emotional slip-ups and ensuring consistency, even in chaotic sessions.
Quant-Grade Filters: Z-score, ATR, multi-timeframe, and session checks filter out noise, targeting high-probability reversals.
Robust Risk Management: Daily loss and rolling drawdown kill switches, plus ATR-based stops/TPs, protect your capital like a fortress.
Stunning DAFE Visuals: Aqua/fuchsia orbs, aurora bands, and a glowing dashboard make signals intuitive and charts a work of art.
Community-Driven: Evolved from trader feedback, this strat’s a labor of love, not a recycled knockoff.
Traders need this because it’s a complete, original system that blends accessibility, sophistication, and style. It’s your edge to trade smarter, not harder, in a market full of traps and imitators.
1. Divergence Detection (Core Signal Logic)
The strategy’s core is its ability to detect bullish and bearish divergences between price and On-Balance Volume (OBV), pinpointing reversals with surgical accuracy.
How It Works:
Price Slope: Uses linear regression over a lookback (default: 9 bars) to measure price momentum (priceSlope).
OBV Slope: OBV tracks volume flow (+volume if price rises, -volume if falls), with its slope calculated similarly (obvSlope).
Bullish Divergence: Price slope negative (falling), OBV slope positive (rising), and price above 50-bar SMA (trend_ma).
Bearish Divergence: Price slope positive (rising), OBV slope negative (falling), and price below 50-bar SMA.
Smoothing: Requires two consecutive divergence bars (bullDiv2, bearDiv2) to confirm signals, reducing false positives.
Strength: Divergence intensity (divStrength = |priceSlope * obvSlope| * sensitivity) is normalized (0–1, divStrengthNorm) for visuals.
Why It’s Brilliant:
- Divergences catch hidden momentum shifts, often exploited by institutions, giving you an edge on reversals.
- The 50-bar SMA filter aligns signals with the broader trend, avoiding choppy markets.
- Adjustable lookback (min: 3) and sensitivity (default: 1.0) let you tune for different instruments or timeframes.
2. Filters for Precision
Four advanced filters ensure signals are high-probability and market-aligned, cutting through the noise of volatile futures.
Z-Score Filter:
Logic: Calculates z-score ((close - SMA) / stdev) over a lookback (default: 50 bars). Blocks entries if |z-score| > threshold (default: 1.5) unless disabled (useZFilter = false).
Impact: Avoids trades during extreme price moves (e.g., blow-off tops), keeping you in statistically safe zones.
ATR Percentile Volatility Filter:
Logic: Tracks 14-bar ATR in a 100-bar window (default). Requires current ATR > 80th percentile (percATR) to trade (tradeOk).
Impact: Ensures sufficient volatility for meaningful moves, filtering out low-volume chop.
Multi-Timeframe (HTF) Trend Filter:
Logic: Uses a 50-bar SMA on a higher timeframe (default: 60min). Longs require price > HTF MA (bullTrendOK), shorts < HTF MA (bearTrendOK).
Impact: Aligns trades with the bigger trend, reducing counter-trend losses.
US Session Filter:
Logic: Restricts trading to 9:30am–4:00pm ET (default: enabled, useSession = true) using America/New_York timezone.
Impact: Focuses on high-liquidity hours, avoiding overnight spreads and erratic moves.
Evolution:
- These filters create a robust signal pipeline, ensuring trades are timed for optimal conditions.
- Customizable inputs (e.g., zThreshold, atrPercentile) let traders adapt to their style without compromising quality.
3. Risk Management
The strategy’s risk controls are a masterclass in balancing aggression and safety, protecting capital in volatile markets.
Daily Loss Kill Switch:
Logic: Tracks daily loss (dayStartEquity - strategy.equity). Halts trading if loss ≥ $300 (default) and enabled (killSwitch = true, killSwitchActive).
Impact: Caps daily downside, crucial during events like April 27, 2025 ES slippage.
Rolling Drawdown Kill Switch:
Logic: Monitors drawdown (rollingPeak - strategy.equity) over 100 bars (default). Stops trading if > $1000 (rollingKill).
Impact: Prevents prolonged losing streaks, preserving capital for better setups.
Dynamic Stop-Loss and Take-Profit:
Logic: Stops = entry ± ATR * multiplier (default: 1.0x, stopDist). TPs = entry ± ATR * 1.5x (profitDist). Longs: stop below, TP above; shorts: vice versa.
Impact: Adapts to volatility, keeping stops tight but realistic, with TPs targeting 1.5:1 reward/risk.
Max Bars in Trade:
Logic: Closes trades after 8 bars (default) if not already exited.
Impact: Frees capital from stagnant trades, maintaining efficiency.
Kill Switch Buffer Dashboard:
Logic: Shows smallest buffer ($300 - daily loss or $1000 - rolling DD). Displays 0 (red) if kill switch active, else buffer (green).
Impact: Real-time risk visibility, letting traders adjust dynamically.
Why It’s Brilliant:
- Kill switches and ATR-based exits create a safety net, rare in generic scripts.
- Customizable risk inputs (maxDailyLoss, dynamicStopMult) suit different account sizes.
- Buffer metric empowers disciplined trading, a DAFE signature.
4. Trade Entry and Exit Logic
The entry/exit rules are precise, filtered, and adaptive, ensuring trades are deliberate and profitable.
Entry Conditions:
Long Entry: bullDiv2, cooldown passed (canSignal), ATR filter passed (tradeOk), in US session (inSession), no kill switches (not killSwitchActive, not rollingKill), z-score OK (zOk), HTF trend bullish (bullTrendOK), no existing long (lastDirection != 1, position_size <= 0). Closes shorts first.
Short Entry: Same, but for bearDiv2, bearTrendOK, no long (lastDirection != -1, position_size >= 0). Closes longs first.
Adaptive Cooldown: Default 2 bars (cooldownBars). Doubles (up to 10) after a losing trade, resets after wins (dynamicCooldown).
Exit Conditions:
Stop-Loss/Take-Profit: Set per trade (ATR-based). Exits on stop/TP hits.
Other Exits: Closes if maxBarsInTrade reached, ATR filter fails, or kill switch activates.
Position Management: Ensures no conflicting positions, closing opposites before new entries.
Built To Be Reliable and Consistent:
- Multi-filtered entries minimize false signals, a stark contrast to basic scripts.
- Adaptive cooldown prevents overtrading, especially after losses.
- Clean position handling ensures smooth execution, even in fast markets.
5. DAFE Visuals
The visuals are a DAFE hallmark, blending function with clean flair to make signals intuitive and charts stunning.
Aurora Bands:
Display: Bands around price during divergences (bullish: below low, bearish: above high), sized by ATR * bandwidth (default: 0.5).
Colors: Aqua (bullish), fuchsia (bearish), with transparency tied to divStrengthNorm.
Purpose: Highlights divergence zones with a glowing, futuristic vibe.
Divergence Orbs:
Display: Large/small circles (aqua below for bullish, fuchsia above for bearish) when bullDiv2/bearDiv2 and canSignal. Labels show strength (0–1).
Purpose: Pinpoints entries with eye-catching clarity.
Gradient Background:
Display: Green (bullish), red (bearish), or gray (neutral), 90–95% transparent.
Purpose: Sets the market mood without clutter.
Strategy Plots:
- Stop/TP Lines: Red (stops), green (TPs) for active trades.
- HTF MA: Yellow line for trend context.
- Z-Score: Blue step-line (if enabled).
- Kill Switch Warning: Red background flash when active.
What Makes This Next-Level?:
- Visuals make complex signals (divergences, filters) instantly clear, even for beginners.
- DAFE’s unique aesthetic (orbs, bands) sets it apart from generic scripts, reinforcing originality.
- Functional plots (stops, TPs) enhance trade management.
6. Metrics Dashboard
The top-right dashboard (2x8 table) is your command center, delivering real-time insights.
Metrics:
Daily Loss ($): Current loss vs. day’s start, red if > $300.
Rolling DD ($): Drawdown vs. 100-bar peak, red if > $1000.
ATR Threshold: Current percATR, green if ATR exceeds, red if not.
Z-Score: Current value, green if within threshold, red if not.
Signal: “Bullish Div” (aqua), “Bearish Div” (fuchsia), or “None” (gray).
Action: “Consider Buying”/“Consider Selling” (signal color) or “Wait” (gray).
Kill Switch Buffer ($): Smallest buffer to kill switch, green if > 0, red if 0.
Why This Is Important?:
- Consolidates critical data, making decisions effortless.
- Color-coded metrics guide beginners (e.g., green action = go).
- Buffer metric adds transparency, rare in off-the-shelf scripts.
7. Beginner Guide
Beginner Guide: Middle-right table (shown once on chart load), explains aqua orbs (bullish, buy) and fuchsia orbs (bearish, sell).
Key Features:
Futures-Optimized: Tailored for MNQ, NQ, MES, ES with point-value adjustments.
Highly Customizable: Inputs for lookback, sensitivity, filters, and risk settings.
Real-Time Insights: Dashboard and visuals update every bar.
Backtest-Ready: Fixed qty and tick calc for accurate historical testing.
User-Friendly: Guide, visuals, and dashboard make it accessible yet powerful.
Original Design: DAFE’s unique logic and visuals stand out from generic scripts.
How to Use
Add to Chart: Load on a 5min MNQ/ES chart in TradingView.
Configure Inputs: Adjust instrument, filters, or risk (defaults optimized for MNQ).
Monitor Dashboard: Watch signals, actions, and risk metrics (top-right).
Backtest: Run in strategy tester to evaluate performance.
Live Trade: Connect to a broker (e.g., Tradovate) for automation. Watch for slippage (e.g., April 27, 2025 ES issues).
Replay Test: Use bar replay (e.g., April 28, 2025 NQ drop) to test volatility handling.
Disclaimer
Trading futures involves significant risk of loss and is not suitable for all investors. Past performance is not indicative of future results. Backtest results may not reflect live trading due to slippage, fees, or market conditions. Use this strategy at your own risk, and consult a financial advisor before trading. Dskyz (DAFE) Trading Systems is not responsible for any losses incurred.
Backtesting:
Frame: 2023-09-20 - 2025-04-29
Fee Typical Range (per side, per contract)
CME Exchange $1.14 – $1.20
Clearing $0.10 – $0.30
NFA Regulatory $0.02
Firm/Broker Commis. $0.25 – $0.80 (retail prop)
TOTAL $1.60 – $2.30 per side
Round Turn: (enter+exit) = $3.20 – $4.60 per contract
Final Notes
The Dskyz (DAFE) Aurora Divergence – Quant Master isn’t just a strategy—it’s a movement. Crafted with originality and driven by community passion, it rises above the flood of generic scripts to deliver a system that’s as powerful as it is beautiful. With its quant-grade logic, DAFE visuals, and robust risk controls, it empowers traders to tackle futures with confidence and style. Join the DAFE crew, light up your charts, and let’s outsmart the markets together!
(This publishing will most likely be taken down do to some miscellaneous rule about properly displaying charting symbols, or whatever. Once I've identified what part of the publishing they want to pick on, I'll adjust and repost.)
Use it with discipline. Use it with clarity. Trade smarter.
**I will continue to release incredible strategies and indicators until I turn this into a brand or until someone offers me a contract.
Created by Dskyz, powered by DAFE Trading Systems. Trade fast, trade bold.

RSI+EMA+MZONES with DivergencesFeatures:
1. RSI Calculation:
Uses user-defined periods to calculate the RSI and visualize momentum shifts.
Plots key RSI zones, including upper (overbought), lower (oversold), and middle levels.
2. EMA of RSI:
Includes an Exponential Moving Average (EMA) of the RSI for trend smoothing and confirmation.
3. Bullish and Bearish Divergences:
Detects Regular divergences (labeled as “Bull” and “Bear”) for classic signals.
Identifies Hidden divergences (labeled as “H Bull” and “H Bear”) for potential trend continuation opportunities.
4. Customizable Labels:
Displays divergence labels directly on the chart.
Labels can be toggled on or off for better chart visibility.
5. Alerts:
Predefined alerts for both regular and hidden divergences to notify users in real time.
6. Fully Customizable:
Adjust RSI period, lookback settings, divergence ranges, and visibility preferences.
Colors and styles are easily configurable to match your trading style.
How to Use:
RSI Zones: Use RSI and its zones to identify overbought/oversold conditions.
EMA: Look for crossovers or confluence with divergences for confirmation.
Divergences: Monitor for “Bull,” “Bear,” “H Bull,” or “H Bear” labels to spot key reversal or continuation signals.
Alerts: Set alerts to be notified of divergence opportunities without constant chart monitoring.

Fisher+ [OSC]The Fisher Transform Indicator is classified as an oscillator, meaning that its value swings above and below a central point. This characteristic allows traders to identify overbought and oversold conditions, providing potential clues about market reversals. As mentioned previously, it is an oscillator so the strength of the move is displayed by how long the fisher line stays above/below zero. Indicator can be used to aid in confluence near supply/demand zones.
White Line = Fisher
Red/Blue Line = Moving Average
--Changes color whether fisher line is above/below the MA
Red/Blue Shaded Line = Moving Average
--Changes color based on a smoothing factor
Red/Blue Shaded Fill = Asset in Overbought/Oversold Conditions
Red/Blue Circles = Asset in Extreme Overbought/Oversold Conditions
Red/Blue Triangles = MACD Signals Below/Above "0"
Divergence Labels = Asset Signaling Divergence
The moving average line will turn red/blue as long as the fisher line is below/above the moving average. The shaded MA line will switch colors based on if it is moving in an up/down trend. The MA can also be used as a signal and treated similar to an oscillator. Market trending conditions will either keep the MA below/above the dashed zero line.
MACD code credited to LazyBear's MACD Leader indicator. It is used to filter out/confirm any signals such as divergences. As long as the MACD Leader line is above both the MACD line and signal lines then it'll signal with with a triangle. MACD divergences will be added at a later time.
