Gyspy Bot Trade Engine - V1.2B - Strategy 12-7-25 - SignalLynxGypsy Bot Trade Engine (MK6 V1.2B) - Ultimate Strategy & Backtest
Brought to you by Signal Lynx | Automation for the Night-Shift Nation 🌙
1. Executive Summary & Architecture
Gypsy Bot (MK6 V1.2B) is not merely a strategy; it is a massive, modular Trade Engine built specifically for the TradingView Pine Script environment. While most strategies rely on a single dominant indicator (like an RSI cross or a MACD flip) to generate signals, Gypsy Bot functions as a sophisticated Consensus Algorithm.
The engine calculates data from up to 12 distinct Technical Analysis Modules simultaneously on every bar closing. It aggregates these signals into a "Vote Count" and only executes a trade entry when a user-defined threshold of concurring signals is met. This "Voting System" acts as a noise filter, requiring multiple independent mathematical models—ranging from volume flow and momentum to cyclical harmonics and trend strength—to agree on market direction before capital is committed.
Beyond entries, Gypsy Bot features a proprietary Risk Management suite called the Dump Protection Team (DPT). This logic layer operates independently of the entry modules, specifically scanning for "Moon" (Parabolic) or "Nuke" (Crash) volatility events to force-exit positions, overriding standard stops to preserve capital during Black Swan events.
2. ⚠️ The Philosophy of "Curve Fitting" (Must Read)
One must be careful when applying Gypsy Bot to new pairs or charts.
To be fully transparent: Gypsy Bot is, by definition, a very advanced curve-fitting engine. Because it grants the user granular control over 12 modules, dozens of thresholds, and specific voting requirements, it is extremely easy to "over-fit" the data. You can easily toggle switches until the backtest shows a 100% win rate, only to have the strategy fail immediately in live markets because it was tuned to historical noise rather than market structure.
To use this engine successfully, you must adopt a specific optimization mindset:
Ignore Raw Net Profit: Do not tune for the highest dollar amount. A strategy that makes $1M in the backtest but has a 40% drawdown is useless.
Prioritize Stability: Look for a high Profit Factor (1.5+), a high Percent Profitable, and a smooth equity curve.
Regular Maintenance is Mandatory: Markets shift regimes (e.g., from Bull Trend to Crab Range). Parameters that worked perfectly in 2021 may fail in 2024. Gypsy Bot settings should be reviewed and adjusted at regular intervals (e.g., quarterly) to ensure the voting logic remains aligned with current market volatility.
Timeframe Recommendations:
Gypsy Bot is optimized for High Time Frame (HTF) trend following. It generally produces the most reliable results on charts ranging from 1-Hour to 12-Hours, with the 4-Hour timeframe historically serving as the "sweet spot" for most major cryptocurrency assets.
3. The Voting Mechanism: How Entries Are Generated
The heart of the Gypsy Bot engine is the ActivateOrders input (found in the "Order Signal Modifier" settings).
The engine constantly monitors the output of all enabled Modules.
Long Votes: GoLongCount
Short Votes: GoShortCount
If you have 10 Modules enabled, and you set ActivateOrders to 7:
The engine will ONLY trigger a Buy Entry if 7 or more modules return a valid "Buy" signal on the same closed candle.
If only 6 modules agree, the trade is rejected.
This allows you to mix "Leading" indicators (Oscillators) with "Lagging" indicators (Moving Averages) to create a high-probability entry signal that requires momentum, volume, and trend to all be in alignment.
4. Technical Deep Dive: The 12 Modules
Gypsy Bot allows you to toggle the following modules On/Off individually to suit the asset you are trading.
Module 1: Modified Slope Angle (MSA)
Logic: Calculates the geometric angle of a moving average relative to the timeline.
Function: It filters out "lazy" trends. A trend is only considered valid if the slope exceeds a specific steepness threshold. This helps avoid entering trades during weak drifts that often precede a reversal.
Module 2: Correlation Trend Indicator (CTI)
Logic: Based on John Ehlers' work, this measures how closely the current price action correlates to a straight line (a perfect trend).
Function: It outputs a confidence score (-1 to 1). Gypsy Bot uses this to ensure that we are not just moving up, but moving up with high statistical correlation, reducing fake-outs.
Module 3: Ehlers Roofing Filter
Logic: A sophisticated spectral filter that combines a High-Pass filter (to remove long-term drift) with a Super Smoother (to remove high-frequency noise).
Function: It attempts to isolate the "Roof" of the price action. It is excellent at catching cyclical turning points before standard moving averages react.
Module 4: Forecast Oscillator
Logic: Uses Linear Regression forecasting to predict where price "should" be relative to where it is.
Function: When the Forecast Oscillator crosses its zero line, it indicates that the regression trend has flipped. We offer both "Aggressive" and "Conservative" calculation modes for this module.
Module 5: Chandelier ATR Stop
Logic: A volatility-based trend follower that hangs a "leash" (ATR multiple) from the highest high (for longs) or lowest low (for shorts).
Function: Used here as an entry filter. If price is above the Chandelier line, the trend is Bullish. It also includes a "Bull/Bear Qualifier" check to ensure structural support.
Module 6: Crypto Market Breadth (CMB)
Logic: This is a macro-filter. It pulls data from multiple major tickers (BTC, ETH, and Perpetual Contracts) across different exchanges.
Function: It calculates a "Market Health" percentage. If Bitcoin is rising but the rest of the market is dumping, this module can veto a trade, ensuring you don't buy into a "fake" rally driven by a single asset.
Module 7: Directional Index Convergence (DIC)
Logic: Analyzes the convergence/divergence between Fast and Slow Directional Movement indices.
Function: Identifies when trend strength is expanding. A buy signal is generated only when the positive directional movement overpowers the negative movement with expanding momentum.
Module 8: Market Thrust Indicator (MTI)
Logic: A volume-weighted breadth indicator. It uses Advance/Decline data and Up/Down Volume data.
Function: This is one of the most powerful modules. It confirms that price movement is supported by actual volume flow. We recommend using the "SSMA" (Super Smoother) MA Type for the cleanest signals on the 4H chart.
Module 9: Simple Ichimoku Cloud
Logic: Traditional Japanese trend analysis using the Tenkan-sen and Kijun-sen.
Function: Checks for a "Kumo Breakout." Price must be fully above the Cloud (for longs) or below it (for shorts). This is a classic "trend confirmation" module.
Module 10: Simple Harmonic Oscillator
Logic: Analyzes the harmonic wave properties of price action to detect cyclical tops and bottoms.
Function: Serves as a counter-trend or early-reversal detector. It tries to identify when a cycle has bottomed out (for buys) or topped out (for sells) before the main trend indicators catch up.
Module 11: HSRS Compression / Super AO
Logic: Two options in one.
HSRS: Hirashima Sugita Resistance Support. Detects volatility compression (squeezes) relative to dynamic support/resistance bands.
Super AO: A combination of the Awesome Oscillator and SuperTrend logic.
Function: Great for catching explosive moves that result from periods of low volatility (consolidation).
Module 12: Fisher Transform (MTF)
Logic: Converts price data into a Gaussian normal distribution.
Function: Identifies extreme price deviations. This module uses Multi-Timeframe (MTF) logic to look at higher-timeframe trends (e.g., looking at the Daily Fisher while trading the 4H chart) to ensure you aren't trading against the major trend.
5. Global Inhibitors (The Veto Power)
Even if 12 out of 12 modules vote "Buy," Gypsy Bot performs a final safety check using Global Inhibitors. If any of these are triggered, the trade is blocked.
Bitcoin Halving Logic:
Hardcoded dates for past and projected future Bitcoin halvings (up to 2040).
Trading is inhibited or restricted during the chaotic weeks immediately surrounding a Halving event to avoid volatility crushes.
Miner Capitulation:
Uses Hash Rate Ribbons (Moving averages of Hash Rate).
If miners are capitulating (Shutting down rigs due to unprofitability), the engine flags a "Bearish" regime and can flip logic to Short-only or flat.
ADX Filter (Flat Market Protocol):
If the Average Directional Index (ADX) is below a specific threshold (e.g., 20), the market is deemed "Flat/Choppy." The bot will refuse to open trend-following trades in a flat market.
CryptoCap Trend:
Checks the total Crypto Market Cap chart. If the broad market is in a downtrend, it can inhibit Long entries on individual altcoins.
6. Risk Management & The Dump Protection Team (DPT)
Gypsy Bot separates "Entry Logic" from "Risk Management Logic."
Dump Protection Team (DPT)
This is a specialized logic branch designed to save the account during Black Swan events.
Nuke Protection: If the DPT detects a volatility signature consistent with a flash crash, it overrides all other logic and forces an immediate exit.
Moon Protection: If a parabolic pump is detected that violates statistical probability (Bollinger deviations), DPT can force a profit take before the inevitable correction.
Advanced Adaptive Trailing Stop (AATS)
Unlike a static trailing stop (e.g., "trail by 5%"), AATS is dynamic.
Penthouse Level: If price is at the top of the HSRS channel (High Volatility), the stop loosens to allow for wicks.
Dungeon Level: If price is compressed at the bottom, the stop tightens to protect capital.
Staged Take Profits
TP1: Scalp a portion (e.g., 10%) to cover fees and secure a win.
TP2: Take the bulk of profit.
TP3: Leave a "Runner" position with a loose trailing stop to catch "Moon" moves.
7. Recommended Setup Guide
When applying Gypsy Bot to a new chart, follow this sequence:
Set Timeframe: 4 Hours (4H).
Reset: Turn OFF Trailing Stop, Stop Loss, and Take Profits. (We want to see raw entry performance first).
Tune DPT: Adjust "Dump/Moon Protection" inputs first. These have the highest impact on net performance.
Tune Module 8 (MTI): This module is a heavy filter. Experiment with the MA Type (SSMA is recommended).
Select Modules: Enable/Disable modules 1-12 based on the asset's personality (Trending vs. Ranging).
Voting Threshold: Adjust ActivateOrders. A lower number = More Trades (Aggressive). A higher number = Fewer, higher conviction trades (Conservative).
Final Polish: Re-enable Stop Losses, Trailing Stops, and Staged Take Profits to smooth the equity curve and define your max risk per trade.
8. Technical Specs
Engine Version: Pine Script V6
Repainting: This strategy uses Closed Candle data for all Risk Management and Entry decisions. This ensures that Backtest results align closely with real-time behavior (no repainting of historical signals).
Alerts: This script generates Strategy alerts. If you require visual-only alerts, see the source code header for instructions on switching to "Study" (Indicator) mode.
Disclaimer:
This script is a complex algorithmic tool for market analysis. Past performance is not indicative of future results. Use this tool to assist your own decision-making, not to replace it.
9. About Signal Lynx
Automation for the Night-Shift Nation 🌙
Signal Lynx focuses on helping traders and developers bridge the gap between indicator logic and real-world automation. The same RM engine you see here powers multiple internal systems and templates, including other public scripts like the Super-AO Strategy with Advanced Risk Management.
We provide this code open source under the Mozilla Public License 2.0 (MPL-2.0) to:
Demonstrate how Adaptive Logic and structured Risk Management can outperform static, one-layer indicators
Give Pine Script users a battle-tested RM backbone they can reuse, remix, and extend
If you are looking to automate your TradingView strategies, route signals to exchanges, or simply want safer, smarter strategy structures, please keep Signal Lynx in your search.
License: Mozilla Public License 2.0 (Open Source).
If you make beneficial modifications, please consider releasing them back to the community so everyone can benefit.
"Divergence" için komut dosyalarını ara

ChronoPulse MS-MACD Resonance StrategyChronoPulse MS-MACD Resonance Strategy
A systematic trading strategy that combines higher-timeframe market structure analysis with dual MACD momentum confirmation, ATR-based risk management, and real-time quality assurance monitoring.
Core Principles
The strategy operates on the principle of multi-timeframe confluence, requiring agreement between:
Market structure breaks (CHOCH/BOS) on a higher timeframe
Dual MACD momentum confirmation (classic and crypto-tuned profiles)
Trend alignment via directional EMAs
Volatility and volume filters
Quality score composite threshold
Strategy Components
Market Structure Engine : Detects Break of Structure (BOS) and Change of Character (CHOCH) events using confirmed pivots on a configurable higher timeframe. Default structure timeframe is 240 minutes (4H).
Dual MACD Fusion : Requires agreement between two MACD configurations:
Classic MACD: 12/26/9 (default)
Fusion MACD: 8/21/5 (default, optimized for crypto volatility)
Both must agree on direction before trade execution. This can be disabled to use single MACD confirmation.
Trend Alignment : Uses two EMAs for directional bias:
Directional EMA: 55 periods (default)
Execution Trend Guide: 34 periods (default)
Both must align with trade direction.
ATR Risk Management : All risk parameters are expressed in ATR multiples:
Stop Loss: 1.5 × ATR (default)
Take Profit: 3.0 × ATR (default)
Trail Activation: 1.0 × ATR profit required (default)
Trail Distance: 1.5 × ATR behind price (default)
Volume Surge Filter : Optional gate requiring current volume to exceed a multiple of the volume SMA. Default threshold is 1.4× the 20-period volume SMA.
Quality Score Gate : Composite score (0-1) combining:
Structure alignment (0.0-1.0)
Momentum strength (0.0-1.0)
Trend alignment (0.0-1.0)
ATR volatility score (0.0-1.0)
Volume intensity (0.0-1.0)
Default threshold: 0.62. Trades only execute when quality score exceeds this threshold.
Execution Discipline : Trade budgeting system:
Maximum trades per session: 6 (default)
Cooldown bars between entries: 5 (default)
Quality Assurance Console : Real-time monitoring panel displaying:
Structure status (pass/fail)
Momentum confirmation (pass/fail)
Volatility readiness (pass/fail)
Quality score (pass/fail)
Discipline compliance (pass/fail)
Performance metrics (win rate, profit factor)
Net PnL
Certification requires: Win Rate ≥ 40%, Profit Factor ≥ 1.4, Minimum 25 closed trades, and positive net profit.
Integrity Suite : Optional validation panel that audits:
Configuration sanity checks
ATR data readiness
EMA hierarchy validity
Performance realism checks
Strategy Settings
strategy(
title="ChronoPulse MS-MACD Resonance Strategy",
shorttitle="ChronPulse",
overlay=true,
max_labels_count=500,
max_lines_count=500,
initial_capital=100000,
currency=currency.USD,
pyramiding=0,
commission_type=strategy.commission.percent,
commission_value=0.015,
slippage=2,
default_qty_type=strategy.percent_of_equity,
default_qty_value=2.0,
calc_on_order_fills=true,
calc_on_every_tick=true,
process_orders_on_close=true
)
Key Input Parameters
Structure Timeframe : 240 (4H) - Higher timeframe for structure analysis
Structure Pivot Left/Right : 3/3 - Pivot confirmation periods
Structure Break Buffer : 0.15% - Buffer for structure break confirmation
MACD Fast/Slow/Signal : 12/26/9 - Classic MACD parameters
Fusion MACD Fast/Slow/Signal : 8/21/5 - Crypto-tuned MACD parameters
Directional EMA Length : 55 - Primary trend filter
Execution Trend Guide : 34 - Secondary trend filter
ATR Length : 14 - ATR calculation period
ATR Stop Multiplier : 1.5 - Stop loss in ATR units
ATR Target Multiplier : 3.0 - Take profit in ATR units
Trail Activation : 1.0 ATR - Profit required before trailing
Trail Distance : 1.5 ATR - Distance behind price
Volume Threshold : 1.4× - Volume surge multiplier
Quality Threshold : 0.62 - Minimum quality score (0-1)
Max Trades Per Session : 6 - Daily trade limit
Cooldown Bars : 5 - Bars between entries
Win-Rate Target : 40% - Minimum for QA certification
Profit Factor Target : 1.4 - Minimum for QA certification
Minimum Trades for QA : 25 - Required closed trades
Signal Generation Logic
A trade signal is generated when ALL of the following conditions are met:
Higher timeframe structure shows bullish (CHOCH/BOS) or bearish structure break
Both MACD profiles agree on direction (if fusion enabled)
Price is above both EMAs for longs (below for shorts)
ATR data is ready and above minimum threshold
Volume exceeds threshold × SMA (if volume gate enabled)
Quality score ≥ quality threshold
Trade budget available (under max trades per day)
Cooldown period satisfied
Risk Management
Stop loss and take profit are set immediately on entry
Trailing stop activates after 1.0 ATR of profit
Trailing stop maintains 1.5 ATR distance behind highest profit point
Position sizing uses 2% of equity per trade (default)
No pyramiding (single position per direction)
Limitations and Considerations
The strategy requires sufficient historical data for higher timeframe structure analysis
Quality gate may filter out many potential trades, reducing trade frequency
Performance metrics are based on historical backtesting and do not guarantee future results
Commission and slippage assumptions (0.015% + 2 ticks) may vary by broker
The strategy is optimized for trending markets with clear structure breaks
Choppy or ranging markets may produce false signals
Crypto markets may require different parameter tuning than traditional assets
Optimization Notes
The strategy includes several parameters that can be tuned for different market conditions:
Quality Threshold : Lower values (0.50-0.60) allow more trades but may reduce average quality. Higher values (0.70+) are more selective but may miss opportunities.
Structure Timeframe : Use 240 (4H) for intraday trading, Daily for swing trading, Weekly for position trading
Volume Gate : Disable for low-liquidity pairs or when volume data is unreliable
Dual MACD Fusion : Disable for mean-reverting markets where single MACD may be more responsive
Trade Discipline : Adjust max trades and cooldown based on your risk tolerance and market volatility
Non-Repainting Guarantee
All higher timeframe data requests use lookahead=barmerge.lookahead_off to prevent repainting. Pivot detection waits for full confirmation before registering structure breaks. All visual elements (tables, labels) update only on closed bars.
Alerts
Three alert conditions are available:
ChronoPulse Long Setup : Fires when all long entry conditions are met
ChronoPulse Short Setup : Fires when all short entry conditions are met
ChronoPulse QA Certification : Fires when Quality Assurance console reaches CERTIFIED status
Configure alerts with "Once Per Bar Close" delivery to match the non-repainting design.
Visual Elements
Structure Labels : CHOCH↑, CHOCH↓, BOS↑, BOS↓ markers on structure breaks
Directional EMA : Orange line showing trend bias
Trailing Stop Lines : Green (long) and red (short) trailing stop levels
Dashboard Panel : Real-time status display (structure, MACD, ATR, quality, PnL)
QA Console : Quality assurance monitoring panel
Integrity Suite Panel : Optional validation status display
Recommended Usage
Forward test with paper trading before live deployment
Monitor the QA console until it reaches CERTIFIED status
Adjust parameters based on your specific market and timeframe
Respect the trade discipline limits to avoid over-trading
Review quality scores and adjust threshold if needed
Use appropriate commission and slippage settings for your broker
Technical Implementation
The strategy uses Pine Script v6 with the following key features:
Multi-timeframe data requests with lookahead protection
Confirmed pivot detection for structure analysis
Dynamic trailing stop management
Real-time quality score calculation
Trade budgeting and cooldown enforcement
Comprehensive dashboard and monitoring panels
All source code is open and available for review and modification.
Disclaimer
This script is for educational and informational purposes only. It is not intended as financial, investment, or trading advice. Past performance does not guarantee future results. Trading involves substantial risk of loss and is not suitable for all investors. Always conduct your own research and consult with a qualified financial advisor before making any trading decisions. The author and TradingView are not responsible for any losses incurred from using this strategy.

Sniper Perfect: Institutional Flow & Adaptive Risk ProtocolOverview Sniper Perfect is an advanced trend-following system designed to filter out "fakeouts" and institutional traps using a multi-layered verification protocol. It combines Volume Flow (VFI), Volatility (CHOP), and Momentum (RSI) to ensure entry only occurs in high-probability setups.
Key Features
🛡️ The Triple Filter Protocol
Strict Choppiness Filter: Uses a strict CHOP threshold (40). If the market is moving sideways, the algorithm locks all new entries to prevent whipsaws.
RSI Extremes Protection: Prevents FOMO buying at tops (Overbought > 70) and panic selling at bottoms (Oversold < 30).
Conflict Zone Detection: Identifies divergence between Price action and Money Flow. If price rises but institutional money exits, the background turns Gray and trading is disabled.
🔒 Adaptive Risk Management
Heat-Breathing Stop Loss: The SL distance adjusts dynamically based on market Volume and Volatility ("Heat").
Ratchet Mechanism: A mechanical lock ensures the Stop Loss can ONLY move in the direction of profit. It never loosens, guaranteeing that paper profits are protected.
📊 Live Dashboard A real-time panel in the bottom-right corner displays:
VFI Flow: Positive/Negative money flow.
Market Status: Active vs. Locked (Choppy).
RSI Status: Neutral, Overbought, or Oversold.
Visual Guide
🟢 Lime Zone: Clean Bullish Trend.
🔴 Red Zone: Clean Bearish Trend.
🟠 Orange Zone: High Choppiness (Stay Out).
🟣 'X' Marker: Exact price where the Stop Loss was triggered.
Disclaimer: For educational and research purposes only. Always manage your risk.

Sniper PerfectOverview Sniper Perfect is an advanced trend-following system designed to filter out "fakeouts" and institutional traps using a multi-layered verification protocol. It combines Volume Flow (VFI), Volatility (CHOP), and Momentum (RSI) to ensure entry only occurs in high-probability setups.
Key Features
🛡️ The Triple Filter Protocol
Strict Choppiness Filter: Uses a strict CHOP threshold (40). If the market is moving sideways, the algorithm locks all new entries to prevent whipsaws.
RSI Extremes Protection: Prevents FOMO buying at tops (Overbought > 70) and panic selling at bottoms (Oversold < 30).
Conflict Zone Detection: Identifies divergence between Price action and Money Flow. If price rises but institutional money exits, the background turns Gray and trading is disabled.
🔒 Adaptive Risk Management
Heat-Breathing Stop Loss: The SL distance adjusts dynamically based on market Volume and Volatility ("Heat").
Ratchet Mechanism: A mechanical lock ensures the Stop Loss can ONLY move in the direction of profit. It never loosens, guaranteeing that paper profits are protected.
📊 Live Dashboard A real-time panel in the bottom-right corner displays:
VFI Flow: Positive/Negative money flow.
Market Status: Active vs. Locked (Choppy).
RSI Status: Neutral, Overbought, or Oversold.
Visual Guide
🟢 Lime Zone: Clean Bullish Trend.
🔴 Red Zone: Clean Bearish Trend.
🟠 Orange Zone: High Choppiness (Stay Out).
🟣 'X' Marker: Exact price where the Stop Loss was triggered.
Disclaimer: For educational and research purposes only. Always manage your risk.

MACD with EMA FilterThis indicator combines the MACD (Moving Average Convergence Divergence) with an EMA-based trend filter to improve the quality of entry signals.
MACD identifies changes in momentum and potential trend reversals, while the EMA ensures that signals are taken only in the direction of the broader trend.

Strategy: HMA 50 + Supertrend SniperHMA 50 + Supertrend Confluence Strategy (Trend Following with Noise Filtering)
Description:
Introduction and Concept This strategy is designed to solve a common problem in trend-following trading: Lag vs. False Signals. Standard Moving Averages often lag too much, while price action indicators can generate false signals during choppy markets. This script combines the speed of the Hull Moving Average (HMA) with the volatility-based filtering of the Supertrend indicator to create a robust "Confluence System."
The primary goal of this script is not just to overlay two indicators, but to enforce a strict rule where a trade is only taken when Momentum (HMA) and Volatility Direction (Supertrend) are in perfect agreement.
Why this combination? (The Logic Behind the Mashup)
Hull Moving Average (HMA 50): We use the HMA because it significantly reduces lag compared to SMA or EMA by using weighted calculations. It acts as our primary Trend Direction detector. However, HMA can be too sensitive and "whipsaw" during sideways markets.
Supertrend (ATR-based): We use the Supertrend (Factor 3.0, Period 10) as our Volatility Filter. It uses Average True Range (ATR) to determine the significant trend boundary.
How it Works (Methodology) The strategy uses a boolean logic system to filter out low-quality trades:
Bullish Confluence: The HMA must be rising (Slope > 0) AND the Close Price must be above the Supertrend line (Uptrend).
Bearish Confluence: The HMA must be falling (Slope < 0) AND the Close Price must be below the Supertrend line (Downtrend).
The "Choppy Zone" (Noise Filter): This is a unique feature of this script. If the HMA indicates one direction (e.g., Rising) but the Supertrend indicates the opposite (e.g., Downtrend), the market is considered "Choppy" or indecisive. In this state, the script paints the candles or HMA line Gray and exits all positions (optional setting) to preserve capital.
Visual Guide & Signals To make the script easy to interpret for traders who do not read Pine Script, I have implemented specific visual cues:
Green Cross (+): Indicates a LONG entry signal. Both HMA and Supertrend align bullishly.
Red Cross (X): Indicates a SHORT entry signal. Both HMA and Supertrend align bearishly.
Thick Line (HMA): The main line changes color based on the trend.
Green: Bullish Confluence.
Red: Bearish Confluence.
Gray: Divergence/Choppy (No Trade Zone).
Thin Step Line: This is the Supertrend line, serving as your dynamic Trailing Stop Loss.
Strategy Settings
HMA Length: Default is 50 (Mid-term trend).
ATR Factor/Period: Default is 3.0/10 (Standard for trend catching).
Exit on Choppy: A toggle switch allowing users to decide whether to hold through noise or exit immediately when indicators disagree.
Risk Warning This strategy performs best in trending markets (Forex, Crypto, Indices). Like all trend-following systems, it may experience drawdown during prolonged accumulation/distribution phases. Please backtest with your specific asset before using it with real capital.

RC - Crypto Scalper v3Cryptocurrency scalping strategy for perpetual futures with risk management and automation capabilities.
## Strategy Overview
This strategy identifies high-probability scalping opportunities in cryptocurrency perpetual futures markets using adaptive position sizing, dynamic stop losses, and intelligent exit management to maintain consistent risk-adjusted returns across varying market conditions.
## Technical Foundation
The strategy employs exponential moving averages for trend detection, Bollinger Bands for volatility measurement and mean reversion signals, RSI for momentum confirmation and overbought/oversold conditions, ATR for dynamic volatility-based stop placement, and VWAP for institutional price level identification. These technical indicators are combined with volume analysis and optional multi-timeframe confirmation to filter low-probability setups.
## Entry Methodology
The strategy identifies trading opportunities using three complementary approaches that can be enabled individually or in combination:
Momentum-Based Entries: Detects directional price movements aligned with short-term and intermediate-term trend indicators, with momentum oscillator confirmation to avoid entries at exhaustion points. Volume analysis provides additional confirmation of institutional participation.
Mean Reversion Entries: Identifies price extremes using statistical volatility bands combined with momentum divergence, targeting high-probability reversal zones in ranging market conditions. Entries require initial price structure confirmation to reduce false signals.
Institutional Flow Entries: Monitors volume-weighted price levels to identify areas where institutional orders are likely concentrated, entering on confirmed breaks of these key levels with supporting directional bias from trend indicators.
Each methodology uses distinct combinations of the technical indicators mentioned above, with specific parameter relationships and confirmation requirements that can be customized based on trader preference and market conditions.
## Exit Framework
Adaptive Stop Loss: Uses ATR-based stops (default 0.7x multiplier on 14-period ATR) that automatically adjust to current market volatility. Stop distance expands during volatile periods to avoid premature stops while tightening during consolidation to protect capital. Alternative percentage-based stops available for traders preferring fixed-distance risk management.
Trailing Profit System: Employs a dual-target exit approach combining fixed limit orders with dynamic trailing stops. The system activates trailing stops when positions reach profitable thresholds, allowing winning trades to capture extended moves while protecting accumulated gains. The high fixed limit (6R default) serves as a ceiling for exceptional moves while the trailing mechanism handles the majority of exits at optimal profit levels.
Time-Based Management: Implements maximum holding period constraints (50 bars default) to prevent capital from being trapped in directionless price action. This ensures consistent capital turnover and prevents the strategy from holding through extended consolidation periods.
Breakeven Protection: Automatically adjusts stop loss to entry price plus commission costs once trades reach predefined profit thresholds (0.7R default), eliminating downside risk on positions that have demonstrated directional follow-through.
## Risk Management
Position Sizing: Dynamic position sizing based on account equity percentage risk model (2% default). Calculates optimal position size based on entry price, stop distance, and account risk tolerance. Includes maximum position exposure caps and minimum position size thresholds to ensure practical trade execution.
Daily Loss Limits: Automatic trading suspension when intraday losses exceed configured threshold (5% of equity default). Prevents catastrophic drawdown days and removes emotional decision-making during adverse market conditions. Resets automatically at the start of each new trading day.
Leverage Controls: Comprehensive leverage monitoring with built-in liquidation protection for margined positions. Strategy calculates liquidation prices based on leverage settings and automatically closes positions approaching critical margin levels, preventing forced liquidations.
Exposure Management: Multiple layers of position size controls including maximum position value as percentage of equity (50% default), leverage-adjusted margin requirements, and minimum capital availability thresholds before opening new positions.
## Market Filters
Session-Based Filtering: Configurable trading windows for Asian (00:00-08:00 UTC), London (08:00-16:00 UTC), and New York (13:00-21:00 UTC) sessions. Allows traders to focus on specific market hours or avoid illiquid periods based on their asset and trading style.
Volatility Requirements: Minimum and maximum ATR percentage thresholds ensure strategy only operates within optimal volatility ranges. Prevents trading during both insufficient movement periods and extreme volatility events where execution quality deteriorates.
Trend Alignment: Optional higher timeframe trend filter ensures directional bias aligns with broader market structure, reducing counter-trend entries during strong directional moves.
Volume Confirmation: Configurable volume requirements for entry validation, ensuring sufficient market participation and reducing false signals during low-liquidity periods.
## Automation Support
Built-in webhook integration generates JSON payloads compatible with popular broker automation platforms. Alert system provides comprehensive notifications for all entry signals, exit executions, risk limit breaches, and daily trading status updates. Supports both automated and manual execution workflows.
## Settings Explanation
Initial Capital: $5,000
Selected as realistic starting point for retail traders entering crypto futures markets. Strategy scales proportionally - larger accounts show similar percentage returns with proportionally larger absolute gains and position sizes.
Risk Per Trade: 2%
Conservative default providing significant drawdown tolerance. With 51% historical win rate and positive expectancy, risking 2% per trade allows for extended losing streaks without account impairment. Adjustable from 0.5% (very conservative) to 5% (aggressive, experienced traders only).
Leverage: 10x
Standard cross-margin leverage for cryptocurrency perpetual futures. Combined with 2% risk setting and maximum 50% equity position size caps, actual exposure remains controlled despite leverage. Built-in liquidation protection provides additional safety layer.
Commission: 0.055%
Modeled on major exchange maker fee structures (Bybit, Binance Futures).
**Slippage: 50 ticks**
Ultra-conservative slippage assumption representing extreme worst-case execution scenarios. ETH perpetual tick size is $0.01, therefore 50 ticks equals $0.50 per side or $1.00 round trip slippage per trade.
Real-world slippage on 30-minute timeframe typically ranges from 2-5 ticks ($0.02-0.05 round trip) under normal conditions, with 10-20 ticks during highly volatile periods. The 50-tick setting assumes every single trade executes during extreme market stress conditions.
This ultra-conservative modeling approach means real-world trading performance under typical market conditions may exceed backtest results, as the strategy has been tested under punishing execution cost assumptions that represent worst-case scenarios rather than expected outcomes.
Stop Loss: ATR-based (0.7x multiplier)
Volatility-adaptive stops optimized for 30-minute cryptocurrency perpetuals. The 0.7x multiplier balances protection against premature stops due to normal market noise. Lower multipliers (0.5-0.6x) suitable for lower timeframes, higher multipliers (0.8-1.2x) for higher timeframes.
Take Profit: 6R (Risk:Reward)
High target designed to work in conjunction with trailing stop system rather than as primary exit mechanism. Historical analysis shows most profitable trades exit via trailing stops at lower multiples, with the 6R limit capturing occasional extended moves. This configuration allows the trailing stop system to operate optimally while providing upside capture on exceptional price runs.
Trailing Stop: Activates at 1R | Offset 0.5R
Trailing mechanism engages when position reaches 1:1 risk-reward, then maintains 0.5R distance from peak favourable price. This configuration allows profitable trades room to develop while protecting accumulated gains from reversals.
Maximum Holding Period: 50 bars
Automatic exit trigger after 50 bars (25 hours on 30-minute timeframe) prevents capital commitment to non-trending price action. Adjustable based on timeframe and trading style preferences.
## Backtest Performance
Test Period: November 2023 - November 2025 (2 years)
Asset: ETH/USDT Perpetual Futures
Timeframe: 30 minutes
Initial Capital: $5,000
Performance Metrics:
- Final Equity: $25,353.99
- Net Profit: $20,353.99
- Total Return: 407.08%
- Annualized Return: ~204%
- Total Trades: 2,549
- Winning Trades: 1,308 (51.28%)
- Losing Trades: 1,241 (48.72%)
- Profit Factor: 1.215
- Sharpe Ratio: 0.813
- Sortino Ratio: 6.428
- Maximum Drawdown: 11.53%
- Average Drawdown: <2%
Trade Statistics:
- Average Win: 1.15% per trade
- Average Loss: -0.98% per trade
- Win/Loss Ratio: 1.17:1
- Largest Win: 7.14%
- Largest Loss: -2.31%
- Average Trade Duration: ~8 hours
- Trades Per Month: ~106
Cost Analysis:
- Total Commission Paid: $21,277.06
- Commission as % of Gross Profit: 18.5%
- Modeled Slippage Impact: $2,549.00 (50 ticks per trade)
- Total Trading Costs: $23,826.06
- Net Profit After All Costs: $20,353.99
Risk-Adjusted Performance:
- Return/Max DD Ratio: 35.3
- Profit Per Trade: $7.98 average
- Risk of Ruin: <0.001% (with 2% risk, 51% win rate, 1.17 R:R)
## Bear Market Validation
To validate robustness across different market conditions, the strategy was additionally tested during the 2022 cryptocurrency bear market:
Test Period: May 2022 - November 2022 (7 months)
Market Conditions: ETH declined 57% (from ~$2,900 to ~$1,200)
Bear Market Results:
- Net Profit: $4,959.69
- Return: 99.19%
- Total Trades: 845
- Win Rate: 51.72%
- Maximum Drawdown: 18.54%
- Profit Factor: 1.235
- Outperformance vs Buy & Hold: +156.3%
The strategy demonstrated profitable performance during severe market decline, with short positions showing particular strength (54.1% win rate on shorts vs 49.4% on longs). This validates that the edge is not dependent on bullish market conditions and the multiple entry methodologies adapt naturally to different market environments.
## Recommended Usage
Optimal Timeframes:
- Primary: 30-minute (tested and optimized)
- Alternative: 1-hour (more selective, fewer trades)
- Not recommended: <15-minute (execution quality deteriorates)
Suitable Assets:
High-liquidity cryptocurrency perpetual futures recommended:
- BTC/USDT (>$2B daily volume)
- ETH/USDT (>$1B daily volume)
- SOL/USDT, AVAX/USDT (>$100M daily volume)
- Avoid low-liquidity pairs (<$50M daily volume)
Risk Configuration:
- Conservative: 1-1.5% per trade
- Moderate: 2-3% per trade (default: 2%)
- Aggressive: 3-5% per trade (requires discipline)
## Important Considerations
Backtesting vs Live Trading: Always paper trade first. Real-world results vary based on execution quality, broker-specific factors, network latency, and individual trade management decisions. Backtest performance represents historical simulation with ultra-conservative cost assumptions, not guaranteed future results.
Market Conditions: Strategy designed for liquid, actively-traded markets. Performance characteristics:
- Strong trends: Optimal (trailing stops capture extended moves)
- Ranging markets: Moderate (mean reversion component provides edge)
- Low volatility: Reduced (ATR filter prevents most entries)
- Extreme volatility: Protected (maximum volatility filter prevents entries)
Cost Impact: Commission represents approximately 18.5% of gross profit in backtests. The 50-tick slippage assumption is deliberately punitive - typical execution will likely be 5-10x better (2-10 ticks actual vs 50 ticks modeled), meaning real-world net results may significantly exceed backtest performance under normal market conditions.
Execution Quality: 30-minute timeframe provides sufficient time for order placement and management. Automated execution recommended for consistency. Manual execution requires discipline to follow signals without hesitation or second-guessing.
Starting Procedures:
1. Run backtest on your specific asset and timeframe
2. Paper trade for minimum 50 trades or 2 weeks
3. Start with minimum position sizes (0.5-1% risk)
4. Gradually scale to target risk levels as confidence builds
5. Monitor actual execution costs vs backtest assumptions
## Strategy Limitations
- Requires liquid markets; performance degrades significantly on low-volume pairs
- No built-in news event calendar; traders should manually avoid scheduled high-impact events
- Weekend/holiday trading may experience wider spreads and different price behaviour
- Does not model spread costs (assumes mid-price fills); add 1-2 ticks additional cost for market orders
- Performance during market structure changes (regime shifts) may differ from backtest period
- Requires consistent monitoring during active trading hours for optimal automated execution
- Slippage assumptions are deliberately extreme; actual slippage will typically be much lower
## Risk Disclosure
Cryptocurrency trading involves substantial risk of loss. Leverage amplifies both gains and losses. This strategy will experience losing streaks and drawdowns. The 11.53% maximum historical drawdown in bull market testing and 18.54% in bear market testing do not represent ceilings - larger drawdowns are possible and should be expected in live trading.
Past performance does not guarantee future results. Market conditions evolve, and historical edge may diminish or disappear. No strategy works in all market conditions. The strategy has been tested with extremely conservative slippage assumptions (50 ticks per trade) that significantly exceed typical execution costs; this provides a safety margin but does not eliminate risk.
Capital at Risk: Only trade with capital you can afford to lose completely. The strategy's positive historical performance across both bull and bear markets does not eliminate the possibility of significant losses or account impairment.
Not Financial Advice: This strategy is an educational tool, not investment advice. Users are solely responsible for their trading decisions, risk management, and outcomes. The developer assumes no liability for trading losses.
Leverage Warning: Trading with leverage can result in losses exceeding initial investment. Ensure you understand leverage mechanics and liquidation risks before using leveraged products.
## Technical Requirements
- TradingView Premium subscription (for strategy testing and alerts)
- Understanding of risk management principles
- Familiarity with perpetual futures mechanics
- Broker account supporting crypto perpetuals (if trading live)
- For automation: Webhook-compatible execution platform
## Version History
v3.0 - November 2025 (Initial Release)
- Multi-methodology entry system (Momentum, Mean Reversion, VWAP)
- Comprehensive risk management framework
- Adaptive exit system with trailing stops
- Session and volatility filtering
- Webhook automation support
- Validated across bull market (2024-25) and bear market (2022) periods
- Tested with ultra-conservative 50-tick slippage assumptions
Disclaimer: This strategy is provided "as-is" for educational purposes. Past performance does not indicate future results. All backtests conducted with 50-tick slippage (ultra-conservative assumptions). Actual trading costs typically significantly lower. Trade responsibly and at your own risk.

Quasimodo Pattern Strategy Back Test [TradingFinder] QM Trading🔵 Introduction
The QM pattern, also known as the Quasimodo pattern, is one of the popular patterns in price action, and it is often used by technical analysts. The QM pattern is used to identify trend reversals and provides a very good risk-to-reward ratio. One of the advantages of the QM pattern is its high frequency and visibility in charts.
Additionally, due to its strength, it is highly profitable, and as mentioned, its risk-to-reward ratio is very good. The QM pattern is highly popular among traders in supply and demand, and traders also use this pattern.
The Price Action QM pattern, like other Price Action patterns, has two types: Bullish QM and Bearish QM patterns. To identify this pattern, you need to be familiar with its types to recognize it.
🔵 Identifying the QM Pattern
🟣 Bullish QM
In the bullish QM pattern, as you can see in the image below, an LL and HH are formed. As you can see, the neckline is marked as a dashed line. When the price reaches this range, it will start its upward movement.
🟣 Bearish QM
The Price Action QM pattern also has a bearish pattern. As you can see in the image below, initially, an HH and LL are formed. The neckline in this image is the dashed line, and when the LL is formed, the price reaches this neckline. However, it cannot pass it, and the downward trend resumes.
🔵 How to Use
The Quasimodo pattern is one of the clearest structures used to identify market reversals. It is built around the concept of a structural break followed by a pullback into an area of trapped liquidity. Instead of relying on lagging indicators, this pattern focuses purely on price action and how the market reacts after exhausting one side of liquidity. When understood correctly, it provides traders with precise entry points at the transition between trend phases.
🟣 Bullish Quasimodo
A bullish Quasimodo forms after a clear downtrend when sellers start losing control. The market continues to make lower lows until a sudden higher high appears, signaling that buyers are entering with strength. Price then pulls back to retest the previous low, creating what is known as the Quasimodo low.
This area often becomes the final trap for sellers before the market shifts upward. A visible rejection or displacement from this zone confirms bullish momentum. Traders usually place entries near this level, stops below the low, and targets at previous highs or the next resistance zone. Combining the setup with demand zones or Fair Value Gaps increases its accuracy.
🟣 Bearish Quasimodo
A bearish Quasimodo forms near the top of an uptrend when buyers begin to lose strength. The market continues to make higher highs until a sudden lower low breaks the bullish structure, showing that selling pressure is entering the market. Price then retraces upward to retest the previous high, forming the Quasimodo high, where breakout buyers are often trapped.
Once rejection appears at this level, it indicates a likely reversal. Traders can enter short near this area, with stop-losses placed above the high and targets near the next support or previous lows. The setup gains more reliability when aligned with supply zones, SMT divergence, or bearish Fair Value Gaps.
🔵 Setting
Pivot Period : You can use this parameter to use your desired period to identify the QM pattern. By default, this parameter is set to the number 5.
Take Profit Mode : You can choose your desired Take Profit in three ways. Based on the logic of the QM strategy, you can select two Take Profit levels, TP1 and TP2. You can also choose your take profit based on the Reward to Risk ratio. You must enter your desired R/R in the Reward to Risk Ratio parameter.
Stop Loss Refine : The loss limit of the QM strategy is based on its logic on the Head pattern. You can refine it using the ATR Refine option to prevent Stop Hunt. You can enter your desired coefficient in the Stop Loss ATR Adjustment Coefficient parameter.
Reward to Risk Ratio : If you set Take Profit Mode to R/R, you must enter your desired R/R here. For example, if your loss limit is 10 pips and you set R/R to 2, your take profit will be reached when the price is 20 pips away from your entry point.
Stop Loss ATR Adjustment Coefficient : If you set Stop Loss Refine to ATR Refine, you must adjust your loss limit coefficient here. For example, if your buy position's loss limit is at the price of 1000, and your ATR is 10, if you set Stop Loss ATR Adjustment Coefficient to 2, your loss limit will be at the price of 980.
Entry Level Validity : Determines how long the Entry level remains valid. The higher the level, the longer the entry level will remain valid. By default it is 2 and it can be set between 2 and 15.
🔵 Results
The following examples show the backtest results of the Quasimodo (QM) strategy in action. Each image is based on specific settings for the symbol, timeframe, and input parameters, illustrating how the QM logic can generate signals under different market conditions. The detailed configuration for each backtest is also displayed on the image.
⚠ Important Note : Even with identical settings and the same symbol, results may vary slightly across different brokers due to data feed variations and pricing differences.
Default Properties of Backtests :
OANDA:XAUUSD | TimeFrame: 5min | Duration: 1 Year :
BINANCE:BTCUSD | TimeFrame: 5min | Duration: 1 Year :
CAPITALCOM:US30 | TimeFrame: 5min | Duration: 1 Year :
NASDAQ:QQQ | TimeFrame: 5min | Duration: 5 Year :
OANDA:EURUSD | TimeFrame: 5min | Duration: 5 Year :
PEPPERSTONE:US500 | TimeFrame: 5min | Duration: 5 Year :

AnkeAlgo A68 strategy™ || AnkeAlgo®[16.6]## ✅ Multi-Timeframe Trend Strategy Based on MFI and Momentum Factors
### 📌 Overview
This strategy combines **Money Flow Index (MFI)** and **Momentum** to identify trend continuation and momentum reversal opportunities in the crypto market. It focuses on volume-weighted capital flow and price strength, generating trend-biased signals suitable for swing and intraday traders.
---
### 📊 Technical Indicators Used
| Indicator | Purpose |
|-----------|---------|
| **MFI (Money Flow Index)** | Detects capital inflow/outflow and filters range-bound markets |
| **Momentum Indicator** | Measures price acceleration and confirms breakout strength |
| **Optional: ATR / EMA Filters** | Can be added for volatility stop or trend validation |
---
### ⚙️ Core Logic
- **Trend Confirmation**: MFI exceeds threshold and aligns with price direction
- **Momentum Entry Trigger**: Trades are executed only when momentum crosses a signal level
- **Noise Filter**: Avoids entries when MFI divergence or momentum weakness is detected
- **Position Management**: Supports ATR-based or percentage-based stop-loss systems
---
### 🪙 Market and Asset
✅ Designed for crypto derivatives
**Recommended symbol:** `ETHUSDT.P` (Perpetual Futures)
---
### ⏱️ Recommended Timeframes
- 30-minute
- 45-minute
- 1-hour
> The **45m timeframe** shows the most stable performance in forward testing.
---
### 📈 Strategy Features
- Performs best during trending and high-momentum phases
- Low overfitting risk, adaptable across different volatility environments
- Can be used as a signal engine for grid, martingale, or multi-asset systems
- Easily extendable to BTC, SOL, BNB, and other high-liquidity assets
---
### ⚠️ Risk Disclaimer
- This is **not** a mean-reversion strategy and may produce false signals in sideways markets
- Stop-loss management and position sizing are required for live deployment
- Backtest results do not guarantee live trading performance due to slippage and trading fees
---

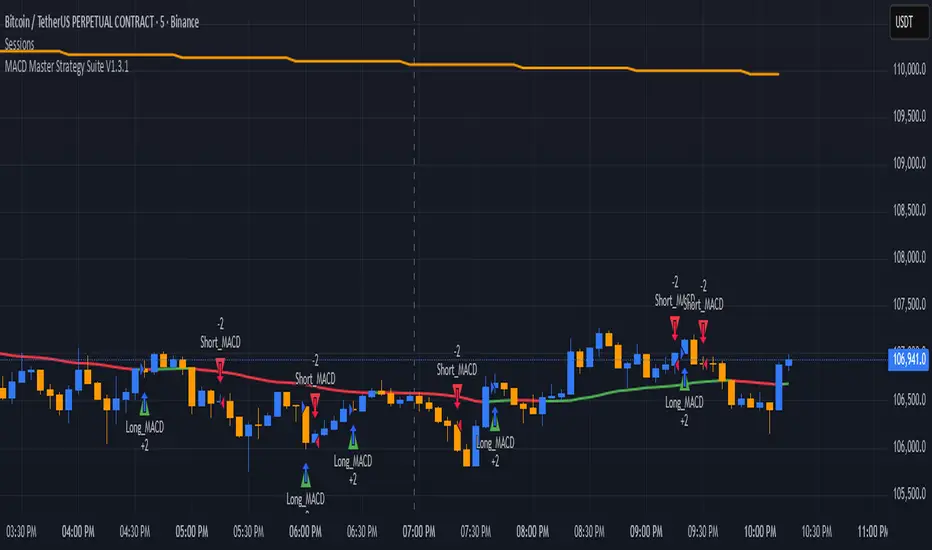
MACD Master Strategy Suite🧩 Overview
The MACD Master Strategy Suite is not a basic MACD crossover system, but a complete backtesting tool designed for traders who want to explore and optimize MACD-based logic.
This suite offers a host of configurable options that transform the standard MACD into a powerful research framework. You can test multiple entry styles, apply trend filters, run contrarian setups, and study seasonality — all from one script.
⚙️ Key Features
Multiple MACD entry modes: classic cross, zero-line flip, pullback, momentum burst, divergence, and more.
Dual-EMA trend filter with optional Contrarian Mode.
Higher-timeframe trend confirmation.
Calendar filters for weekday, month, and day-of-month testing.
Realistic trade management: stop/target exits, cooldowns, and same-bar recalculation guard.
Adjustable position sizing and leverage for accurate SPY-style backtests.
🧠 How It Differs From TradingView’s Built-In MACD Strategy
The built-in MACD strategy uses only histogram zero-cross entries with no filters or risk controls.
The MACD Master Strategy Suite expands this into a fully modular testing environment, allowing you to analyze how different MACD behaviors perform under diverse market conditions — turning MACD from a simple signal into a measurable system.
⚖️ Disclaimer
For research and educational use only. This script does not constitute financial advice or guarantee performance.

Weekend Hunter Ultimate v6.2 Weekend Hunter Ultimate v6.2 - Automated Crypto Weekend Trading System
OVERVIEW:
Specialized trading strategy designed for cryptocurrency weekend markets (Saturday-Sunday) when institutional traders are typically offline and market dynamics differ significantly from weekdays. Optimized for 15-minute timeframe execution with multi-timeframe confluence analysis.
KEY FEATURES:
- Weekend-Only Trading: Automatically activates during configurable weekend hours
- Dynamic Leverage: 5-20x leverage adjusted based on market safety and signal confidence
- Multi-Timeframe Analysis: Combines 4H trend, 1H momentum, and 15M execution
- 10 Pre-configured Crypto Pairs: BTC, ETH, LINK, XRP, DOGE, SOL, AVAX, PEPE, TON, POL
- Position & Risk Management: Max 4 concurrent positions, -30% account protection
- Smart Trailing Stops: Protects profits when approaching targets
RISK MANAGEMENT:
- Maximum daily loss: 5% (configurable)
- Maximum weekend loss: 15% (configurable)
- Per-position risk: Capped at 120-156 USDT
- Emergency stops for flash crashes (8% moves)
- Consecutive loss protection (4 losses = pause)
TECHNICAL INDICATORS:
- CVD (Cumulative Volume Delta) divergence detection
- ATR-based dynamic stop loss and take profit
- RSI, MACD, Bollinger Bands confluence
- Volume surge confirmation (1.5x average)
- Weekend liquidity adjustments
INTEGRATION:
- Designed for Bybit Futures (0.075% taker fee)
- WunderTrading webhook compatibility via JSON alerts
- Minimum position size: 120 USDT (Bybit requirement)
- Initial capital: $500 recommended
TARGET METRICS:
- Win rate target: 65%
- Average win: 5.5%
- Average loss: 1.8%
- Risk-reward ratio: ~3:1
IMPORTANT DISCLAIMERS:
- Past performance does not guarantee future results
- Leveraged trading carries substantial risk of loss
- Weekend crypto markets have 13% of normal liquidity
- Not suitable for traders who cannot afford to lose their entire investment
- Requires continuous monitoring and adjustment
USAGE:
1. Apply to 15-minute charts only
2. Configure weekend hours for your timezone
3. Set up webhook alerts for automation
4. Monitor performance table in top-right corner
5. Adjust parameters based on your risk tolerance
This is an experimental strategy for educational purposes. Always test with small amounts first and never invest more than you can afford to lose completely.

AlphaFlow — Direcional Pro [Strategy] — Risk % & Dynamic EquityAlphaFlow is a directional strategy designed to capture trend shifts using a dual moving average system, enhanced with RSI and ATR regime filters, and a long-term EMA filter for confirmation.
Key Features
Dynamic Position Sizing: Risk per trade is based on a fixed % of account equity, with optional dynamic equity growth.
Stop-Loss Options: Choose between ATR-based stop or swing-point stop.
Trade Management:
TP1 is placed at a user-defined risk multiple (R).
Once TP1 is hit, an optional ATR trailing stop activates until TP2 is reached or the stop is triggered.
Visual Tools: Fast/slow EMAs, long EMA, ATR channels, and optional divergence markers for context (do not affect entries).
Backtest Ready: Includes configurable commission, capital, and position sizing.
Use Case
This strategy is built for traders who want systematic trend-following entries with structured risk management. Its modular inputs allow adaptation across assets and timeframes.
⚠️ Disclaimer: Past performance does not guarantee future results. Always validate parameters before live use.

EMA inFusion Pro - Multiple SourcesEMA Fusion Pro: Dynamic Trend & Momentum Strategy with Three Exit Modes
EMA Fusion Pro is a highly customizable, multi-exit trend-following strategy designed for traders who value both precision and flexibility. By leveraging exponential moving averages (EMA), average directional index (ADX), and volume analysis, this strategy aims to capture trending market moves while offering three distinct exit modes for optimal risk management across varying market conditions.
Strategy Overview
This strategy systematically identifies potential entry points using a moving average crossover with highly configurable data sources (including price, volume, rate of change, or their Heikin Ashi versions) and filters signal quality with ADX trend strength and volume spikes. Each trade is managed with one of three advanced exit methodologies—reverse signal, ATR-based stop/take profit, or fixed percentage—giving you the control to adapt your risk profile to different market regimes.
Key Features
Customizable EMA Source: Calculate the core trend-filtering EMA from price (default), volume, rate of change, or their Heikin Ashi counterparts for unique market perspectives.
Trend Filter with ADX: Confirm entries only when the trend is strong, as measured by the user-adjustable ADX threshold.
Volume Spike Confirmation: Optional filter to only take trades with above-average volume activity, reducing false signals.
Three Exit Modes:
Reverse Signal: Exit trades when a new, opposite entry signal occurs.
ATR-Based Stop/Take Profit: Dynamic risk management using multiples of the average true range (ATR) for both take profit and stop loss.
Percent-Based Stop/Take Profit: Fixed-percentage risk management with user-defined thresholds.
Visual Annotations: Signal markers, EMA line color-coded by source, trend background coloring, and optional ATR/percent-based TP/SL levels.
Info Panel: Real-time display of all core indicators, current trading mode, exit parameters, and position status for quick oversight.
How It Works
Entry Logic: A crossover signal (above/below the EMA) triggers a new entry, but only if both ADX trend strength and (optionally) volume spike conditions are met.
Exit Logic: Three selectable modes allow you to exit trades on reverse signals, at a dynamic ATR-based profit or loss, or at a fixed percentage gain/loss.
Flexible Data Analysis: The EMA source can be chosen from six options—standard price, volume, rate of change, or their Heikin Ashi variants—allowing experimentation with different market dimensions.
Risk Management: All exits are precisely controlled, either by the next opposing signal, by volatility-adjusted levels, or by fixed risk/reward ratios.
Backtest & Optimization: The strategy is fully backtestable within TradingView’s Strategy Tester, with adjustable parameters for optimization.
Customization & Usage
Indicator Source: Select your preferred data type for EMA calculation, opening the door to creative strategy variations (e.g., volume momentum, pure price trend, rate of change divergence).
Filter Toggles: Enable/disable ADX and volume filters as desired—useful for different market environments.
Exit Mode Selection: Switch between reverse, ATR, or percent-based exits with a single parameter—ideal for adapting to ranging vs. trending markets.
Visual Clarity: The EMA line color reflects its underlying source, and the info panel summarizes all critical values for easy monitoring.
Who Should Use This Strategy?
Trend Followers seeking to ride strong moves with multiple exit options.
Experienced Traders who want to experiment with different data types (volume, momentum, Heikin Ashi) for trend analysis.
Algorithmic Traders looking for a robust, flexible base to build upon with their own ideas.
Getting Started
Apply the script to your chart and review default settings.
Customize parameters—EMA length, ADX threshold, volume settings, exit type—as desired.
Backtest on multiple instruments and timeframes to evaluate performance.
Optimize filters, exit rules, and risk parameters for your preferred trading style.
Monitor with the real-time info panel and trade alerts.
Disclaimer
This script is for educational and entertainment purposes only. It is not financial advice. Past performance is not indicative of future results. Always conduct thorough testing and consider your risk tolerance before trading real capital.
— Happy Trading —
Feel free to adapt, share, and contribute to this open-source strategy!

EMA and BB Analysis for US100 V250829This TradingView strategy generates buy and sell signals based on exponential moving average (EMA) crossovers, limited by other factors such as Bollinger Bands, volume, and EMA distance.
It uses EMAs of 16, 24, 32, and 64 periods, as well as the angles of each of these EMAs.
Entry Conditions:
EMA Crossover Entry:
When EMA16 crosses EMA64 and the following conditions are met:
EMA16, EMA24, EMA32 are aligned — for a buy signal:
EMA16 > EMA24
EMA24 > EMA32
EMA32 > EMA48
(and the opposite for a sell signal)
EMA Angles:
The angles of the EMAs must also follow the same alignment.
Divergence Entry:
When the distance between EMAs 16, 24, 32, and 48 increases.
Entry Limitations:
Once an entry is detected, it is filtered by several conditions:
When the distance between the entry candle and EMA96 is more than two candles of the maximum size over three periods.
The stop loss is set as two candles of the maximum size over three periods. If this stop loss exceeds 6,000 points (adjustable parameter), the entry is invalid.
When the price is at the edge of the Bollinger Band with a 1200-period setting (equivalent to a 1-hour Bollinger Band).
When the Bollinger Band's middle line is descending and a buy signal is triggered (and vice versa).
When volume drops below a certain threshold.
When a sideways market movement is detected.
All these entry limitations are configurable parameters and can be enabled or disabled.

MACD StrategyOverview
The "MACD Strategy" is a straightforward trading strategy tested for BTCUSDT Futures on the 1-minute timeframe, leveraging the Moving Average Convergence Divergence (MACD) indicator to identify momentum-based buy and sell opportunities. Developed with input from expert trading analyst insights, this strategy combines technical precision with risk management, making it suitable for traders of all levels on platforms like TradingView. It focuses on capturing trend reversals and momentum shifts, with clear visual cues and automated alerts for seamless integration with trading bots (e.g., Bitget webhooks).
#### How It Works
This strategy uses the MACD indicator to generate trading signals based on momentum and trend direction:
- **Buy Signal**: Triggered when the MACD line crosses above the signal line, and the MACD histogram turns positive (above zero). This suggests increasing bullish momentum.
- **Sell Signal**: Triggered when the MACD line crosses below the signal line, and the MACD histogram turns negative (below zero), indicating growing bearish momentum.
Once a signal is detected, the strategy opens a position (long for buy, short for sell) with a position size calculated based on your risk tolerance. It includes a stop-loss to limit losses and a take-profit to lock in gains, both dynamically adjusted using the Average True Range (ATR) for adaptability to market volatility.
#### Key Features
- **MACD-Based Signals**: Relies solely on MACD for entry points, plotted in a separate pane for clear momentum analysis.
- **Risk Management**: Automatically calculates position size based on a percentage of your account balance and sets stop-loss and take-profit levels using ATR multipliers and a risk:reward ratio.
- **Visual Feedback**: Plots entry, stop-loss, and take-profit lines on the chart with labeled markers for easy tracking.
- **Alerts**: Includes Bitget webhook-compatible alerts for automated trading, notifying you of buy and sell signals in real-time.
#### Input Parameters
- **Account Balance**: Default 10000 – Set your initial trading capital to determine position sizing.
- **MACD Fast Length**: Default 12 – The short-term EMA period for MACD sensitivity.
- **MACD Slow Length**: Default 26 – The long-term EMA period for MACD calculation.
- **MACD Signal Length**: Default 9 – The smoothing period for the signal line.
- **Risk Per Trade (%)**: Default 3.0 – The percentage of your account balance risked per trade (e.g., 3% of 10000 = 300).
- **Risk:Reward Ratio**: Default 3.0 – The ratio of potential profit to risk (e.g., 3:1 means risking 1 to gain 3).
- **SL Multiplier**: Default 1.0 – Multiplies ATR to set the stop-loss distance (e.g., 1.0 x ATR).
- **TP Multiplier**: Default 3.0 – Multiplies ATR to set the take-profit distance, adjusted by the risk:reward ratio.
- **Line Length (bars)**: Default 25 – Duration in bars for displaying trade lines on the chart.
- **Label Position**: Default 'left' – Position of text labels (left or right) relative to trade lines.
- **ATR Period**: Default 14 – The number of periods for calculating ATR to measure volatility.
#### How to Use
1. **Add to Chart**: Load the "MACD Strategy" as a strategy and the "MACD Indicator" as a separate indicator on your TradingView chart (recommended for BTCUSDT Futures on the 1-minute timeframe).
2. **Customize Settings**: Adjust the input parameters based on your risk tolerance and market conditions. For BTCUSDT Futures, consider reducing `Risk Per Trade (%)` during high volatility (e.g., 1%) or increasing `SL Multiplier` for wider stops.
3. **Visual Analysis**: Watch the main chart for trade entry lines (green for buy, red for sell), stop-loss (red), and take-profit (green) lines with labels. Use the MACD pane below to confirm momentum shifts.
4. **Set Alerts**: Create alerts in TradingView for "Buy Signal" and "Sell Signal" to automate trades via Bitget webhooks.
5. **Backtest and Optimize**: Test the strategy on historical BTCUSDT Futures 1-minute data to fine-tune parameters. The short timeframe requires quick execution, so monitor closely for slippage or latency.
#### Tips for Success
- **Market Conditions**: This strategy performs best in trending markets on the 1-minute timeframe. Avoid choppy conditions where MACD crossovers may produce false signals.
- **Risk Management**: Start with the default 3% risk per trade and adjust downward (e.g., 1%) during volatile periods like BTCUSDT news events. The 3:1 risk:reward ratio targets consistent profitability.
- **Timeframe**: Optimized for 1-minute charts; switch to 5-minute or 15-minute for less noise if needed.
- **Confirmation**: Cross-check MACD signals with price action or support/resistance levels for higher accuracy on BTCUSDT Futures.
#### Limitations
- This strategy relies solely on MACD, so it may lag in fast-moving or sideways markets. Consider adding a secondary filter (e.g., RSI) if needed.
- Stop-loss and take-profit are ATR-based and may need adjustment for BTCUSDT Futures’ high volatility, especially during leverage trading.
#### Conclusion
The "MACD Strategy" offers a simple yet effective way to trade momentum shifts using the MACD indicator, tested for BTCUSDT Futures on the 1-minute timeframe, with robust risk management and visual tools. Whether you’re scalping crypto futures or exploring short-term trends, this strategy provides a solid foundation for automated or manual trading. Share your feedback or customizations in the comments, and happy trading!

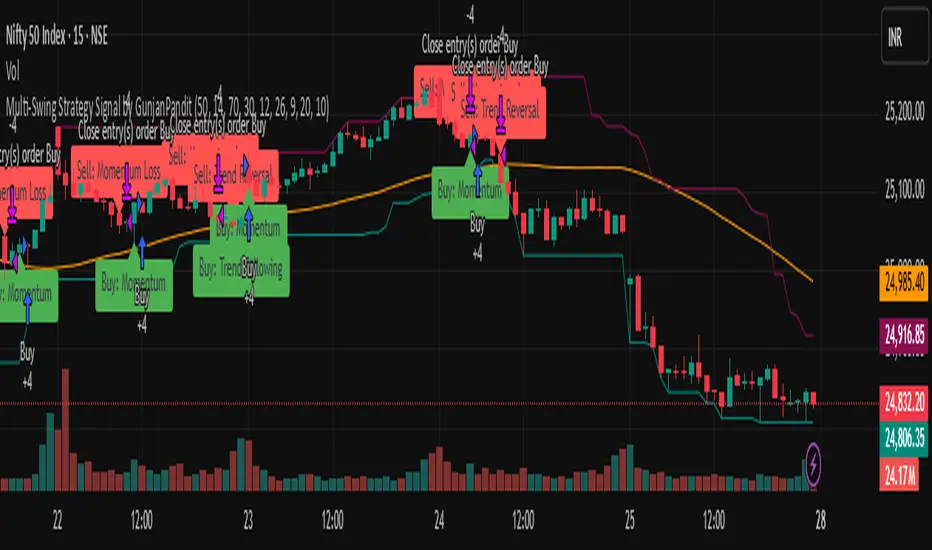
Multi-Swing Strategy Signal by GunjanPandit🌀 Swing Strategy Signal Pack (India/Global) 🌀
This public indicator highlights BUY and SELL points using six popular swing trading methods:
1. Trend Following – via 50-day SMA crossover.
2. Support & Resistance – using 20-bar highs/lows.
3. Momentum – via RSI cross 50.
4. Breakouts – detects moves beyond key swing levels.
5. Reversals – using MACD crossovers + RSI divergence zones.
6. Consolidation – detects breakouts after price compression.
Each signal is labeled with its triggering strategy. Best used on DAILY charts with NSE stocks, indices, or any liquid instruments.
✅ Educational Use Only. ❌ No financial advice. ❌ No performance promises.
Quantum Reversal# 🧠 Quantum Reversal
## **Quantitative Mean Reversion Framework**
This algorithmic trading system employs **statistical mean reversion theory** combined with **adaptive volatility modeling** to capitalize on Bitcoin's inherent price oscillations around its statistical mean. The strategy integrates multiple technical indicators through a **multi-layered signal processing architecture**.
---
## ⚡ **Core Technical Architecture**
### 📊 **Statistical Foundation**
- **Bollinger Band Mean Reversion Model**: Utilizes 20-period moving average with 2.2 standard deviation bands for volatility-adjusted entry signals
- **Adaptive Volatility Threshold**: Dynamic standard deviation multiplier accounts for Bitcoin's heteroscedastic volatility patterns
- **Price Action Confluence**: Entry triggered when price breaches lower volatility band, indicating statistical oversold conditions
### 🔬 **Momentum Analysis Layer**
- **RSI Oscillator Integration**: 14-period Relative Strength Index with modified oversold threshold at 45
- **Signal Smoothing Algorithm**: 5-period simple moving average applied to RSI reduces noise and false signals
- **Momentum Divergence Detection**: Captures mean reversion opportunities when momentum indicators show oversold readings
### ⚙️ **Entry Logic Architecture**
```
Entry Condition = (Price ≤ Lower_BB) OR (Smoothed_RSI < 45)
```
- **Dual-Condition Framework**: Either statistical price deviation OR momentum oversold condition triggers entry
- **Boolean Logic Gate**: OR-based entry system increases signal frequency while maintaining statistical validity
- **Position Sizing**: Fixed 10% equity allocation per trade for consistent risk exposure
### 🎯 **Exit Strategy Optimization**
- **Profit-Lock Mechanism**: Positions only closed when showing positive unrealized P&L
- **Trend Continuation Logic**: Allows winning trades to run until momentum exhaustion
- **Dynamic Exit Timing**: No fixed profit targets - exits based on profitability state rather than arbitrary levels
---
## 📈 **Statistical Properties**
### **Risk Management Framework**
- **Long-Only Exposure**: Eliminates short-squeeze risk inherent in cryptocurrency markets
- **Mean Reversion Bias**: Exploits Bitcoin's tendency to revert to statistical mean after extreme moves
- **Position Management**: Single position limit prevents over-leveraging
### **Signal Processing Characteristics**
- **Noise Reduction**: SMA smoothing on RSI eliminates high-frequency oscillations
- **Volatility Adaptation**: Bollinger Bands automatically adjust to changing market volatility
- **Multi-Timeframe Coherence**: Indicators operate on consistent timeframe for signal alignment
---
## 🔧 **Parameter Configuration**
| Technical Parameter | Value | Statistical Significance |
|-------------------|-------|-------------------------|
| Bollinger Period | 20 | Standard statistical lookback for volatility calculation |
| Std Dev Multiplier | 2.2 | Optimized for Bitcoin's volatility distribution (95.4% confidence interval) |
| RSI Period | 14 | Traditional momentum oscillator period |
| RSI Threshold | 45 | Modified oversold level accounting for Bitcoin's momentum characteristics |
| Smoothing Period | 5 | Noise reduction filter for momentum signals |
---
## 📊 **Algorithmic Advantages**
✅ **Statistical Edge**: Exploits documented mean reversion tendency in Bitcoin markets
✅ **Volatility Adaptation**: Dynamic bands adjust to changing market conditions
✅ **Signal Confluence**: Multiple indicator confirmation reduces false positives
✅ **Momentum Integration**: RSI smoothing improves signal quality and timing
✅ **Risk-Controlled Exposure**: Systematic position sizing and long-only bias
---
## 🔬 **Mathematical Foundation**
The strategy leverages **Bollinger Band theory** (developed by John Bollinger) which assumes that prices tend to revert to the mean after extreme deviations. The RSI component adds **momentum confirmation** to the statistical price deviation signal.
**Statistical Basis:**
- Mean reversion follows the principle that extreme price deviations from the moving average are temporary
- The 2.2 standard deviation multiplier captures approximately 97.2% of price movements under normal distribution
- RSI momentum smoothing reduces noise inherent in oscillator calculations
---
## ⚠️ **Risk Considerations**
This algorithm is designed for traders with understanding of **quantitative finance principles** and **cryptocurrency market dynamics**. The strategy assumes mean-reverting behavior which may not persist during trending market phases. Proper risk management and position sizing are essential.
---
## 🎯 **Implementation Notes**
- **Market Regime Awareness**: Most effective in ranging/consolidating markets
- **Volatility Sensitivity**: Performance may vary during extreme volatility events
- **Backtesting Recommended**: Historical performance analysis advised before live implementation
- **Capital Allocation**: 10% per trade sizing assumes diversified portfolio approach
---
**Engineered for quantitative traders seeking systematic mean reversion exposure in Bitcoin markets through statistically-grounded technical analysis.**

OBV-X| OBV Norm By Momentumtrade Idea By Ziplor traderA unique volume-momentum-based strategy inspired by proprietary OBV dynamics.
This script combines normalized On-Balance Volume (OBV) behavior with adaptive signal filtering mechanisms.
It includes optional filters based on inflection detection and momentum accumulation zones to enhance signal quality.
Key elements include:
Volume-based momentum normalization
Signal line crossover logic
Optional regime filters (acceleration/integration-based)
Dynamic divergence detection
Visual zone overlays for quick market context
Designed for advanced users. Not financial advice.
Further parameters are intentionally obfuscated to preserve the edge.

The VoVix Experiment The VoVix Experiment
The VoVix Experiment is a next-generation, regime-aware, volatility-adaptive trading strategy for futures, indices, and more. It combines a proprietary VoVix (volatility-of-volatility) anomaly detector with price structure clustering and critical point logic, only trading when multiple independent signals align. The system is designed for robustness, transparency, and real-world execution.
Logic:
VoVix Regime Engine: Detects pre-move volatility anomalies using a fast/slow ATR ratio, normalized by Z-score. Only trades when a true regime spike is detected, not just random volatility.
Cluster & Critical Point Filters: Price structure and volatility clustering must confirm the VoVix signal, reducing false positives and whipsaws.
Adaptive Sizing: Position size scales up for “super-spikes” and down for normal events, always within user-defined min/max.
Session Control: Trades only during user-defined hours and days, avoiding illiquid or high-risk periods.
Visuals: Aurora Flux Bands (From another Original of Mine (Options Flux Flow): glow and change color on signals, with a live dashboard, regime heatmap, and VoVix progression bar for instant insight.
Backtest Settings
Initial capital: $10,000
Commission: Conservative, realistic roundtrip cost:
15–20 per contract (including slippage per side) I set this to $25
Slippage: 3 ticks per trade
Symbol: CME_MINI:NQ1!
Timeframe: 15 min (but works on all timeframes)
Order size: Adaptive, 1–2 contracts
Session: 5:00–15:00 America/Chicago (default, fully adjustable)
Why these settings?
These settings are intentionally strict and realistic, reflecting the true costs and risks of live trading. The 10,000 account size is accessible for most retail traders. 25/contract including 3 ticks of slippage are on the high side for MNQ, ensuring the strategy is not curve-fit to perfect fills. If it works here, it will work in real conditions.
Forward Testing: (This is no guarantee. I've provided these results to show that executions perform as intended. Test were done on Tradovate)
ALL TRADES
Gross P/L: $12,907.50
# of Trades: 64
# of Contracts: 186
Avg. Trade Time: 1h 55min 52sec
Longest Trade Time: 55h 46min 53sec
% Profitable Trades: 59.38%
Expectancy: $201.68
Trade Fees & Comm.: $(330.95)
Total P/L: $12,576.55
Winning Trades: 59.38%
Breakeven Trades: 3.12%
Losing Trades: 37.50%
Link: www.dropbox.com
Inputs & Tooltips
VoVix Regime Execution: Enable/disable the core VoVix anomaly detector.
Volatility Clustering: Require price/volatility clusters to confirm VoVix signals.
Critical Point Detector: Require price to be at a statistically significant distance from the mean (regime break).
VoVix Fast ATR Length: Short ATR for fast volatility detection (lower = more sensitive).
VoVix Slow ATR Length: Long ATR for baseline regime (higher = more stable).
VoVix Z-Score Window: Lookback for Z-score normalization (higher = smoother, lower = more reactive).
VoVix Entry Z-Score: Minimum Z-score for a VoVix spike to trigger a trade.
VoVix Exit Z-Score: Z-score below which the regime is considered decayed (exit).
VoVix Local Max Window: Bars to check for local maximum in VoVix (higher = stricter).
VoVix Super-Spike Z-Score: Z-score for “super” regime events (scales up position size).
Min/Max Contracts: Adaptive position sizing range.
Session Start/End Hour: Only trade between these hours (exchange time).
Allow Weekend Trading: Enable/disable trading on weekends.
Session Timezone: Timezone for session filter (e.g., America/Chicago for CME).
Show Trade Labels: Show/hide entry/exit labels on chart.
Flux Glow Opacity: Opacity of Aurora Flux Bands (0–100).
Flux Band EMA Length: EMA period for band center.
Flux Band ATR Multiplier: Width of bands (higher = wider).
Compliance & Transparency
* No hidden logic, no repainting, no pyramiding.
* All signals, sizing, and exits are fully explained and visible.
* Backtest settings are stricter than most real accounts.
* All visuals are directly tied to the strategy logic.
* This is not a mashup or cosmetic overlay; every component is original and justified.
Disclaimer
Trading is risky. This script is for educational and research purposes only. Do not trade with money you cannot afford to lose. Past performance is not indicative of future results. Always test in simulation before live trading.
Proprietary Logic & Originality Statement
This script, “The VoVix Experiment,” is the result of original research and development. All core logic, algorithms, and visualizations—including the VoVix regime detection engine, adaptive execution, volatility/divergence bands, and dashboard—are proprietary and unique to this project.
1. VoVix Regime Logic
The concept of “volatility of volatility” (VoVix) is an original quant idea, not a standard indicator. The implementation here (fast/slow ATR ratio, Z-score normalization, local max logic, super-spike scaling) is custom and not found in public TradingView scripts.
2. Cluster & Critical Point Logic
Volatility clustering and “critical point” detection (using price distance from a rolling mean and standard deviation) are general quant concepts, but the way they are combined and filtered here is unique to this script. The specific logic for “clustered chop” and “critical point” is not a copy of any public indicator.
3. Adaptive Sizing
The adaptive sizing logic (scaling contracts based on regime strength) is custom and not a standard TradingView feature or public script.
4. Time Block/Session Control
The session filter is a common feature in many strategies, but the implementation here (with timezone and weekend control) is written from scratch.
5. Aurora Flux Bands (From another Original of Mine (Options Flux Flow)
The “glowing” bands are inspired by the idea of volatility bands (like Bollinger Bands or Keltner Channels), but the visual effect, color logic, and integration with regime signals are original to this script.
6. Dashboard, Watermark, and Metrics
The dashboard, real-time Sharpe/Sortino, and VoVix progression bar are all custom code, not copied from any public script.
What is “standard” or “common quant practice”?
Using ATR, EMA, and Z-score are standard quant tools, but the way they are combined, filtered, and visualized here is unique. The structure and logic of this script are original and not a mashup of public code.
This script is 100% original work. All logic, visuals, and execution are custom-coded for this project. No code or logic is directly copied from any public or private script.
Use with discipline. Trade your edge.
— Dskyz, for DAFE Trading Systems

Ai BTC Signals Buy & Whales / Liquidation - Strategy [Ai Whales]Dear Trader,
The development involved professional analysts and incorporated AI to adapt signals to the modern, constantly changing, and highly volatile BTCUSD market, also taking into account the presence and actions of large institutional players — the so-called "Whales." The strategy allows you to instantly evaluate any configuration you set within the indicator and see the results reflected in professional performance metrics aligned with your chosen strategy.
The indicator displays several signals on the chart:
1) Buy signal (not sell signals)
2) Take profit line and price
3) Stop loss line and price
4) Manipulations & Liquidations observed in the market
5) Whale activity—buying in small, medium, and large amounts
The indicator does not repaint because it is based on showing signals only after the candle closes, so the calculations are true and not distorted.
Recommended pair: BTCUSD ; BTCUSDT ; BTCUSDTP and same.
The indicator can show R/R - 0.5:1 1:1 1:2 1:3 1:4
Recommended timeframes for use: from 4 hours up to 1 week, with the ideal being 1 day. However, you are free to experiment with other near timeframes.
Possible trading modes: spot or futures.
Some methods used in the calculations of the indicator:
- statistical patterns that have the ability to repeat in the future. Bitcoin cycles in different market phases that also have the ability to repeat and are included in the indicator,
- miners' capitulation and hashrate level are also taken into account by the indicator,
- candle volumes and their deltas are taken into account in the calculations,
- as well as other bases such as RSI and its divergence, the crossing of EMA of various configurations and etc.
**How the strategy calculates positions:**
A position opens at the Buy signal level and is fixed at the level of the thick green line, which serves as the primary take profit target. Pyramiding (adding to positions) can be enabled in the settings.
The size of each position is adjustable via the settings. Importantly, each signal creates its own take profit lines. When pyramiding is enabled, all positions are eventually closed at the nearest take profit level generated by any of the pyramiding signals. This approach minimizes potential losses if the price doesn’t reach the maximum take profit levels initially set; the strategy closes positions at the closest available take profit level. This conservative method for strategy reduces risk, although ideally, each position in the pyramid should be closed at an individual take-profit level, which would lead to even better results during deep backtesting.
The strategy includes alerts that can be configured based on your platform’s capabilities. Alerts trigger on the chart when "Buy" or "Whale" signals are detected.
**Settings Overview:**
- Inside the strategy: default platform options.
- Inside the indicato have some filters:
1) allows traders to choose display modes
2) position entries based on market phase—rising or falling
3) can also select whether to trade after manipulations and liquidations
4) can also select whether to trade after whale activity (small medium or big amounts of whales).
You can manually adjust take profit and stop loss levels via simple method selections, making these flexible yet user-friendly. The indicator offers three main styles:
- "Universal" (standard levels)
- "Aggressive"
- "Conservative"
**Performance and caveats:**
Deep Backtested from day one of Bitcoin’s listing on various exchanges under specific conditions (no liquidations, certain settings), the indicator has shown a maximum drawdown of about 5-15%, with final returns surpassing "buy and hold" more than 1000000% and WinRate 93-100% However, it’s crucial to understand that such spectacular past performance does not guarantee future results.
If you are serious about your investments, remember that geopolitical events, institutional shifts, or other unforeseen factors can significantly impact Bitcoin’s price—or even its existence. Unfortunately, AI has not yet learned to fully account for these macro conditions within its adaptive mechanisms.
Trade wisely, and use this powerful tool responsibly.
Best regards,

Dskyz (DAFE) Quantum Sentiment Flux - Beginners Dskyz (DAFE) Quantum Sentiment Flux - Beginners:
Welcome to the Dskyz (DAFE) Quantum Sentiment Flux - Beginners , a strategy and concept that’s your ultimate wingman for trading futures like MNQ, NQ, MES, and ES. This gem combines lightning-fast momentum signals, market sentiment smarts, and bulletproof risk management into a system so intuitive, even newbies can trade like pros. With clean DAFE visuals, preset modes for every vibe, and a revamped dashboard that’s basically a market GPS, this strategy makes futures trading feel like a high-octane sci-fi mission.
Built on the Dskyz (DAFE) legacy of Aurora Divergence, the Quantum Sentiment Flux is designed to empower beginners while giving seasoned traders a lean, sentiment-driven edge. It uses fast/slow EMA crossovers for entries, filters trades with VIX, SPX trends, and sector breadth, and keeps your account safe with adaptive stops and cooldowns. Tuned for more action with faster signals and a slick bottom-left dashboard, this updated version is ready to light up your charts and outsmart institutional traps. Let’s dive into why this strat’s a must-have and break down its brilliance.
Why Traders Need This Strategy
Futures markets are a wild ride—fast moves, volatility spikes (like the April 28, 2025 NQ 1k-point drop), and institutional games that can wreck unprepared traders. Beginners often get lost in complex systems or burned by impulsive trades. The Quantum Sentiment Flux is the antidote, offering:
Dead-Simple Setup: Preset modes (Aggressive, Balanced, Conservative) auto-tune signals, risk, and sizing, so you can trade without a quant degree.
Sentiment Superpower: VIX filter, SPX trend, and sector breadth visuals keep you aligned with market health, dodging chop and riding trends.
Ironclad Safety: Tighter ATR-based stops, 2:1 take-profits, and preset cooldowns protect your capital, even in chaotic sessions.
Next-Level Visuals: Green/red entry triangles, vibrant EMAs, a sector breadth background, and a beefed-up dashboard make signals and context pop.
DAFE Swagger: The clean aesthetics, sleek dashboard—ties it to Dskyz’s elite brand, making your charts a work of art.
Traders need this because it’s a plug-and-play system that blends beginner-friendly simplicity with pro-level market awareness. Whether you’re just starting or scalping 5min MNQ, this strat’s your key to trading with confidence and style.
Strategy Components
1. Core Signal Logic (High-Speed Momentum)
The strategy’s engine is a momentum-based system using fast and slow Exponential Moving Averages (EMAs), now tuned for faster, more frequent trades.
How It Works:
Fast/Slow EMAs: Fast EMA (Aggressive: 5, Balanced: 7, Conservative: 9 bars) and slow EMA (12/14/18 bars) track short-term vs. longer-term momentum.
Crossover Signals:
Buy: Fast EMA crosses above slow EMA, and trend_dir = 1 (fast EMA > slow EMA + ATR * strength threshold).
Sell: Fast EMA crosses below slow EMA, and trend_dir = -1 (fast EMA < slow EMA - ATR * strength threshold).
Strength Filter: ma_strength = fast EMA - slow EMA must exceed an ATR-scaled threshold (Aggressive: 0.15, Balanced: 0.18, Conservative: 0.25) for robust signals.
Trend Direction: trend_dir confirms momentum, filtering out weak crossovers in choppy markets.
Evolution:
Faster EMAs (down from 7–10/21–50) catch short-term trends, perfect for active futures markets.
Lower strength thresholds (0.15–0.25 vs. 0.3–0.5) make signals more sensitive, boosting trade frequency without sacrificing quality.
Preset tuning ensures beginners get optimized settings, while pros can tweak via mode selection.
2. Market Sentiment Filters
The strategy leans hard into market sentiment with a VIX filter, SPX trend analysis, and sector breadth visuals, keeping trades aligned with the big picture.
VIX Filter:
Logic: Blocks long entries if VIX > threshold (default: 20, can_long = vix_close < vix_limit). Shorts are always allowed (can_short = true).
Impact: Prevents longs during high-fear markets (e.g., VIX spikes in crashes), while allowing shorts to capitalize on downturns.
SPX Trend Filter:
Logic: Compares S&P 500 (SPX) close to its SMA (Aggressive: 5, Balanced: 8, Conservative: 12 bars). spx_trend = 1 (UP) if close > SMA, -1 (DOWN) if < SMA, 0 (FLAT) if neutral.
Impact: Provides dashboard context, encouraging trades that align with market direction (e.g., longs in UP trend).
Sector Breadth (Visual):
Logic: Tracks 10 sector ETFs (XLK, XLF, XLE, etc.) vs. their SMAs (same lengths as SPX). Each sector scores +1 (bullish), -1 (bearish), or 0 (neutral), summed as breadth (-10 to +10).
Display: Green background if breadth > 4, red if breadth < -4, else neutral. Dashboard shows sector trends (↑/↓/-).
Impact: Faster SMA lengths make breadth more responsive, reflecting sector rotations (e.g., tech surging, energy lagging).
Why It’s Brilliant:
- VIX filter adds pro-level volatility awareness, saving beginners from panic-driven losses.
- SPX and sector breadth give a 360° view of market health, boosting signal confidence (e.g., green BG + buy signal = high-probability trade).
- Shorter SMAs make sentiment visuals react faster, perfect for 5min charts.
3. Risk Management
The risk controls are a fortress, now tighter and more dynamic to support frequent trading while keeping accounts safe.
Preset-Based Risk:
Aggressive: Fast EMAs (5/12), tight stops (1.1x ATR), 1-bar cooldown. High trade frequency, higher risk.
Balanced: EMAs (7/14), 1.2x ATR stops, 1-bar cooldown. Versatile for most traders.
Conservative: EMAs (9/18), 1.3x ATR stops, 2-bar cooldown. Safer, fewer trades.
Impact: Auto-scales risk to match style, making it foolproof for beginners.
Adaptive Stops and Take-Profits:
Logic: Stops = entry ± ATR * atr_mult (1.1–1.3x, down from 1.2–2.0x). Take-profits = entry ± ATR * take_mult (2x stop distance, 2:1 reward/risk). Longs: stop below entry, TP above; shorts: vice versa.
Impact: Tighter stops increase trade turnover while maintaining solid risk/reward, adapting to volatility.
Trade Cooldown:
Logic: Preset-driven (Aggressive/Balanced: 1 bar, Conservative: 2 bars vs. old user-input 2). Ensures bar_index - last_trade_bar >= cooldown.
Impact: Faster cooldowns (especially Aggressive/Balanced) allow more trades, balanced by VIX and strength filters.
Contract Sizing:
Logic: User sets contracts (default: 1, max: 10), no preset cap (unlike old 7/5/3 suggestion).
Impact: Flexible but risks over-leverage; beginners should stick to low contracts.
Built To Be Reliable and Consistent:
- Tighter stops and faster cooldowns make it a high-octane system without blowing up accounts.
- Preset-driven risk removes guesswork, letting newbies trade confidently.
- 2:1 TPs ensure profitable trades outweigh losses, even in volatile sessions like April 27, 2025 ES slippage.
4. Trade Entry and Exit Logic
The entry/exit rules are simple yet razor-sharp, now with VIX filtering and faster signals:
Entry Conditions:
Long Entry: buy_signal (fast EMA crosses above slow EMA, trend_dir = 1), no position (strategy.position_size = 0), cooldown passed (can_trade), and VIX < 20 (can_long). Enters with user-defined contracts.
Short Entry: sell_signal (fast EMA crosses below slow EMA, trend_dir = -1), no position, cooldown passed, can_short (always true).
Logic: Tracks last_entry_bar for visuals, last_trade_bar for cooldowns.
Exit Conditions:
Stop-Loss/Take-Profit: ATR-based stops (1.1–1.3x) and TPs (2x stop distance). Longs exit if price hits stop (below) or TP (above); shorts vice versa.
No Other Exits: Keeps it straightforward, relying on stops/TPs.
5. DAFE Visuals
The visuals are pure DAFE magic, blending clean function with informative metrics utilized by professionals, now enhanced by faster signals and a responsive breadth background:
EMA Plots:
Display: Fast EMA (blue, 2px), slow EMA (orange, 2px), using faster lengths (5–9/12–18).
Purpose: Highlights momentum shifts, with crossovers signaling entries.
Sector Breadth Background:
Display: Green (90% transparent) if breadth > 4, red (90%) if breadth < -4, else neutral.
Purpose: Faster breadth_sma_len (5–12 vs. 10–50) reflects sector shifts in real-time, reinforcing signal strength.
- Visuals are intuitive, turning complex signals into clear buy/sell cues.
- Faster breadth background reacts to market rotations (e.g., tech vs. energy), giving a pro-level edge.
6. Sector Breadth Dashboard
The new bottom-left dashboard is a game-changer, a 3x16 table (black/gray theme) that’s your market command center:
Metrics:
VIX: Current VIX (red if > 20, gray if not).
SPX: Trend as “UP” (green), “DOWN” (red), or “FLAT” (gray).
Trade Longs: “OK” (green) if VIX < 20, “BLOCK” (red) if not.
Sector Breadth: 10 sectors (Tech, Financial, etc.) with trend arrows (↑ green, ↓ red, - gray).
Placeholder Row: Empty for future metrics (e.g., ATR, breadth score).
Purpose: Consolidates regime, volatility, market trend, and sector data, making decisions a breeze.
- VIX and SPX metrics add context, helping beginners avoid bad trades (e.g., no longs if “BLOCK”).
Sector arrows show market health at a glance, like a cheat code for sentiment.
Key Features
Beginner-Ready: Preset modes and clear visuals make futures trading a breeze.
Sentiment-Driven: VIX filter, SPX trend, and sector breadth keep you in sync with the market.
High-Frequency: Faster EMAs, tighter stops, and short cooldowns boost trade volume.
Safe and Smart: Adaptive stops/TPs and cooldowns protect capital while maximizing wins.
Visual Mastery: DAFE’s clean flair, EMAs, dashboard—makes trading fun and clear.
Backtestable: Lean code and fixed qty ensure accurate historical testing.
How to Use
Add to Chart: Load on a 5min MNQ/ES chart in TradingView.
Pick Preset: Aggressive (scalping), Balanced (versatile), or Conservative (safe). Balanced is default.
Set Contracts: Default 1, max 10. Stick low for safety.
Check Dashboard: Bottom-left shows preset, VIX, SPX, and sectors. “OK” + green breadth = strong buy.
Backtest: Run in strategy tester to compare modes.
Live Trade: Connect to Tradovate or similar. Watch for slippage (e.g., April 27, 2025 ES issues).
Replay Test: Try April 28, 2025 NQ drop to see VIX filter and stops in action.
Why It’s Brilliant
The Dskyz (DAFE) Quantum Sentiment Flux - Beginners is a masterpiece of simplicity and power. It takes pro-level tools—momentum, VIX, sector breadth—and wraps them in a system anyone can run. Faster signals and tighter stops make it a trading machine, while the VIX filter and dashboard keep you ahead of market chaos. The DAFE visuals and bottom-left command center turn your chart into a futuristic cockpit, guiding you through every trade. For beginners, it’s a safe entry to futures; for pros, it’s a scalping beast with sentiment smarts. This strat doesn’t just trade—it transforms how you see the market.
Final Notes
This is more than a strategy—it’s your launchpad to mastering futures with Dskyz (DAFE) flair. The Quantum Sentiment Flux blends accessibility, speed, and market savvy to help you outsmart the game. Load it, watch those triangles glow, and let’s make the markets your canvas!
Official Statement from Pine Script Team
(see TradingView help docs and forums):
"This warning may appear when you call functions such as ta.sma inside a request.security in a loop. There is no runtime impact. If you need to loop through a dynamic list of tickers, this cannot be avoided in the present version... Values will still be correct. Ignore this warning in such contexts."
(This publishing will most likely be taken down do to some miscellaneous rule about properly displaying charting symbols, or whatever. Once I've identified what part of the publishing they want to pick on, I'll adjust and repost.)
Use it with discipline. Use it with clarity. Trade smarter.
**I will continue to release incredible strategies and indicators until I turn this into a brand or until someone offers me a contract.
Created by Dskyz, powered by DAFE Trading Systems. Trade fast, trade bold.

Advanced Adaptive Grid Trading StrategyThis strategy employs an advanced grid trading approach that dynamically adapts to market conditions, including trend, volatility, and risk management considerations. The strategy aims to capitalize on price fluctuations in both rising (long) and falling (short) markets, as well as during sideways movements. It combines multiple indicators to determine the trend and automatically adjusts grid parameters for more efficient trading.
How it Works:
Trend Analysis:
Short, long, and super long Moving Averages (MA) to determine the trend direction.
RSI (Relative Strength Index) to identify overbought and oversold levels, and to confirm the trend.
MACD (Moving Average Convergence Divergence) to confirm momentum and trend direction.
Momentum indicator.
The strategy uses a weighted scoring system to assess trend strength (strong bullish, moderate bullish, strong bearish, moderate bearish, sideways).
Grid System:
The grid size (the distance between buy and sell levels) changes dynamically based on market volatility, using the ATR (Average True Range) indicator.
Grid density also adapts to the trend: in a strong trend, the grid is denser in the direction of the trend.
Grid levels are shifted depending on the trend direction (upwards in a bear market, downwards in a bull market).
Trading Logic:
The strategy opens long positions if the trend is bullish and the price reaches one of the lower grid levels.
It opens short positions if the trend is bearish and the price reaches one of the upper grid levels.
In a sideways market, it can open positions in both directions.
Risk Management:
Stop Loss for every position.
Take Profit for every position.
Trailing Stop Loss to protect profits.
Maximum daily loss limit.
Maximum number of positions limit.
Time-based exit (if the position is open for too long).
Risk-based position sizing (optional).
Input Options:
The strategy offers numerous settings that allow users to customize its operation:
Timeframe: The chart's timeframe (e.g., 1 minute, 5 minutes, 1 hour, 4 hours, 1 day, 1 week).
Base Grid Size (%): The base size of the grid, expressed as a percentage.
Max Positions: The maximum number of open positions allowed.
Use Volatility Grid: If enabled, the grid size changes dynamically based on the ATR indicator.
ATR Length: The period of the ATR indicator.
ATR Multiplier: The multiplier for the ATR to fine-tune the grid size.
RSI Length: The period of the RSI indicator.
RSI Overbought: The overbought level for the RSI.
RSI Oversold: The oversold level for the RSI.
Short MA Length: The period of the short moving average.
Long MA Length: The period of the long moving average.
Super Long MA Length: The period of the super long moving average.
MACD Fast Length: The fast period of the MACD.
MACD Slow Length: The slow period of the MACD.
MACD Signal Length: The period of the MACD signal line.
Stop Loss (%): The stop loss level, expressed as a percentage.
Take Profit (%): The take profit level, expressed as a percentage.
Use Trailing Stop: If enabled, the strategy uses a trailing stop loss.
Trailing Stop (%): The trailing stop loss level, expressed as a percentage.
Max Loss Per Day (%): The maximum daily loss, expressed as a percentage.
Time Based Exit: If enabled, the strategy exits the position after a certain amount of time.
Max Holding Period (hours): The maximum holding time in hours.
Use Risk Based Position: If enabled, the strategy calculates position size based on risk.
Risk Per Trade (%): The risk per trade, expressed as a percentage.
Max Leverage: The maximum leverage.
Important Notes:
This strategy does not guarantee profits. Cryptocurrency markets are volatile, and trading involves risk.
The strategy's effectiveness depends on market conditions and settings.
It is recommended to thoroughly backtest the strategy under various market conditions before using it live.
Past performance is not indicative of future results.
