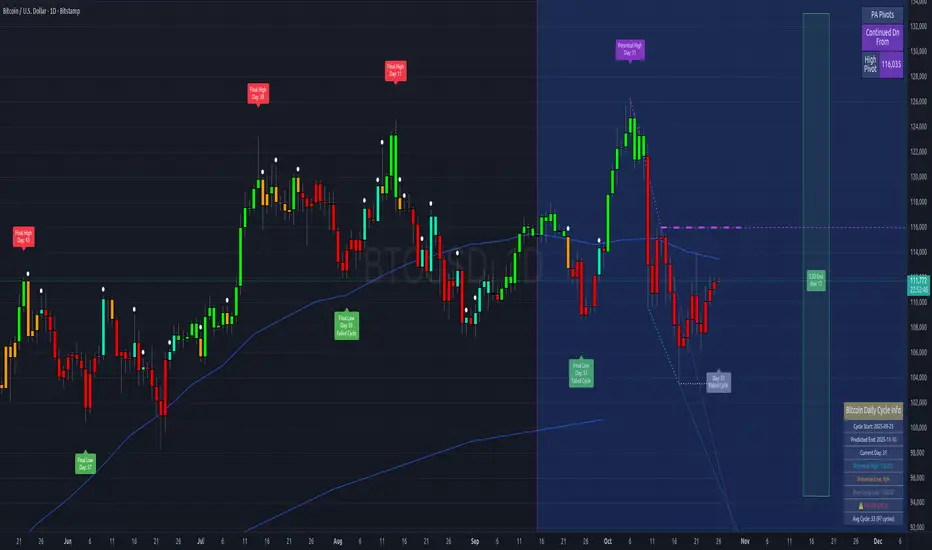
BTC Halving VWAP [Cycle Analysis]█ OVERVIEW
This indicator plots Anchored Volume Weighted Average Prices (VWAPs) from each Bitcoin halving date, revealing the "fair value" of each market cycle.
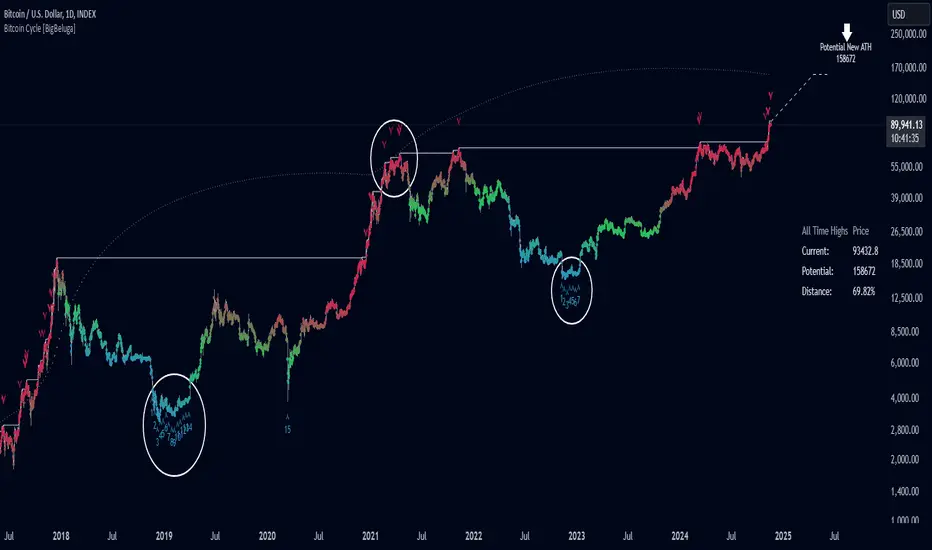
The key insight: When price closes below the current cycle's VWAP on the monthly chart (after 1+ year into the cycle), it historically signals the end of the bull market and continuation toward the previous halving's VWAP.
█ HALVING DATES
• H1: November 28, 2012 (Block 210,000)
• H2: July 9, 2016 (Block 420,000)
• H3: May 11, 2020 (Block 630,000)
• H4: April 19, 2024 (Block 840,000)
█ FEATURES
◽ Anchored VWAPs — VWAP lines calculated from each halving date
◽ Consolidation Bands — Adjustable percentage bands around each VWAP (default ±15%)
◽ Cycle Top Detection — Tracks the highest high before VWAP breakdown
◽ Breakdown Signals — Visual markers when price breaks below cycle VWAP (bearish confirmation)
◽ Interactive Dashboard — Shows cycle progress, VWAP levels, and historical comparison
◽ Alerts — Configurable alerts for VWAP crossovers and breakdowns
█ HOW TO USE
1. Apply to BTCUSD on the Monthly timeframe for best results
2. Watch the H4 VWAP (gold line) — this is the current cycle's fair value
3. When price is ABOVE the VWAP → Bullish bias
4. When price is BELOW the VWAP → Bearish bias, expect move to previous cycle VWAP
5. The ▼ signal marks confirmed cycle tops (VWAP breakdown after 1+ year)
█ DASHBOARD GUIDE
• Price — Current price and gain from halving
• Day — Days since halving and cycle progress %
• VWAP Levels — Current VWAP values with status (ABOVE/BELOW/CONSOL)
• Cycle Tops — Historical days to cycle top for H2 and H3
• Next Halving — Estimated date and countdown
█ SETTINGS
Display:
• Toggle dashboard, consolidation bands, vertical lines, cycle tops, breakdown signals
VWAPs:
• Show/hide individual halving VWAPs (H1-H4)
Settings:
• Dashboard text size
• Consolidation band percentage
• Cycle top label size
█ ALERTS
• VWAP Breakdown — Price breaks below any halving VWAP
• VWAP Reclaim — Price reclaims a halving VWAP
• Consolidation Zone — Price enters consolidation around VWAP
█ NOTES
• Best used on Monthly (1M) timeframe for cycle analysis
• Weekly timeframe also works for more granular view
• H1 VWAP disabled by default (requires data from 2012)
• Cycle top locks when price closes below VWAP after 365+ days into the cycle
Pine Script® göstergesi