Advanced Hurst Cycle + VTL + Turning Points| Timeframe | Cycle Base | Use Case | Notes |
| ------------ | ---------- | ------------------ | ------------------------- |
| 5-min | 16–20 bars | Intraday scalping | Tight SL, fast moves |
| 15-min / 1hr | 20–40 bars | Intraday to swing | Good for options intraday |
| Daily | 20–40 bars | Multi-day swings | Ideal for Futures/ST BTST |
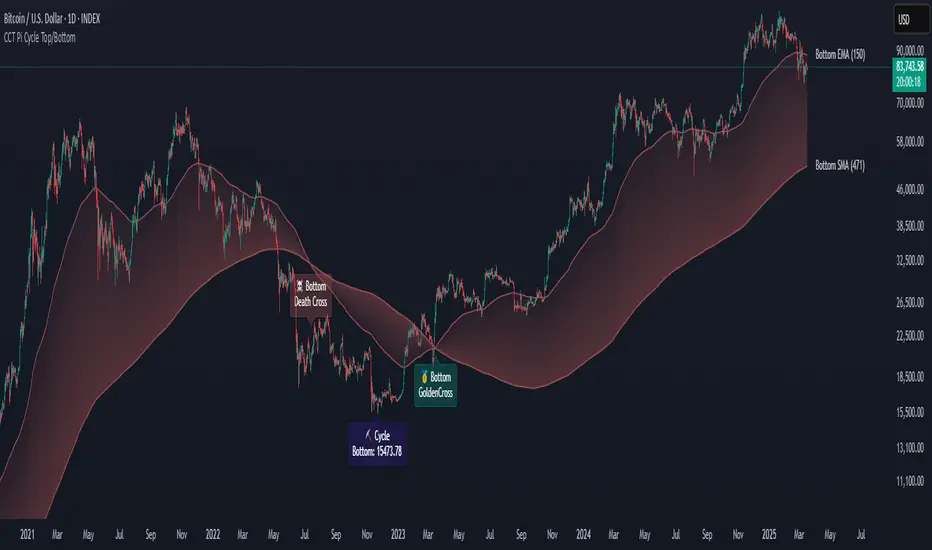
| Weekly | 13–26 bars | Position/Investing | For macro turns |
Guide to Trading with JM Hurst Cycles in TradingView
1. What is JM Hurst Cycle Theory?
JM Hurst proposed that financial markets move in harmonically related cycles. These cycles can help traders
forecast turning points in markets using time-based analysis rather than just price.
Key Concepts:
- Cycle Nesting: Smaller cycles exist within larger ones.
- Harmonic Ratios: Each cycle is typically double the length of the smaller one (e.g., 20, 40, 80).
- Turning Points: When multiple cycles bottom together, strong reversals occur.
- Tools: FLD (Future Line of Demarcation), VTL (Valid Trend Lines).
2. TradingView Script Features
The provided Pine Script v5 implements:
- FLDs (shifted SMAs) for base and harmonic cycles.
- VTLs: Drawn between major pivot highs/lows to confirm trend reversals.
- Cycle Turning Points: Detected using pivot logic and cycle phase.
- Optional: Sine wave to visualize cycle rhythm.
Inputs:
- Base Cycle Length: Set the expected cycle duration (e.g., 20 bars).
- FLD/VTL/Turn toggles to customize chart view.
3. How to Trade with This Script
1. Set 'Base Cycle Length' to 20, 40, or 80 depending on your market and timeframe.
2. Watch for price crossing the FLD:
- Bullish Signal: Price crosses above FLD near cycle bottom.
- Bearish Signal: Price breaks below FLD near cycle top.
3. Use VTL for confirmation:
Guide to Trading with JM Hurst Cycles in TradingView
- Break of upward VTL from cycle lows = bearish shift.
- Break of downward VTL from cycle highs = bullish shift.
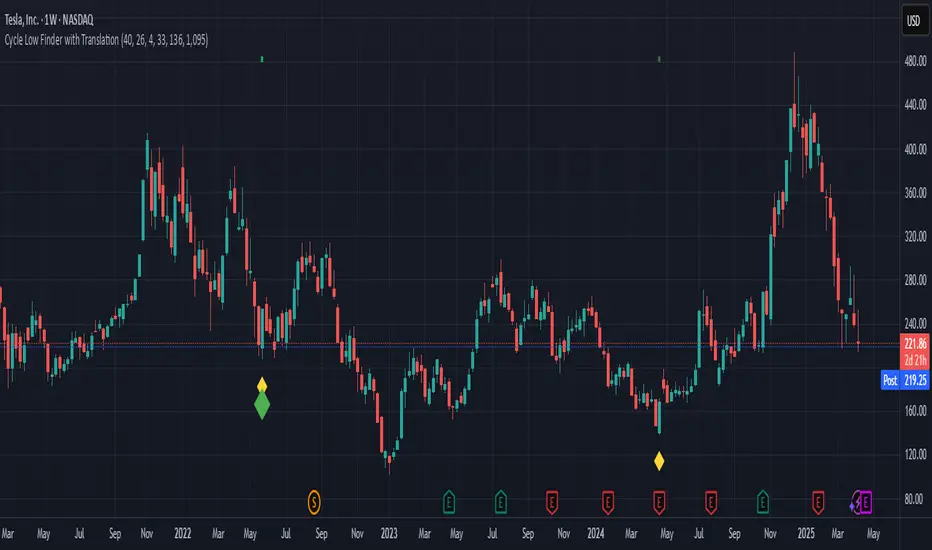
4. Use turning point markers:
- Triangle up (green): Probable cycle bottom - watch for long.
- Triangle down (red): Probable cycle top - prepare for exit or short.
Tips:
- Align multiple cycle lengths for stronger confirmation.
- Use with other technical indicators like RSI/MACD for confluence.
- Avoid trading just before major news events - cycles can distort.
4. Example Strategy
If base cycle is 20 bars:
- Wait for triangle up (cycle low) near FLD.
- Confirm price crosses above FLD.
- Ensure VTL from prior lows is intact or just broken upward.
- Enter long; set stop below recent low.
Opposite for shorts at triangle down + FLD break down + VTL break.
5. Final Notes
This script offers a time-based visual trading method inspired by JM Hurst. It's most powerful when used with
patience, confirmation, and alignment across cycles.
You can adjust cycle lengths or refine pivots based on your trading timeframe and asset class.
For best results, backtest cycle behavior on your instrument before live trading.
Pine Script® göstergesi