Binary Option Arrows (example) [TheMightyChicken]An example of binary option arrows for candlestick patterns bearish and bullish harami. With results as colored background and an option to choose your expiration (one candle by default). It's just an example for those who has their own strategy and wants to make nice arrows in their chart. All you need to do is rewrite piece of script in lines 9:13 - feel free to ask me for any help, but I believe it's all clear.
Disclaimer: It's just an example how to script arrows for binary option and I am not responsible for any loss of money by using this particular strategy.
I wish happy and successful trading! ;)
"Candlestick" için komut dosyalarını ara

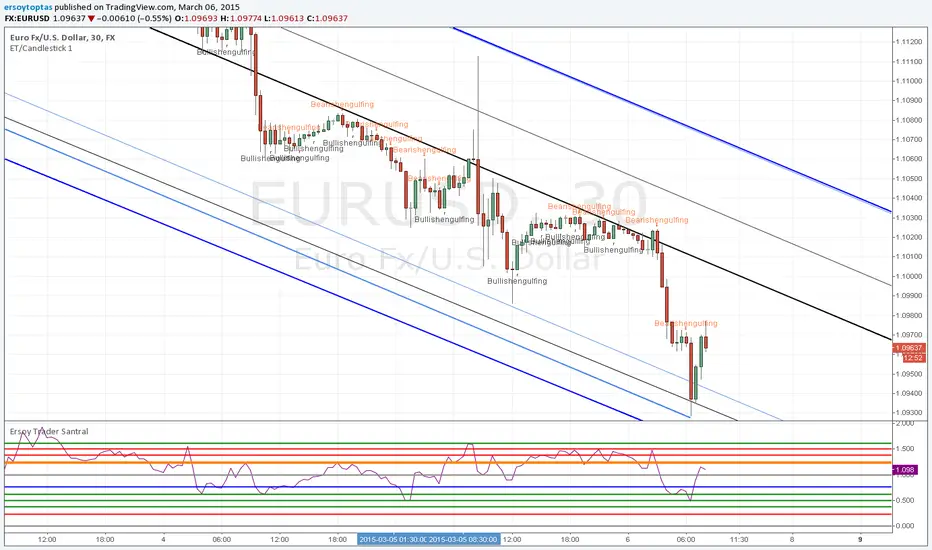
ET/Candlestick 1website: www.ersoytoptas.com
Newspaper : tr.investing.com
Please ... First !!! Your analysis after sicript
Indicator: Intrady Momentum IndexThe Intraday Momentum Index (IMI), developed by Tushar Chande, is a cross-breed between RSI and candlestick analysis. IMI determines the candle type that dominated the recent price action, using that to pinpoint the extremes in intraday momentum.
As the market tries to bottom after a sell off, there are gradually more candles with green bodies, even though prices remain in a narrow range. IMI can be used to detect this shift, because its values will increase towards 70. Similarly, as the market begins to top, there will be more red candles, causing IMI to decline towards 20. When the market is in trading range, IMI values will be in the neutral range of 40 to 60.
Usually intraday momentum leads interday momentum. QStick can show interday momentum, it complements IMI. You will find it in my published indicators.
I have added volatility bands based OB/OS, in addition to static OB/OS levels. You can also turn on IMI Ehlers smoothing. BTW, all parameters are configurable, so do check out the options page.
List of my other indicators:
-
- Google doc: docs.google.com

Two Consecutive Candles Alert - Toggle Alerts🔹 Overview:
This indicator identifies when two consecutive candles of the same color appear on the chart—bullish (green) or bearish (red). It highlights the second candle of the streak and optionally triggers an alert, helping traders spot short-term momentum shifts or continuation patterns.
🔹 How It Works:
Candle Detection: The script checks the last three candles.
The second candle in a pair is marked only if it follows a candle of the same color and is not part of a longer streak.
Marking:
Bullish second candles are marked with a green triangle below the bar.
Bearish second candles are marked with a red triangle above the bar.
Alerts (Optional):
Traders can enable or disable alerts independently for bullish or bearish setups using checkboxes in the settings.
Alerts are triggered only on the second candle of a two-candle streak.
🔹 Inputs / Settings:
Enable Bullish Candle Alerts ✅
Enable Bearish Candle Alerts ✅
🔹 Use Case:
Identify short-term trend momentum.
Spot potential continuation setups after two consecutive candles of the same type.
Combine with other indicators for confirmation (e.g., support/resistance, moving averages).
🔹 Notes:
The indicator marks only the second candle in a two-candle streak to avoid marking longer streaks multiple times.
Alerts are fully optional and can be toggled on or off.


Inside Day Detector//@version=5
indicator("Inside Day Detector", overlay=true)
// Yesterday's High & Low
prevHigh = high
prevLow = low
// Inside Day condition
insideDay = high < prevHigh and low > prevLow
// Plot marker
plotshape(insideDay, title="Inside Day", style=shape.triangleup, location=location.abovebar, size=size.small)
// Alert
alertcondition(insideDay, title="Inside Day Alert", message="Inside Day detected on {{ticker}}")


ORB 1m + 15mShow the opening range bound of each trading day for the first minute and first 15 minutes.

Average CandleAverage Candle is a custom indicator that plots a synthetic candle built from the average open, high, low, and close of the last X periods, providing a smoother view of price behavior and trend. It helps filter noise by summarizing recent market action into a single, representative **candle** per bar.
1. Introduction
Average Candle calculates the simple moving average of each OHLC component (Open, High, Low, Close) over a user-defined lookback period and renders that as a separate candle on the chart.
This creates a smoothed representation of price that is less affected by short-term volatility while still respecting the overall structure of the market.
By visualizing these averaged candles, traders can better identify underlying direction and momentum without removing the original price bars.
2. Key features
- Uses the average of the last X opens, highs, lows, and closes to build a synthetic candle for each bar, allowing consistent smoothing across all OHLC components.
- Colors the Average Candle bullish or bearish based on whether the average close is above or below the average open, making directional bias visually clear at a glance.
- Can be overlaid on the main chart to compare raw price candles with their averaged counterpart, helping traders distinguish meaningful swings from short-term noise.
3. How to use
- Add the indicator to your chart, choose the desired lookback length (X periods), and tune it according to your trading timeframe and style—for example, shorter lengths for more responsive signals and longer lengths for smoother trends.
- Use the Average Candle to confirm trend direction, detect potential reversals, or validate entries and exits by checking whether price action aligns with the smoothed average structure.
- Combine it with other tools such as support/resistance, volume, or momentum indicators, ensuring it is used as a complementary visualization aid rather than a standalone signal generator.

Time+Another way of looking at time, with each time classification split into 4 parts, where you can assess in what quarter of time price moves, or does not.


SMA Reversal Sequential MTF - FinalSMA Reversal Sequential MTF - Final Edition
Here is the direct English translation of the description, maintaining the professional and factual tone without excessive ornamentation.
SMA Reversal Sequential MTF - Final Edition
1. Overview
This script is the final edition of "SMA Reversal Sequential MTF," featuring a proprietary logic that identifies market pivot points based on the structural changes of Simple Moving Averages (SMA). It integrates multi-timeframe (MTF) analysis covering from 1-minute to monthly scales, visualizing trend status, synchronization, and consolidations (squeezes) directly on the chart.
2. Core Logic
SMA Reversal Logic: Identifies points where the SMA shifts in a "V-shape" or "Inverted V-shape" based on the positional relationship of the three most recent MA points. The algorithm maintains strictly precise calculations consistent since the initial version.
Breakout Detection: Displays a "BREAK" label when the price closes beyond the most recent high or low established by a pivot point.
Multi-Timeframe (MTF): Projects signals from higher timeframes (e.g., 1D, 4H, 1H) onto the current chart.
3. Input Settings
The settings menu is configured with bilingual labels (Japanese and English).
■ Main Settings
Use Short Period Settings (5, 3, 7)
OFF (Default): SMA 20, Offset 6, Lookback 20
ON: SMA 5, Offset 3, Lookback 7
■ Timeframe Visibility
Show Timeframes (1M to 1m)
Individually toggle the visibility of each timeframe. The settings are organized in descending order from higher to lower timeframes.
Hide Lower Timeframes
When ON, automatically hides signals from timeframes lower than the one currently displayed on the chart.
■ Drawing Options
Show Only Current TF Labels
Hides MTF labels and displays only the pivot points corresponding to the current chart timeframe.
Show Trendlines & Channels
Automatically plots lines connecting recent highs/lows and their parallel channels for the current timeframe.
Show Sequential Labels
Displays labels (e.g., 1H) at SMA reversal points to indicate the source timeframe.
Show Break Lines
Displays horizontal lines at un-breached highs/lows along with breakout labels.
■ Additional Alert Settings
Alert 1: 3-TF Sync
Triggers when the current timeframe and the two immediate higher timeframes align in the same trend direction.
Alert 2: 4-TF Sync
Triggers when four timeframes synchronize in the same trend direction.
Alert 3: Squeeze (Green ●)
Detects "Triangle Squeezes" (lower highs and higher lows) and displays a "●" on the chart with a notification.
4. Dashboard
The dashboard in the top-right corner displays the real-time trend status of five major timeframes (1D, 4H, 1H, 15M, 5M).
Blue: Bullish (Price has broken the recent high)
Red: Bearish (Price has broken the recent low)
Gray: Neutral
5. Trading Application
Market Context: Identify directional bias when dashboard colors align.
Entry Alignment: Utilize "Sync Alerts" on lower timeframes as signals when they align with the higher timeframe trend.
Volatility Contraction: The appearance of a green "●" (Squeeze) indicates energy consolidation, suggesting a potential breakout.
SMA Reversal Sequential MTF - Final Edition
1. 概要 (Overview)
本スクリプトは、SMA(単純移動平均線)の形状変化から相場の転換点(ピボット)を特定する独自ロジックを用いた「SMA Reversal Sequential MTF」の最終盤です。1分足から月足までを網羅するマルチタイムフレーム(MTF)分析を統合しており、上位足のトレンド状態、同期、三角保合い(スクイーズ)をチャート上に可視化します。
2. ロジック解説 (Core Logic)
SMA Reversal Logic: 指定期間のSMAが「V字」または「逆V字」に転換したポイントを、直近のMA3点の位置関係から算出します。アルゴリズムは初版から変わらぬ厳密な計算を維持しています。
Breakout Detection: 転換点で作られた直近の高値・安値を終値でブレイクした際に「BREAK」ラベルを表示します。
Multi-Timeframe (MTF): 現在のチャート上に上位足(1D, 4H, 1H等)のシグナルを投影します。
3. インプット項目の詳細 (Input Settings)
設定画面は、日本語と英語の併記構成となっています。
■ 基本設定 / Main Settings
短期設定を使用 (5, 3, 7) / Use Short Period Settings
OFF (デフォルト):SMA 20, Offset 6, Lookback 20
ON:SMA 5, Offset 3, Lookback 7
■ 時間足表示設定 / Timeframe Visibility
1M表示 ~ 1m表示 / Show Timeframes
各時間足の表示を個別に切り替えます。設定画面では大きな足から順に並んでいます。
現在足より短い時間足の設定を非表示 / Hide Lower Timeframes
ONにすると、現在表示しているチャートより短い時間足のシグナルを自動で非表示にします。
■ 表示オプション / Drawing Options
現在足のラベルのみ表示 / Show Only Current TF Labels
現在の時間足の転換点のみを表示し、MTFラベルを非表示にします。
トレンドライン&チャネルを表示 / Show Trendlines & Channels
現在足の安値同士・高値同士を結んだラインと、平行チャネルを自動描画します。
転換点ラベル表示 / Show Sequential Labels
SMAの反転箇所に、該当する時間足のラベル(例:1H)を表示します。
ブレイクライン表示 / Show Break Lines
未更新の高値・安値ラインと、ブレイク時のラベルを表示します。
■ 追加アラート設定 / Additional Alert Settings
アラート1: 現在・上位2つ同調 / Alert 1: 3-TF Sync
現在足+上位2つの時間足のトレンドが同一方向になった際に通知します。
アラート2: 表示足を含む4足同調 / Alert 2: 4-TF Sync
4つの時間足のトレンドが同期した際に通知します。
アラート3: 三角保合い発生 (緑●) / Alert 3: Squeeze
高値切り下がり、安値切り上がりの「三角保合い」形成を検知し、チャート上に「●」を表示・通知します。
4. ダッシュボード (Dashboard)
チャート右上に主要5足(1D, 4H, 1H, 15M, 5M)のトレンド状況をリアルタイム表示します。
青色(Blue): 強気(直近高値をブレイク中)
赤色(Red): 弱気(直近安値をブレイク中)
灰色(Gray): ニュートラル
5. トレードへの活用
環境認識: ダッシュボードの色が揃っている方向への優位性を確認します。
エントリー判断: 上位足のトレンド方向に、下位足で同期アラートが発生したポイントをシグナルとして活用します。
ボラティリティの収束: 緑の「●(Squeeze)」が表示された際は、エネルギーが収束している状態を示唆します。

Custom Price Offsets v6.1Use the indicator to mark pullbacks and targets on your chart based off custom levels. Click to set the initial point on your chart. Can change your offsets in the settings menu. must delete and readd indicator to change set point.

HL Zone + Vol Alert (Complete) + Vol Explosion Alertabc
a
kfsdkfjaighhguhgdfndnfdinfdndgdsgdsgdgdfsjgndfjgnsjfgnsdjgnjsgnjdfngsdfgs

jaems_Double BB[Alert]/W-Bottom/Dashboard// This Pine Script® code is subject to the terms of the Mozilla Public License 2.0 at mozilla.org
// © Kingjmaes
//@version=6
strategy("jaems_Double BB /W-Bottom/Dashboard", shorttitle="jaems_Double BB /W-Bottom/Dashboard", overlay=true, commission_type=strategy.commission.percent, commission_value=0.05, slippage=1, process_orders_on_close=true)
// ==========================================
// 1. 사용자 입력 (Inputs)
// ==========================================
group_date = "📅 백테스트 기간 설정"
startTime = input.time(timestamp("2024-01-01 00:00"), "시작일", group=group_date)
endTime = input.time(timestamp("2099-12-31 23:59"), "종료일", group=group_date)
group_bb = "📊 더블 볼린저 밴드 설정"
bb_len = input.int(20, "길이 (Length)", minval=5, group=group_bb)
bb_mult_inner = input.float(1.0, "내부 밴드 승수 (Inner A)", step=0.1, group=group_bb)
bb_mult_outer = input.float(2.0, "외부 밴드 승수 (Outer B)", step=0.1, group=group_bb)
group_w = "📉 W 바닥 패턴 설정"
pivot_left = input.int(3, "피벗 좌측 봉 수", minval=1, group=group_w)
pivot_right = input.int(1, "피벗 우측 봉 수", minval=1, group=group_w)
group_dash = "🖥️ 대시보드 설정"
show_dash = input.bool(true, "대시보드 표시", group=group_dash)
comp_sym = input.symbol("NASDAQ:NDX", "비교 지수 (GS Trend)", group=group_dash, tooltip="S&P500은 'SP:SPX', 비트코인은 'BINANCE:BTCUSDT' 등을 입력하세요.")
rsi_len = input.int(14, "RSI 길이", group=group_dash)
group_risk = "🛡 리스크 관리"
use_sl_tp = input.bool(true, "손절/익절 사용", group=group_risk)
sl_pct = input.float(2.0, "손절매 (%)", step=0.1, group=group_risk) / 100
tp_pct = input.float(4.0, "익절매 (%)", step=0.1, group=group_risk) / 100
// ==========================================
// 2. 데이터 처리 및 계산 (Calculations)
// ==========================================
// 기간 필터
inDateRange = time >= startTime and time <= endTime
// 더블 볼린저 밴드
basis = ta.sma(close, bb_len)
dev_inner = ta.stdev(close, bb_len) * bb_mult_inner
dev_outer = ta.stdev(close, bb_len) * bb_mult_outer
upper_A = basis + dev_inner
lower_A = basis - dev_inner
upper_B = basis + dev_outer
lower_B = basis - dev_outer
percent_b = (close - lower_B) / (upper_B - lower_B)
// W 바닥형 (W-Bottom) - 리페인팅 방지
pl = ta.pivotlow(low, pivot_left, pivot_right)
var float p1_price = na
var float p1_pb = na
var float p2_price = na
var float p2_pb = na
var bool is_w_setup = false
if not na(pl)
p1_price := p2_price
p1_pb := p2_pb
p2_price := low
p2_pb := percent_b
// 패턴 감지
bool cond_w = (p1_price < lower_B ) and (p2_price > p1_price) and (p2_pb > p1_pb)
is_w_setup := cond_w ? true : false
w_bottom_signal = is_w_setup and close > open and close > lower_A
if w_bottom_signal
is_w_setup := false
// GS 트렌드 (나스닥 상대 강도)
ndx_close = request.security(comp_sym, timeframe.period, close)
rs_ratio = close / ndx_close
rs_sma = ta.sma(rs_ratio, 20)
gs_trend_bull = rs_ratio > rs_sma
// RSI & MACD
rsi_val = ta.rsi(close, rsi_len)
= ta.macd(close, 12, 26, 9)
macd_bull = macd_line > signal_line
// ==========================================
// 3. 전략 로직 (Strategy Logic)
// ==========================================
long_cond = (ta.crossover(close, lower_A) or ta.crossover(close, basis) or w_bottom_signal) and inDateRange and barstate.isconfirmed
short_cond = (ta.crossunder(close, upper_B) or ta.crossunder(close, upper_A) or ta.crossunder(close, basis)) and inDateRange and barstate.isconfirmed
// 진입 실행 및 알람 발송
if long_cond
strategy.entry("Long", strategy.long, comment="Entry Long")
alert("Long Entry Triggered | Price: " + str.tostring(close), alert.freq_once_per_bar_close)
if short_cond
strategy.entry("Short", strategy.short, comment="Entry Short")
alert("Short Entry Triggered | Price: " + str.tostring(close), alert.freq_once_per_bar_close)
// 청산 실행
if use_sl_tp
if strategy.position_size > 0
strategy.exit("Exit Long", "Long", stop=strategy.position_avg_price * (1 - sl_pct), limit=strategy.position_avg_price * (1 + tp_pct), comment_loss="L-SL", comment_profit="L-TP")
if strategy.position_size < 0
strategy.exit("Exit Short", "Short", stop=strategy.position_avg_price * (1 + sl_pct), limit=strategy.position_avg_price * (1 - tp_pct), comment_loss="S-SL", comment_profit="S-TP")
// 별도 알람: W 패턴 감지 시
if w_bottom_signal
alert("W-Bottom Pattern Detected!", alert.freq_once_per_bar_close)
// ==========================================
// 4. 대시보드 시각화 (Dashboard Visualization)
// ==========================================
c_bg_head = color.new(color.black, 20)
c_bg_cell = color.new(color.black, 40)
c_text = color.white
c_bull = color.new(#00E676, 0)
c_bear = color.new(#FF5252, 0)
c_neu = color.new(color.gray, 30)
get_trend_color(is_bull) => is_bull ? c_bull : c_bear
get_pos_text() => strategy.position_size > 0 ? "LONG 🟢" : strategy.position_size < 0 ? "SHORT 🔴" : "FLAT ⚪"
get_pos_color() => strategy.position_size > 0 ? c_bull : strategy.position_size < 0 ? c_bear : c_neu
var table dash = table.new(position.top_right, 2, 7, border_width=1, border_color=color.gray, frame_color=color.gray, frame_width=1)
if show_dash and (barstate.islast or barstate.islastconfirmedhistory)
table.cell(dash, 0, 0, "METRIC", bgcolor=c_bg_head, text_color=c_text, text_size=size.small)
table.cell(dash, 1, 0, "STATUS", bgcolor=c_bg_head, text_color=c_text, text_size=size.small)
table.cell(dash, 0, 1, "GS Trend", bgcolor=c_bg_cell, text_color=c_text, text_halign=text.align_left, text_size=size.small)
table.cell(dash, 1, 1, gs_trend_bull ? "Bullish" : "Bearish", bgcolor=c_bg_cell, text_color=get_trend_color(gs_trend_bull), text_size=size.small)
rsi_col = rsi_val > 70 ? c_bear : rsi_val < 30 ? c_bull : c_neu
table.cell(dash, 0, 2, "RSI (14)", bgcolor=c_bg_cell, text_color=c_text, text_halign=text.align_left, text_size=size.small)
table.cell(dash, 1, 2, str.tostring(rsi_val, "#.##"), bgcolor=c_bg_cell, text_color=rsi_col, text_size=size.small)
table.cell(dash, 0, 3, "MACD", bgcolor=c_bg_cell, text_color=c_text, text_halign=text.align_left, text_size=size.small)
table.cell(dash, 1, 3, macd_bull ? "Bullish" : "Bearish", bgcolor=c_bg_cell, text_color=get_trend_color(macd_bull), text_size=size.small)
w_status = w_bottom_signal ? "DETECTED!" : is_w_setup ? "Setup Ready" : "Waiting"
w_col = w_bottom_signal ? c_bull : is_w_setup ? color.yellow : c_neu
table.cell(dash, 0, 4, "W-Bottoms", bgcolor=c_bg_cell, text_color=c_text, text_halign=text.align_left, text_size=size.small)
table.cell(dash, 1, 4, w_status, bgcolor=c_bg_cell, text_color=w_col, text_size=size.small)
table.cell(dash, 0, 5, "Position", bgcolor=c_bg_cell, text_color=c_text, text_halign=text.align_left, text_size=size.small)
table.cell(dash, 1, 5, get_pos_text(), bgcolor=c_bg_cell, text_color=get_pos_color(), text_size=size.small)
last_sig = long_cond ? "BUY SIGNAL" : short_cond ? "SELL SIGNAL" : "HOLD"
last_col = long_cond ? c_bull : short_cond ? c_bear : c_neu
table.cell(dash, 0, 6, "Signal", bgcolor=c_bg_cell, text_color=c_text, text_halign=text.align_left, text_size=size.small)
table.cell(dash, 1, 6, last_sig, bgcolor=c_bg_cell, text_color=last_col, text_size=size.small)
// ==========================================
// 5. 시각화 (Visualization)
// ==========================================
p_upper_B = plot(upper_B, "Upper B", color=color.new(color.red, 50))
p_upper_A = plot(upper_A, "Upper A", color=color.new(color.red, 0))
p_basis = plot(basis, "Basis", color=color.gray)
p_lower_A = plot(lower_A, "Lower A", color=color.new(color.green, 0))
p_lower_B = plot(lower_B, "Lower B", color=color.new(color.green, 50))
fill(p_upper_B, p_upper_A, color=color.new(color.red, 90))
fill(p_lower_A, p_lower_B, color=color.new(color.green, 90))
plotshape(long_cond, title="Long", style=shape.triangleup, location=location.belowbar, color=color.green, size=size.small)
plotshape(short_cond, title="Short", style=shape.triangledown, location=location.abovebar, color=color.red, size=size.small)

Inside Bar False Breakout (IBFB)The Inside Bar False Breakout (IBFB) is a price action tool that identifies high-probability reversal setups by detecting false breakouts from inside bar patterns. This strategy is widely used by traders to catch market traps and potential trend reversals.
What is an Inside Bar False Breakout?
An Inside Bar occurs when a candle's high and low are completely contained within the previous candle's range. A False Breakout happens when price initially breaks above or below this range but then closes back inside it, indicating a failed breakout and potential reversal.
How It Works
Step 1: Inside Bar Detection
Identifies candles where high < previous high AND low > previous low
Marks consolidation zones where market indecision occurs
Step 2: False Breakout Recognition
Bullish IBFB: Price breaks below the inside bar's low but closes back inside the range (bullish reversal signal)
Bearish IBFB: Price breaks above the inside bar's high but closes back inside the range (bearish reversal signal)
Step 3: Signal Confirmation
Applies a cooldown period (default 5 bars) to filter out noise and prevent signal clustering
Key Features
✅ Visual Signals
Color-coded bars (green for bullish, red for bearish IBFB)
Free-floating arrow markers (⬆ bullish, ⬇ bearish) without label boxes
Clean, minimalist design that doesn't clutter your chart
✅ Signal History Table
Displays the last 5 IBFB signals in real-time
Shows date/time, signal type, and price level
Color-coded for quick reference
✅ Customizable Settings
Enable/disable bullish or bearish signals independently
Adjustable cooldown period (1-100 bars) to control signal frequency
Customizable colors for both signal types
Toggle arrows and history table on/off
✅ Alert System
Built-in alert conditions for both bullish and bearish IBFB patterns
Fires once per bar close to avoid false alarms
Perfect for automated trading or notifications
✅ Universal Compatibility
Works on ANY timeframe (1m to 1M)
Lightweight and efficient - won't slow down your charts
No repainting - signals appear only on confirmed bar close
Best Use Cases
a.Scalping & Day Trading: Catch intraday reversals on lower timeframes (5m, 15m)
b.Swing Trading: Identify multi-day reversal patterns on higher timeframes (4H, D)
c.Trend Confirmation: Combine with trend indicators to filter trades in the direction of the main trend
d.Support/Resistance: Works exceptionally well near key S/R levels where false breakouts are common
Trading Tips
Confluence is Key: Combine IBFB signals with support/resistance zones, trendlines, or Fibonacci levels
Volume Matters: Look for decreasing volume on the false breakout for stronger confirmation
Risk Management: Place stop-loss just beyond the false breakout wick; target the opposite side of the inside bar range
Trend Alignment: Best results when trading in the direction of the higher timeframe trend
Cooldown Period: Increase the cooldown on lower timeframes to reduce noise; decrease on higher timeframes for more signals
Settings Explained
Signal Settings
Show Bullish/Bearish IBFB: Toggle each signal type independently
Cooldown Period: Minimum bars between signals (prevents over-trading)
Visual Settings
Show Arrows: Display ⬆⬇ markers on chart
Show Last 5 Signals Table: Display signal history panel
Bullish/Bearish Color: Customize signal colors
Alert Settings
Enable Alerts: Turn on/off automatic alert notifications
Why This Indicator?
Unlike many indicators that lag behind price action, the IBFB indicator identifies real-time market manipulation and traps. False breakouts often indicate:
Stop-loss hunting by institutional traders
Exhaustion of buying/selling pressure
Potential trend reversals or strong counter-moves
This makes it an excellent tool for contrarian traders and those looking to fade false moves.
Performance Notes
Signals confirm at bar close (no repainting)
Optimized for speed and efficiency
Works alongside other indicators without conflicts
Suitable for manual and automated trading strategies
Suitable for any instrument & market
Disclaimer: This indicator is for educational purposes only. Always practice proper risk management and combine with your own analysis before making trading decisions. Happy trading.

KDJ在 TradingView 发表脚本时,**描述(Description)** 非常重要。审核员要求描述必须详细说明脚本的**原理、独特性以及用法**,否则容易被驳回。
由于你的参数 (63, 21, 5) 非常特殊,属于“长周期/季度线”级别的设置,我在撰写描述时重点突出了它**“过滤噪音”**和**“捕捉中长期趋势”**的特点。
以下是为你准备的发布文案,包含**标题**和**正文(中英双语)**。你可以直接复制使用。
---
### 标题 (Title)
**KDJ Trend Filter (63, 21, 5) **
### 描述正文 (Description)
*(复制以下内容到 TradingView 的描述框中)*
** **
**Overview**
This is a custom KDJ indicator designed for **medium-to-long term trend analysis**. Unlike the default parameters (9, 3, 3) which are often too sensitive and prone to false signals in volatile markets, this script uses a specific set of parameters **(63, 21, 5)** to smooth out the noise.
**Why these parameters?**
* **N = 63 (Calculation Period):** Represents approximately one quarter (3 months) of trading days. This aligns the indicator with the quarterly trend rather than weekly fluctuations.
* **M1 = 21 (Smooth K):** A significantly higher smoothing factor for the K-line. This reduces the "jitter" and ensures that a crossover usually indicates a genuine shift in momentum.
* **M2 = 5 (Smooth D):** The smoothing period for the D-line.
**How to use**
1. **Trend Identification:** Due to the long period, this KDJ acts more like a trend-following tool than a typical oscillator.
2. **Crossovers:**
* **Golden Cross (K > D):** Suggests a potential start of a medium-term bullish trend.
* **Dead Cross (K < D):** Suggests a potential start of a medium-term bearish trend.
3. **Filtering:** This setup is excellent for filtering out market noise. It will react slower than standard KDJ but provides more reliable signals for swing traders.
**Settings**
* Calculation Period: 63
* MAC1 (K Smoothing): 21
* MAC2 (D Smoothing): 5
---
** **
**概述**
这是一个专为**中长期趋势分析**设计的 KDJ 指标。标准的 KDJ 参数(9, 3, 3)在震荡行情中过于敏感,容易产生虚假信号。本脚本采用了特定的长周期参数 **(63, 21, 5)**,旨在过滤短期市场噪音,捕捉更稳健的趋势方向。
**参数逻辑**
* **计算周期 (N) = 63:** 大约对应一个季度(3个月)的交易日。这意味着指标关注的是季度级别的价格位置,而非短期波动。
* **MAC1 (M1) = 21:** K值的平滑周期。相比默认值,21的平滑度极高,这使得 K 线非常平稳,只有在趋势发生实质性改变时才会转向。
* **MAC2 (M2) = 5:** D值的平滑周期。
**使用方法**
1. **趋势识别:** 由于周期较长,该指标具有“钝化”的特性,更适合作为趋势跟踪工具,而非短线超买超卖指标。
2. **交叉信号:**
* **金叉 (K上穿D):** 通常意味着中级行情的启动。
* **死叉 (K下穿D):** 通常意味着中级调整的开始。
3. **过滤噪音:** 在横盘震荡期间,该参数设置能有效减少频繁的交叉信号,帮助交易者拿住波段。
**默认设置**
* 计算周期:63
* MAC1:21
* MAC2:5
---
### 💡 发表前的检查清单 (Checklist)
1. **代码确认**:确保你的 Pine Script 代码中 `overlay=false`(因为 KDJ 是副图指标)。
2. **图表展示**:在点击发表前,最好在图表上画几条线或标记,展示一下金叉和死叉的位置,这样更容易通过审核,也能让用户一眼看懂。
3. **分类 (Category)**:建议选择 **"Trend Analysis" (趋势分析)** 和 **"Oscillators" (震荡指标)**。
如果你需要我帮你微调代码以符合上述描述(例如添加颜色填充或特定的信号标记),请告诉我!


Sticky Last 7 Days Highs and LowsHighs and lows marked for last 7 days, to get the clear picture of the range of the chart in last 7 days.

GC A Share Filter at Ox StreetThis a dummy indicator to help select potential shares based on momentum theory for GC A share market.
