Long-Leg Doji Breakout StrategyThe Long-Leg Doji Breakout Strategy is a sophisticated technical analysis approach that capitalizes on market psychology and price action patterns.
Core Concept: The strategy identifies Long-Leg Doji candlestick patterns, which represent periods of extreme market indecision where buyers and sellers are in equilibrium. These patterns often precede significant price movements as the market resolves this indecision.
Pattern Recognition: The algorithm uses strict mathematical criteria to identify authentic Long-Leg Doji patterns. It requires the candle body to be extremely small (≤0.1% of the total range) while having long wicks on both sides (at least 2x the body size). An ATR filter ensures the pattern is significant relative to recent volatility.
Trading Logic: Once a Long-Leg Doji is identified, the strategy enters a "waiting mode," monitoring for a breakout above the doji's high (long signal) or below its low (short signal). This confirmation approach reduces false signals by ensuring the market has chosen a direction.
Risk Management: The strategy allocates 10% of equity per trade and uses a simple moving average crossover for exits. Visual indicators help traders understand the pattern identification and trade execution process.
Psychological Foundation: The strategy exploits the natural market cycle where uncertainty (represented by the doji) gives way to conviction (the breakout), creating high-probability trading opportunities.
The strength of this approach lies in its ability to identify moments when market sentiment shifts from confusion to clarity, providing traders with well-defined entry and exit points while maintaining proper risk management protocols.
How It Works
The strategy operates on a simple yet powerful principle: identify periods of market indecision, then trade the subsequent breakout when the market chooses direction.
Step 1: Pattern Detection
The algorithm scans for Long-Leg Doji candles, which have three key characteristics:
Tiny body (open and close prices nearly equal)
Long upper wick (significant rejection of higher prices)
Long lower wick (significant rejection of lower prices)
Step 2: Confirmation Wait
Once a doji is detected, the strategy doesn't immediately trade. Instead, it marks the high and low of that candle and waits for a definitive breakout.
Step 3: Trade Execution
Long Entry: When price closes above the doji's high
Short Entry: When price closes below the doji's low
Step 4: Exit Strategy
Positions are closed when price crosses back through a 20-period moving average, indicating potential trend reversal.
Market Psychology Behind It
A Long-Leg Doji represents a battlefield between bulls and bears that ends in a stalemate. The long wicks show that both sides tried to push price in their favor but failed. This creates a coiled spring effect - when one side finally gains control, the move can be explosive as trapped traders rush to exit and momentum traders jump aboard.
Key Parameters
Doji Body Threshold (0.1%): Ensures the body is truly small relative to the candle's range
Wick Ratio (2.0): Both wicks must be at least twice the body size
ATR Filter: Uses Average True Range to ensure the pattern is significant in current market conditions
Position Size: 10% of equity per trade for balanced risk management
Pros:
High Probability Setups: Doji patterns at key levels often lead to significant moves as they represent genuine shifts in market sentiment.
Clear Rules: Objective criteria for entry and exit eliminate emotional decision-making and provide consistent execution.
Risk Management: Built-in position sizing and exit rules help protect capital during losing trades.
Market Neutral: Works equally well for long and short positions, adapting to market direction rather than fighting it.
Visual Confirmation: The strategy provides clear visual cues, making it easy to understand when patterns are forming and trades are triggered.
Cons:
False Breakouts: In choppy or ranging markets, price may break the doji levels only to quickly reverse, creating whipsaws.
Patience Required: Traders must wait for both pattern formation and breakout confirmation, which can test discipline during active market periods.
Simple Exit Logic: The moving average exit may be too simplistic, potentially cutting profits short during strong trends or holding losers too long during reversals.
Volatility Dependent: The strategy relies on sufficient volatility to create meaningful doji patterns - it may underperform in extremely quiet markets.
Lagging Entries: Waiting for breakout confirmation means missing the very beginning of moves, reducing potential profit margins.
Best Market Conditions
The strategy performs optimally during periods of moderate volatility when markets are making genuine directional decisions rather than just random noise. It works particularly well around key support/resistance levels where the market's indecision is most meaningful.
Optimization Considerations
Consider combining with additional confluence factors like volume analysis, support/resistance levels, or other technical indicators to improve signal quality. The exit strategy could also be enhanced with trailing stops or multiple profit targets to better capture extended moves while protecting gains.
Best for Index option,
Enjoy !!
"Candlestick" için komut dosyalarını ara

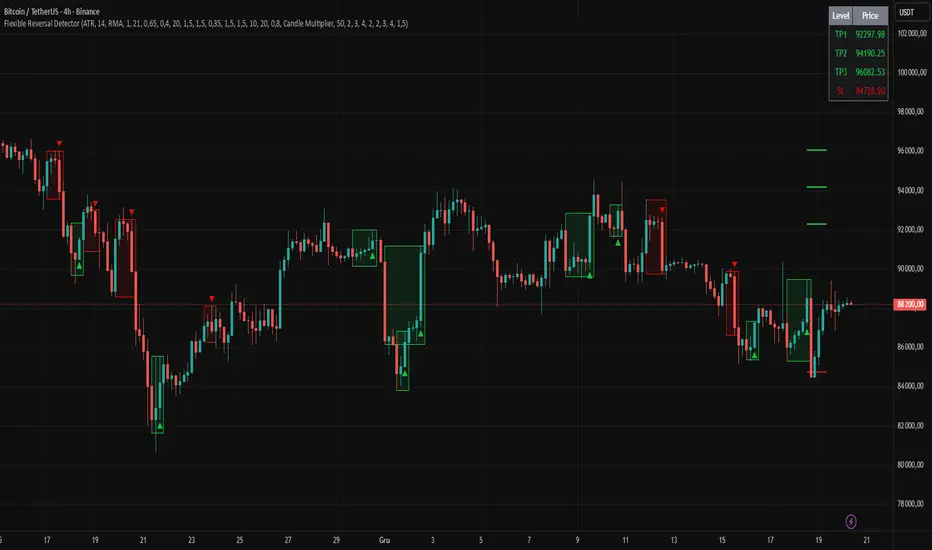
Flexible Reversal DetectorFlexible Reversal Detector
An advanced, fully customizable analytical tool designed to identify local trend reversal zones based on candlestick formations. Users have full control over all logic parameters, making it adaptable to different trading styles and preferences.
Key Features
Adjustable maximum pattern length (number of candles)
Customizable body size ratios for initial, middle, and final candles
Configurable minimum price movement (in %) required before a pattern is considered valid
Colored horizontal lines showing the full length of the pattern – helpful in identifying structure, potential support/resistance zones
Optional volume filter – the volume of the final candle is compared to a volume SMA; multiplier can be adjusted (e.g. 1 = equal to average, 0.8 = 80% of average)
Logic Overview
U Pattern
Each bearish candle is treated as a potential start of a reversal pattern.
Subsequent candles, if small enough and within defined thresholds, form the middle part of the structure.
When a bullish candle with a sufficiently large body appears, it is marked as the final candle of the pattern.
The pattern is considered valid if it was preceded by a defined percentage price drop and – optionally – if the volume condition was met.
∩ Pattern
Each bullish candle may act as the initial candle of a potential reversal pattern in the opposite direction.
Following smaller candles form the middle part, as long as they meet the defined criteria.
The appearance of a strong bearish candle marks the end of the formation.
If this pattern is preceded by a certain price increase (and optionally meets the volume filter), it is highlighted on the chart.
Note: On markets with low volatility or on lower timeframes, it is recommended to reduce the percentage thresholds for signal detection. For more dynamic price action or higher timeframes, consider increasing them accordingly.
Visualization
The final candle of the pattern is marked visually on the chart (depending on direction)
Colored horizontal lines indicate the full span of the pattern – from initial to final candle
Three Candle Bullish Engulfing StrategyThe Three Candle Bullish Engulfing Strategy is a versatile, multi-mode trading system designed for TradingView, combining classic candlestick patterns with momentum confirmation and dynamic risk management. This script supports both swing trading and intraday approaches, as well as an optional RSI-based breakout mode for additional signal filtering.
Key Features:
Three Candle Pattern Detection:
The strategy identifies potential trend reversal points using a three-candle pattern:
The first candle is a strong bullish (or bearish) move.
The second candle is a doji or small-bodied candle, indicating indecision.
The third candle is a bullish (or bearish) engulfing candle that closes above (or below) the previous high (or low), confirming the reversal.
Flexible Trading Modes:
Swing Long Only: Enter long trades on bullish three-candle setups.
Intraday Long & Short: Trade both long and short based on bullish and bearish three-candle patterns, with automatic session-end exits.
RSI Breakout Mode: Enter long trades when the 1-hour RSI exceeds a user-defined threshold (default 80) and a bullish candle forms, with breakout confirmation and a fixed-percentage stop loss.
Visual Aids:
Plots the RSI breakout trigger price and stop loss on the chart for easy monitoring.
How It Works:
Three Candle Pattern Entries:
Long Entry: Triggered when a bullish candle is followed by a doji, then a bullish engulfing candle closes above the previous high.
Short Entry (Intraday only): Triggered by the inverse pattern—bearish candle, doji, then bearish engulfing candle closing below the previous low.
RSI Breakout Entries:
When the RSI on a higher timeframe (default 1 hour) exceeds the set threshold and a bullish candle forms, the script records a trigger price.
A long trade is entered if the price breaks above this trigger, with a stop loss set a fixed percentage below.
Exits:
Positions are closed if the trailing stop is hit, the session ends (for intraday mode), or the stop loss is triggered in RSI breakout mode.
In RSI breakout mode, positions are also closed if a new breakout trigger forms while in position.

Engulfing DetectorThis script detects classic candlestick reversal patterns known as Engulfing formations:
Bullish Engulfing: A green candle fully engulfs the previous red candle.
Bearish Engulfing: A red candle fully engulfs the previous green candle.
🔎 Features:
Works on any time frame or instrument.
Optional filter to ignore overly large or irregular candles.
Visual signals on the chart (BE/SE labels).
Built-in alerts for automation or notification.
✅ Recommended usage:
For intraday trading, this indicator performs best on the 5-minute chart of the Nasdaq (NQ) between 9:45 AM and 1:00 PM ET (15:45–19:00 CET).
💡 Suggested trading approach:
Optimized for scalping with short-term trades and small take-profits around +0.10%.

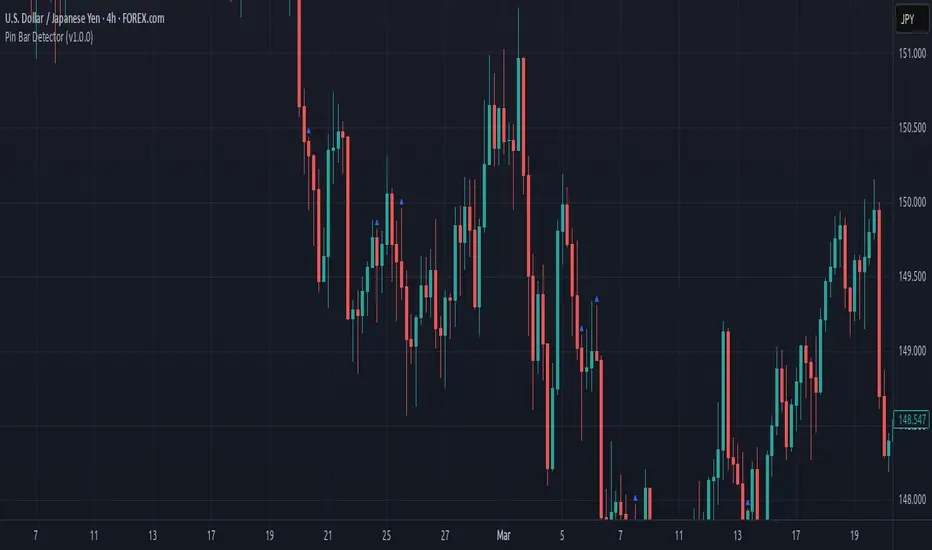
Pin Bar Detector (v1.0.0) Description:
This script detects Pin Bar candlestick patterns based on their shadows and body size.
It analyzes the candle's structure and trend direction using moving averages
to determine valid Pin Bars in an uptrend or downtrend.
The purpose of this script is to help traders identify potential reversal points
by spotting Pin Bar formations in line with the prevailing market trend.
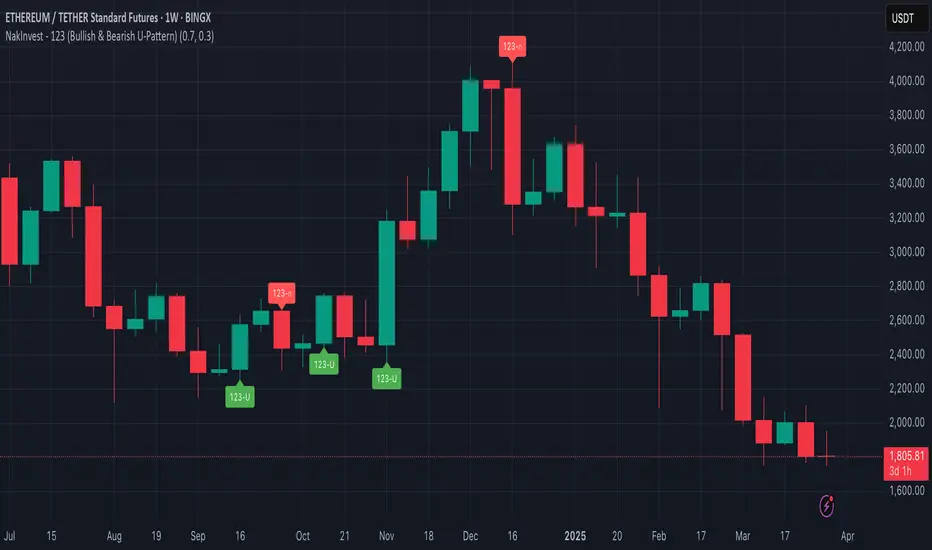
NakInvest - 123 (Bullish & Bearish U-Pattern)📘 Description: U-Shape 123 (Bullish & Bearish Identifier)
This indicator helps you identify the 123 reversal pattern, a powerful yet simple price action setup taught by renowned Brazilian trader Stormer.
I learned this pattern from Lucas Nakata, founder of NakInvest, who was a student of Stormer. Stormer has popularized and refined this setup in the Brazilian trading community, especially for identifying U-shaped reversals that precede strong directional moves.
⸻
🔎 What is the 123 Pattern?
The 123 pattern is a 3-candle formation used to spot bullish or bearish reversals. It forms a “U” or inverted “U” shape and is based purely on candlestick structure — no indicators or lagging signals.
There are two versions:
✅ Bullish 123 (“U” pattern)
• Candle 1: Red candle with a large body (selling pressure).
• Candle 2: Small candle of any color (pause or indecision).
• Candle 3: Green candle with a body at least 70% the size of candle 1 (strong bullish push).
This indicates a potential bullish reversal from a prior downtrend.
❌ Bearish 123 (inverted “U” pattern)
• Candle 1: Green candle with a large body (buying pressure).
• Candle 2: Small candle of any color (pause or indecision).
• Candle 3: Red candle with a body at least 70% the size of candle 1 (strong bearish push).
This indicates a potential bearish reversal from a prior uptrend.
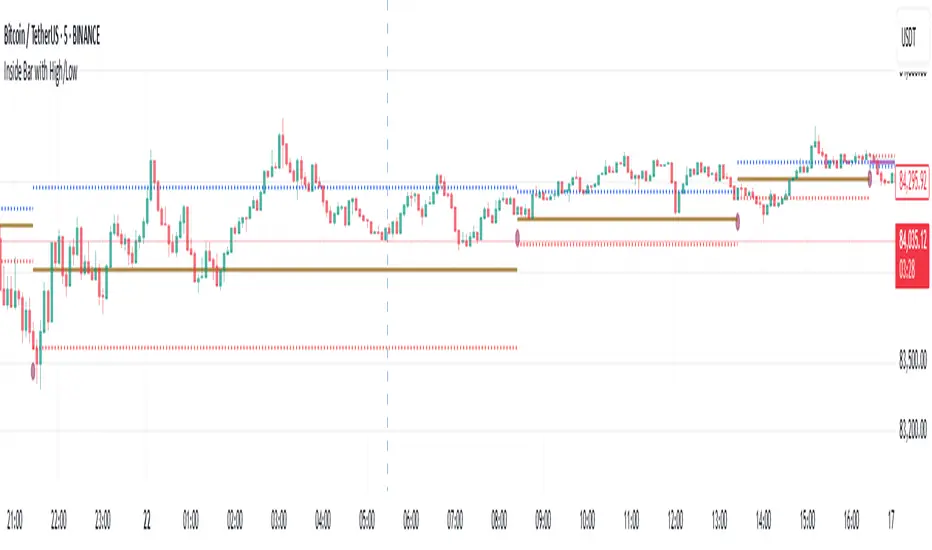
Inside Bar with High/LowInside Bar with High/Low
The indicator plots horizontal mid line between two Inside bars with High / Low with Multi Time Frame Selection by the user which can be traded in trending markets in the direction of the trend, when traded this way they are typically referred to as a ‘Breakout Play’ or an inside bar ‘Price Action Breakout Pattern’ They can also be traded counter-trend, typically from ‘Key Chart Levels’ , when traded this way they are often referred to as ‘Inside Bar Reversals’ .
The classic entry for an inside bar signal is to place a buy stop or sell stop at the high or low of the mother bar, and then when price breakouts above or below the mother bar, your entry order is filled with best time frame preferably more than 1 hour.
Stop loss placement is typically at the opposite end of the mother bar, or it can be placed near the mother bar halfway point (50% level), typically if the mother bar is larger than average.
It’s worth noting that these are the ‘classic’ or standard entry and stop loss placements for an inside bar setup is a useful tool for traders looking to identify potential reversals using the 20/50 EMA and candlestick patterns. However, like any trading tool, it should be used in conjunction with other indicators and analysis techniques for better accuracy
And also this tool is especially useful for day traders who want to track price action during specific times of the day and make informed decisions based on market behavior with more than 60 minutes period
As always, back testing and customization are recommended to optimize performance across different market conditions
In the end, experienced traders may decide on other entries or stop loss placements as they see fit.
Please remember that this indicator is provided for educational purposes only and does not constitute financial advice
Strong Engulfing Candlestick (With Alerts)Detect only Strong Bullish and Strong Bearish Engulfing candle patterns and provide visual signals along with alerts.
Key Features
Bullish Engulfing Detection:
Conditions:
Current candle's close > open (bullish).
Previous candle's close < open (bearish).
Current candle's high ≥ Previous candle's high (includes wicks).
Current candle's low ≤ Previous candle's low (includes wicks).
The body of the current bullish candle is stronger than the previous bearish candle.
Signal: Plots a green upward arrow below the bar when conditions are met.
Bearish Engulfing Detection:
Conditions:
Current candle's close < open (bearish).
Previous candle's close > open (bullish).
Current candle's high ≥ Previous candle's high (includes wicks).
Current candle's low ≤ Previous candle's low (includes wicks).
The body of the current bearish candle is stronger than the previous bullish candle.
Signal: Plots a red downward arrow above the bar when conditions are met.
Alerts:
Custom alerts are included for both bullish and bearish engulfing patterns:
Bullish Alert Message: "Strong Bullish Engulfing detected!"
Bearish Alert Message: "Strong Bearish Engulfing detected!"

ATR 3x Multiplier StrategyBeta version
Volatility and Candle Spikes in Trading
Volatility
Volatility refers to the degree of variation in the price of a financial asset over time. It measures how much the price fluctuates and is often associated with risk and uncertainty in the market. High volatility means larger price swings, while low volatility indicates more stable price movements.
Key aspects of volatility:
Measured using indicators like Average True Range (ATR), Bollinger Bands, and Implied Volatility (IV).
Influenced by factors such as market news, economic events, and liquidity.
Higher volatility increases both risk and potential profit opportunities.
Candle Spikes
A candle spike (or wick) refers to a sudden price movement that forms a long shadow or wick on a candlestick chart. These spikes can indicate strong buying or selling pressure, liquidity hunts, or stop-loss triggers.
Types of candle spikes:
Bullish Spike (Long Lower Wick): Indicates buyers rejected lower prices, pushing the price higher.
Bearish Spike (Long Upper Wick): Suggests sellers rejected higher prices, pushing the price lower.
Stop-Loss Hunt: Market makers may trigger stop-losses by creating artificial spikes before reversing the price.
News-Induced Spikes: Economic data releases or unexpected events can cause sudden price jumps.
Understanding volatility and candle spikes can help traders manage risk, spot entry/exit points, and avoid false breakouts. 🚀📈

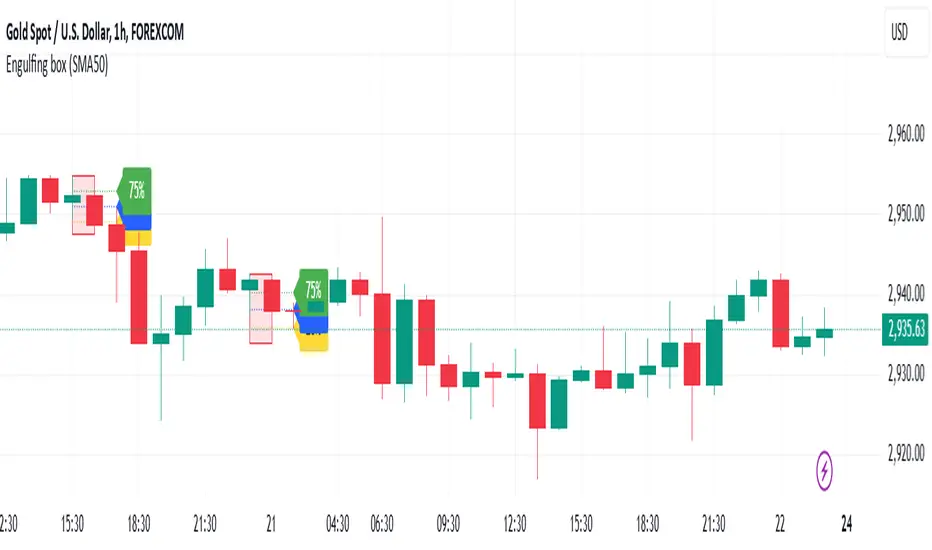
Engulfing BoxEngulfing Day Trading Strategy | Version 1.0
This indicator highlights Bullish and Bearish Engulfing candlestick patterns, designed for day trading strategies. It identifies key market reversals and potential breakout points using simple price action principles.
🔑 Features:
Detects Bullish and Bearish Engulfing patterns based on customizable trend filters.
Automatically draws percentage levels (20%, 50%, and 75%) for target zones.
Bullish Engulfing → Levels drawn top to bottom.
Bearish Engulfing → Levels drawn bottom to top.
Highlights the engulfing candle and previous bar with colored boxes.
Supports trend detection using SMA50 or SMA50 & SMA200.
Alert conditions for both bullish and bearish setups.
Ideal for scalping, day trading, and identifying potential reversals.
📊 How to Use:
Apply the indicator on your preferred time frame (5M, 15M, 1H, etc.).
Wait for the engulfing pattern to form and monitor the drawn levels for potential entry/exit points.
Use in combination with volume or momentum indicators for enhanced confirmation.
⚠️ Disclaimer:
This is a tool for educational purposes and should not be considered financial advice. Always manage your risk and backtest before live trading.
Inside Bars ITInside Bars IT Indicator
The Inside Bars IT indicator is a powerful tool designed to identify Inside Bars and their extended patterns (InsideBar2) on any chart. An Inside Bar is a candlestick pattern where the current candle's high is lower than the previous candle's high, and the current candle's low is higher than the previous candle's low. This pattern often signals market consolidation and potential breakout opportunities.
The indicator extends the concept of Inside Bars by introducing InsideBar2, which uses the high and low of the first Inside Bar as reference levels. Subsequent candles are classified as InsideBar2 if their high is less than or equal to the reference high and their low is greater than or equal to the reference low.

Candle Ratio Alert**Candle Ratio Alert System for Multi-Pair, 5-Minute Charts**
This Pine Script indicator is designed for traders who want to monitor specific candle patterns across multiple assets on a 5-minute timeframe. The tool calculates the ratio of the candle's body size to its total wick size, allowing you to identify significant candles based on their structure. It is ideal for strategies that rely on candlestick analysis, such as breakout or reversal trading.
### Key Features:
1. **Customizable Threshold**: Set the body-to-wick ratio using an input slider, ensuring flexibility to match your strategy.
2. **Visual Alerts**: The script plots a purple marker above candles that meet the specified criteria, making it easy to spot qualifying patterns at a glance.
3. **Dynamic Alerts**: Integrated alert functionality notifies you via email or app when a candle satisfies the ratio condition. Alerts include the asset's ticker and timeframe for quick action.
4. **Multi-Pair Capability**: Compatible with assets like XAUUSD, BTCUSD, EURUSD, and GBPUSD, making it versatile for Forex and cryptocurrency trading.
### How It Works:
The script calculates the body size and total wick size of each candle. If the ratio exceeds the user-defined threshold, the script triggers a visual marker and sends an alert. The 5-minute timeframe ensures rapid identification of trading opportunities in volatile markets.
With its intuitive interface and powerful alert system, this tool streamlines your trading workflow, helping you stay focused on key market movements. Perfect for both beginners and experienced traders seeking precision and efficiency in their analysis.

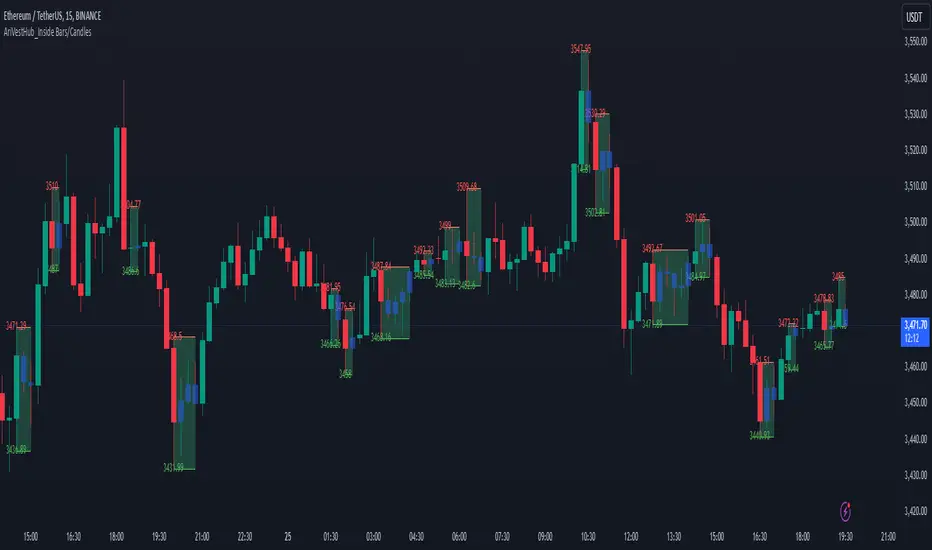
AriVestHub_Inside Bars/Candles
Introduction:
This script identifies and marks inside bars on your TradingView charts. An inside bar pattern is a two-bar candlestick pattern where the second bar is entirely within the range of the first bar. This pattern often signals consolidation and can indicate a potential breakout or trend continuation.
Trading Signals:
Inside bars can indicate potential trading signals. Traders often watch for breakouts above or below the inside bar to identify potential entry points.
Customization:
You can customize the colors, styles, and labels to suit your preferences.
Conclusion
This script is a useful tool for traders looking to identify inside bar patterns on their TradingView charts. By highlighting these patterns, traders can make more informed trading decisions based on potential market consolidations and breakouts.
Bullish Candlestick with No or Small Bottom Wickthis indicator highlights bullish candles with no lower wick of with a very small lower wick. the idea is that when this occurs, price will sooner or later get back to this area. you could use it for a strategy that sets up shorts just below the bullish candle.

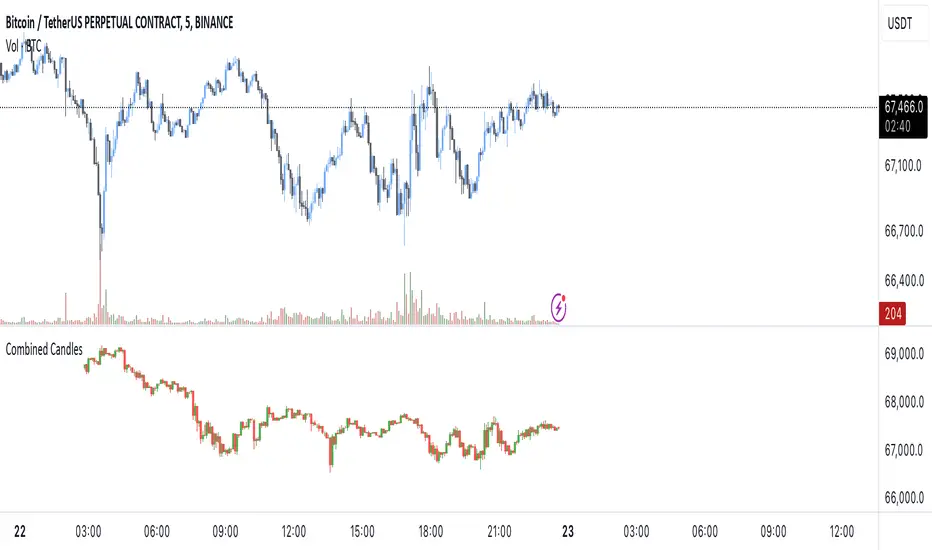
[EmreKb] Combined CandlesThis script combines multiple candlestick patterns into a single, unified candle when they are of the same type (bullish or bearish). Instead of displaying every individual candle on the chart, it merges consecutive candles based on their direction to simplify the visual analysis of price movements.
What It Does:
Combines Candles: If two or more consecutive candles are bullish (close price higher than open price) or bearish (close price lower than open price), the script merges them into a single candle, adjusting the high, low, and close values accordingly.
Displays Merged Candles: The merged candles are drawn on the chart. A green bar represents a bullish period, while a red bar represents a bearish period.
How It Works:
The script tracks whether each candle is bullish or bearish.
If a candle is the same type as the previous one, it updates the combined candle (adjusting the high, low, and close values).
When the type changes (from bullish to bearish or vice versa), it finalizes the current combined candle and starts a new one.
The merged candles are displayed on the chart at the end of the data series.
Use Case:
This script simplifies price action by grouping similar candles together, making it easier to identify trends and spot periods of sustained buying or selling pressure. It can help traders focus on the overall direction of the market rather than being distracted by small fluctuations between individual candles.
Morning Star Pattern### Purpose and Use of the Output
- **Identifying Bullish Reversal**: The Morning Star pattern is a bullish reversal signal that traders look for at the end of a downtrend. When this pattern appears, it suggests that the market may be shifting from bearish to bullish sentiment.
- **Trading Decisions**: Traders can use this indicator to make informed decisions about entering long positions. The appearance of the Morning Star pattern may prompt traders to buy, anticipating a price increase.
- **Visual Representation**: The plotted shape on the chart provides a visual cue for traders, making it easier to spot potential trading opportunities without having to analyze each candle manually.
### Conclusion
This Pine Script code is a useful tool for traders who want to automate the detection of the Morning Star candlestick pattern on their charts. By visually marking this pattern, traders can quickly identify potential bullish reversal points and make more informed trading decisions.
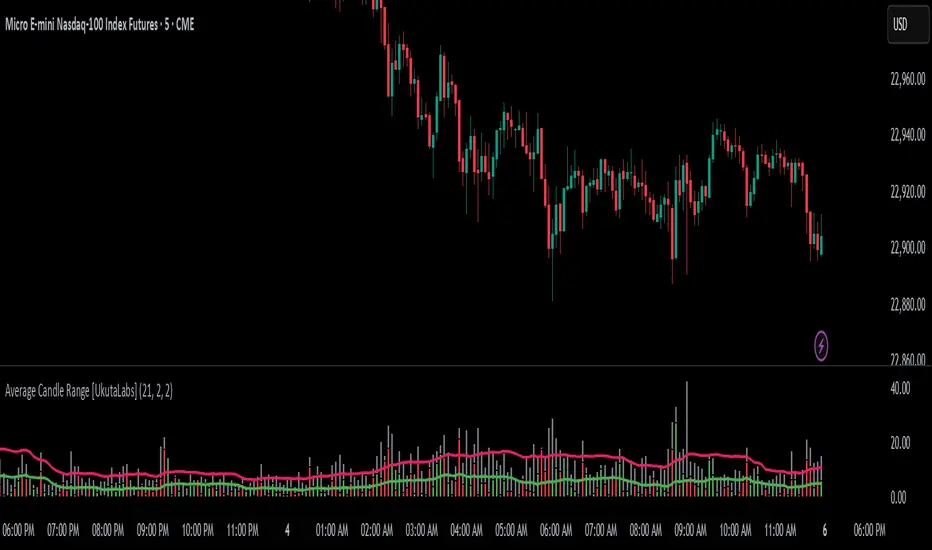
Average Candle Range [UkutaLabs]█ OVERVIEW
The Average Candle Range is a powerful indicator that compares the size of the current bar to past bars. This comparison can be used in a wide variety of trading strategies, allowing traders to understand at a glance the relative size of each candle.
█ USAGE
As each candlestick forms, two bars will be plotted on the indicator. The grey bar represents the total range of the candle from the high to the low, and the second bar represents the body of the bar from the open to the close. Depending on whether the bar is bullish or bearish, the second bar will be colored green or red respectively.
Two averages will also be drawn over these bars that represent the average size of the two bar types over a period that is specified by the user. These averages can be toggled in the indicator settings.
█ SETTINGS
Configuration
• Period: Determines how many bars to use in the calculation of the averages.
• Show Bar Average: Determines whether or not the average for the full bar size is displayed.
• Show Body Average: Determines whether or not the average for the body is displayed.
+4-4 ChartThis overlay indicator provides a visual representation of momentum and price direction within each bar (or candlestick). It does this by comparing the current bar's open, high, low, and close to the previous bar's values, highlighting the following conditions:
Strong Up (Green): All four components (open, high, low, close) are higher than the previous bar.
Weak Up (Light Green): Three out of four components are higher than the previous bar.
Strong Down (Red): All four components are lower than the previous bar.
Weak Down (Light Red): Three out of four components are lower than the previous bar.
White: None of the strong or weak conditions are met, suggesting possible consolidation or indecision.
How to Use: The +4-4 Chart Indicator can be helpful in identifying potential trend continuation patterns, reversals, or periods of consolidation. Traders might use the predominance of green or red to gauge overall market sentiment. It is most useful to visualise long term daily, weekly, monthly market trends for SPY and QQQ etc.

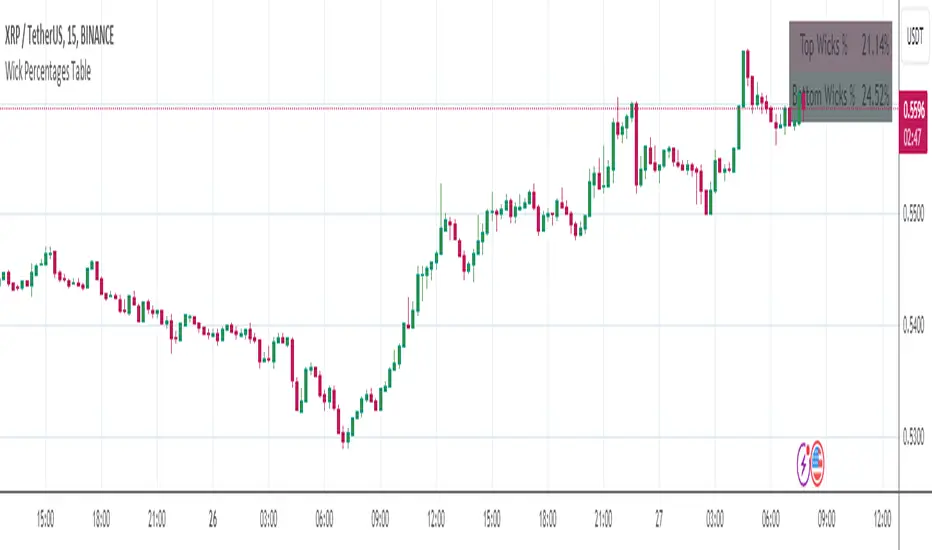
Wick Percentages TableThis script is designed to calculate and display the percentage representation of wick lengths in relation to the total candle range for the last 100 candles on a trading chart. Here's a breakdown of its functionality:
Indicator Initialization: It sets up an indicator named "Wick Percentages Table" (WPT) that overlays on the trading chart.
Variables Initialization: The script initializes variables to store the total lengths of top wicks, bottom wicks, and the total ranges for the last 100 candles.
Wick and Range Calculations: For the past 100 candles, it calculates:
The length of the top wick (the distance between the high and the higher of the open or close).
The length of the bottom wick (the distance between the low and the lower of the open or close).
The total range of each candle (the distance between the high and the low).
Percentage Calculations: It computes the top and bottom wick lengths as percentages of the total candle range across the last 100 candles.
Table Display: It creates or updates a table displayed on the top right of the chart showing these percentages. The table has two rows: one for the "Top Wick %" and another for the "Bottom Wick %", with the corresponding percentages calculated and displayed.
Visibility Maintenance: It plots a dummy variable to ensure the indicator's visibility on the chart.
The purpose of this script is to provide traders with a visual representation of the wick lengths as percentages, offering insights into market behavior and potential price movements based on recent candlestick patterns. It aids in assessing market volatility and trader sentiment through the analysis of wick lengths relative to the total candle sizes.
...
Any improvements to this code would be more then welcome.
I was getting an error in line 30, the only thing I could find was to comment it out.
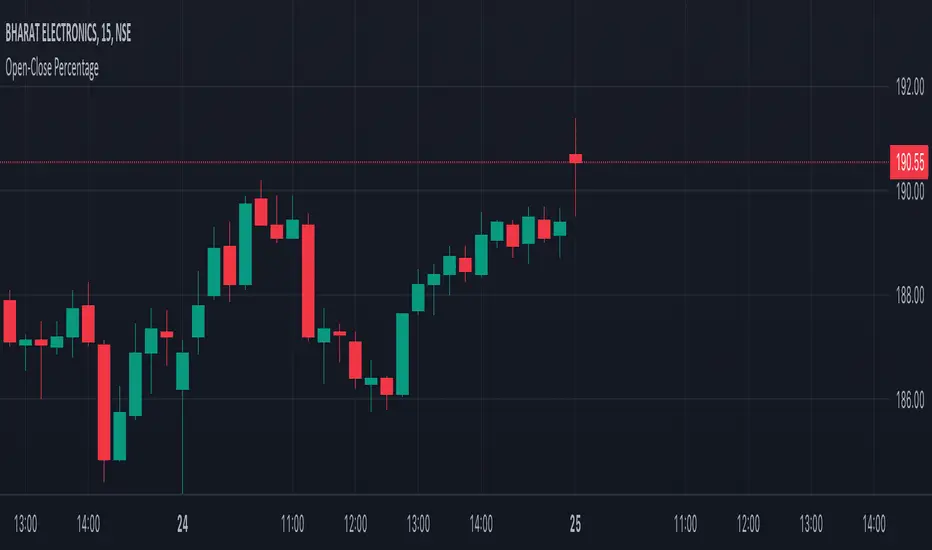
Open-Close PercentageThis indicator will help you to find the body percentage (open close) of the entire candlestick length
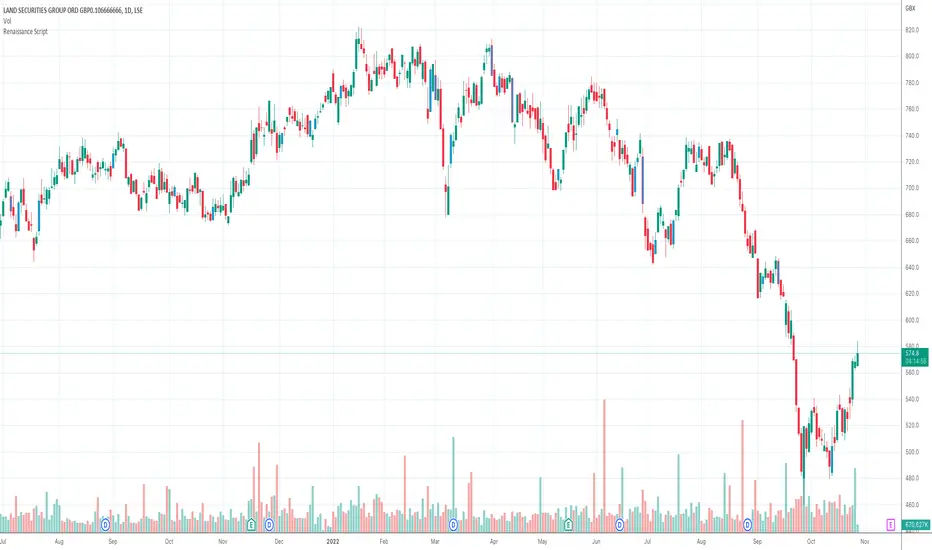
Renaissance ScriptThe Renaissance script is an entry system based on a Morning Star and Evening Star candlestick formation.
Custom Engulfing PatternThis script identifies bullish and bearish engulfing candlestick patterns based on user-defined criteria. It highlights the engulfing patterns on the chart for easy visualization. The script allows for customization of certain parameters to fine-tune the engulfing pattern detection according to the user's preferences.
Features:
Wick Ratio: Define a ratio to ensure that the body of both the current and previous candles comprises a significant portion of the total candle range.
Opposite Candle Condition: Ensures that the current and previous candles are of opposite types (one bullish and one bearish).
Body Size Relative to Previous Candles: Ensures that the body of the current candle is larger than the average body size of a specified number of previous candles.
Body Size Comparison: Ensures that the body of the engulfing candle is not more than 150% of the body of the previous candle.
Color Highlighting: Highlights bullish engulfing patterns in green and bearish engulfing patterns in red on the chart for easy identification.
Parameters:
tolerance (default: 0.0001): A tolerance value to account for minor price discrepancies when comparing candle open and close prices.
wick (default: 0.5): A ratio to define the significance of the candle body relative to the total candle range.
prevCandles (default: 6): Specifies the number of previous candles to consider when calculating the average body size for the body size relative condition.
Usage:
Adjust the tolerance, wick, and prevCandles parameters as needed to fine-tune the engulfing pattern detection to suit your trading style or the specific characteristics of the asset being analyzed. The script will highlight engulfing patterns on the chart, allowing for quick visual identification of potential trading opportunities based on these classic candlestick patterns.
Please note that this script is intended for educational and illustrative purposes. It should not be used as financial advice. Always conduct your own analysis and consult with a financial advisor before making any trading decisions.
Sunil Spinning Top IndicatorThe spinning top is single candlestick pattern can be used as a reversal pattern.
Long Entry ->
If formed near the support go long on the next candle crossing over the high of the spinning top candle.
Stop Loss = Low of the Spinning Top Candle
If formed near the Resistance go short on the next candle crossing under the low of the spinning top candle.
Stop Loss = High of the Spinning Top Candle
Back test and give your feedback.
