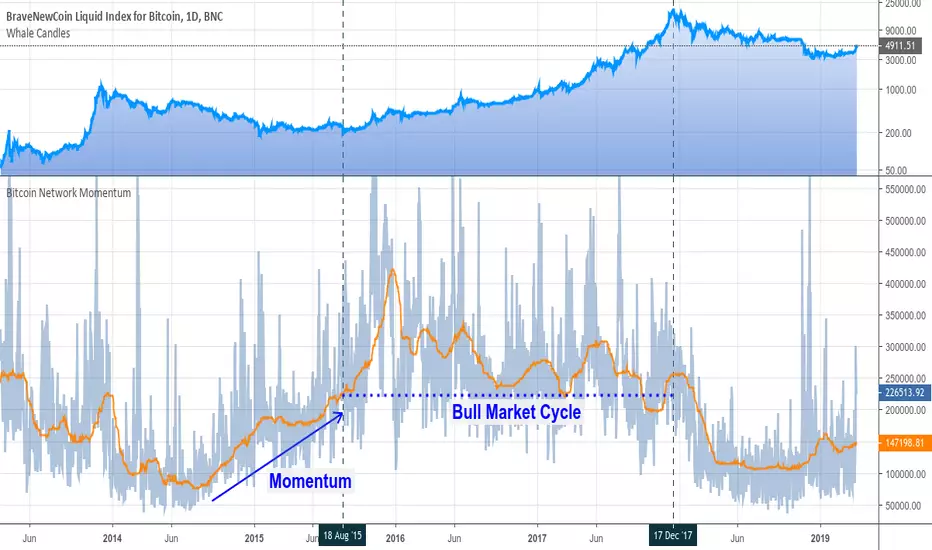
Bitcoin Network MomentumBitcoin Network Momentum is a leading indicator that relates On-Chain Transactional Volume (measured in BTC)with the evolution of the Bitcoin Price.
Further resources:
Woobull charts
Medium article
Credits: PositiveCrypto
"BTC" için komut dosyalarını ara
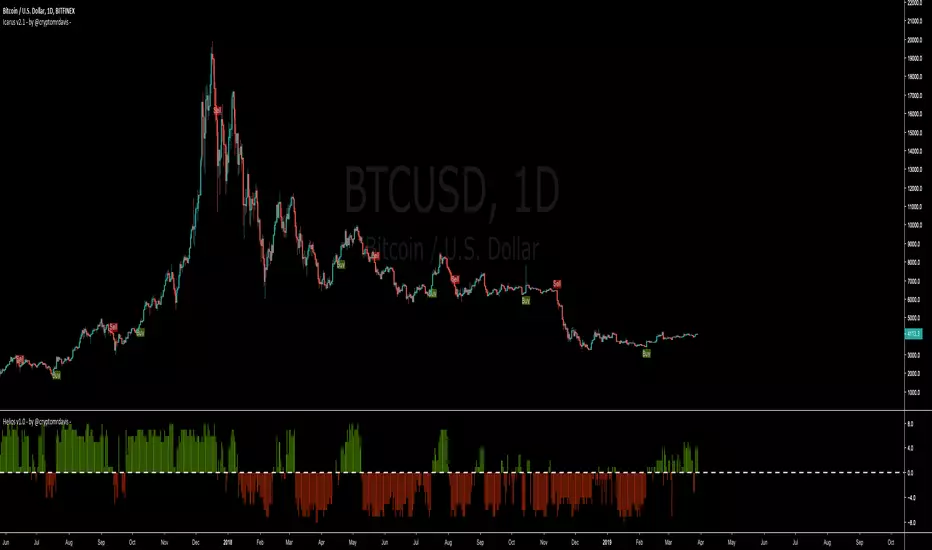
Icarus v2 - by @cryptomrdavis -This is the second version of this indicator. Now you have the ability to find the perfect settings for your asset. Just play around with those settings and if you find good ones, don't hesitate to share it with us.
Buy / Sell Signals will be plotted only once until the signal for open/close appears.
Reduce the noise with the ADX settings but there is still more room for better signals.
Catches most of the biggest moves quick but in the sideways they are still to much noise. Need to improve that. If you have some ideas just get at me.
Hope this tool is useful for you guys
Happy trading
+++ use this tool on your own risk. i'm not responsible for your loses. DYOR +++
____________________________________________________________________________
BTC: 1GVRDK3HHr9CKM5SF2CGpCNXFuavB3L4j9
ETH: 0x7b825fa752b9926D3E8397cDb1d9E5473D074646
XLM: GAXUQJSW55C7MAC4GI26NZUGIKSHFDVFRFKZCXPLMPY4HCADSDT55XK6
BCH: qz57n04ud6mn42u00aymqkku8tfh0lk4jv9c28mjvv
tippin.me
____________________________________________________________________________
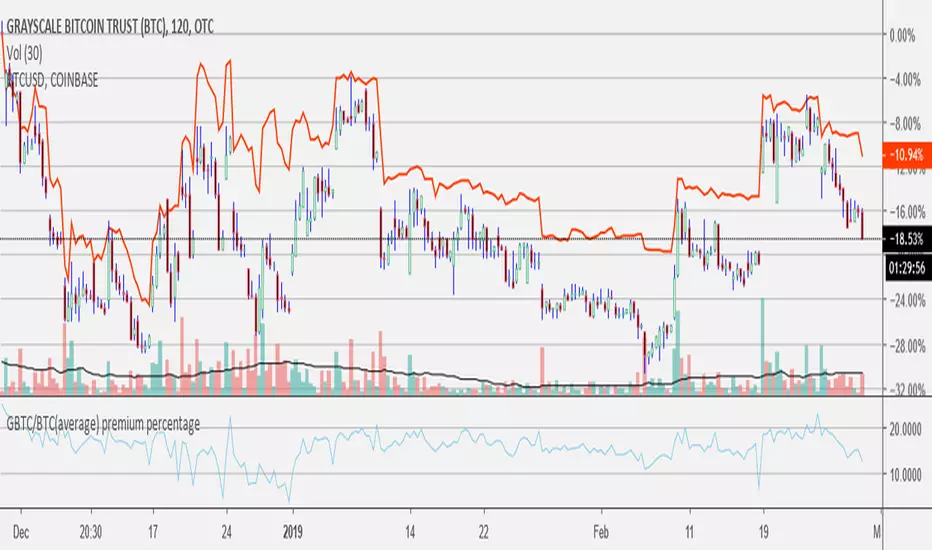
GBTC/BTC(average) premium percentageaverage bitcoin price used (average between bitfinex, coinbase, bitstamp, bittrex, and gemini).
find current amount of bitcoin per share here: grayscale.co
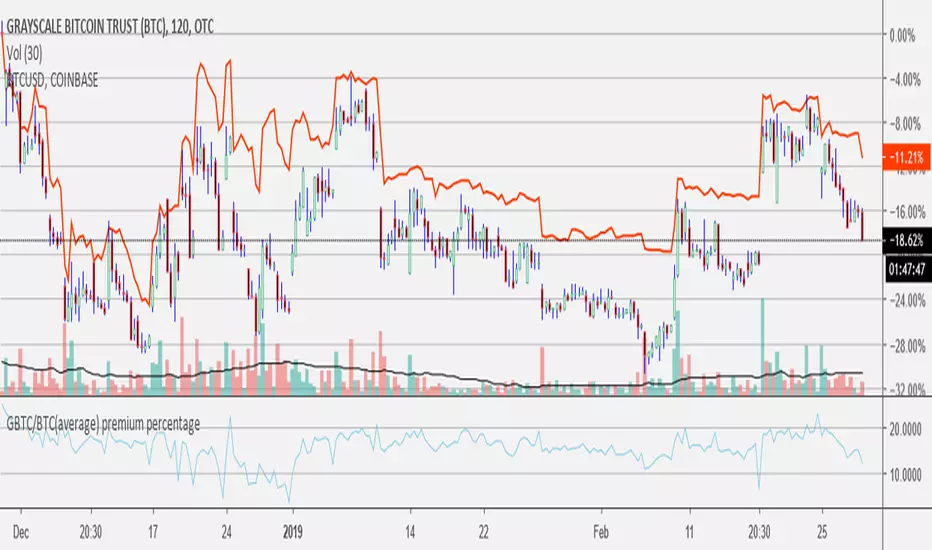
GBTC/BTC(average) premium percentageI updated the GBTC premium percentage indicator to the average bitcoin price (average between bitfinex, coinbase, bitstamp, bittrex, and gemini). I also left this new script open so you can update the amount of bitcoin per share because it is always changing. you can find the amount of bitcoin per share at grayscale.co half way down on the left.
Top 5 coins cummulated Upvol/Dnvol and Money FlowThis script reads price and volume information for the top 5 coins (on 9 exchanges, a total of 29 pairs), calculates the cummulative upvolume and downvolume according to the Money Flow (MFI) formula, and shows upvolume and downvolume separately on the chart as a green and a red line.
The coins used are BTC, ETH, LTC, XRP and EOS. They are the top 5 coins by daily volume, as of 24th of February 2019.
Because of the many security() calls needed, the script is VERY slow, so have lots of patience.
I find it useful as a broad crypto market indicator - for example to compare the current pump with the pumps in the past.
Can also calculate the aggregated Money Flow (MFI) if you check that option in the indicator's configuration. Make sure to wait for recalculation and rescale the chart afterwards - MFI has a value from 0 to 100 and you may need to zoom in.

Bitstamp BTC Horizontal 200 Week SMAsmall change to my horizontal 200 week SMA script.
Plots the latest 200 week SMA value from Bitstamp BTCUSD on the chart. I use it for the Bitmex chart, as Bitmex doesn't have enough history for a 200 week moving average.

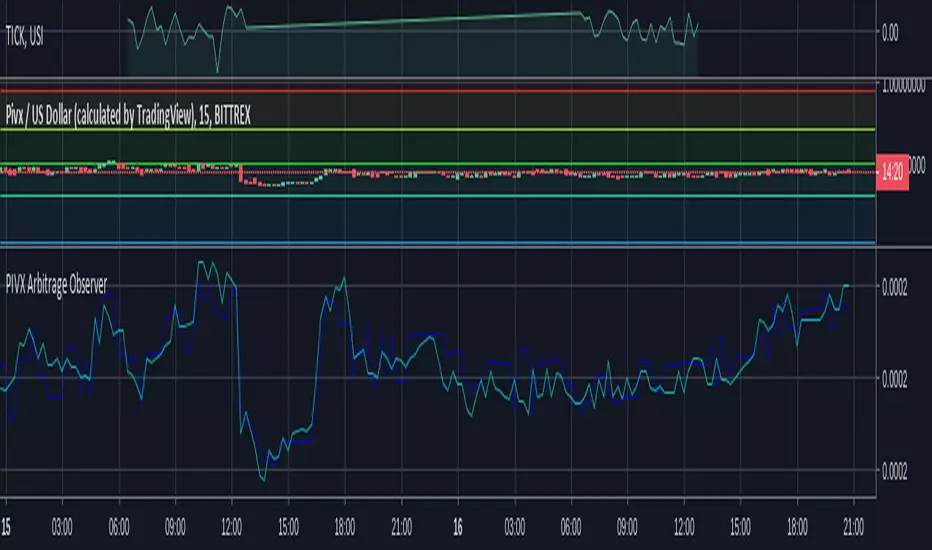
PIVX Arbitrage ObserverObserve PIVX price arbitrage in BTC on two exchanges that TradingView has listed. It's on a bunch more but TV doesn't track them :/
[SignalFI] - FutureFI Free [BTC Long VS Short RSIFutureFI uses the futures (Long and Short) contracts housed on Bitfinex to provide a gauge for the relative difference and strength of interest in buying or selling Bitfinex assets based on total contracts created.
FREE VERSION
Hi All,
Welcome to the free version of FutureFI which shows the RSI of the difference between BTC Long and Short Contracts on Bitfinex. In this version, the difference between the RSI of the contracts can be viewed however the following features are locked for members only:
1) Longpower and Shortpower color shading
2) Total New Longs added column bars
3) Multi-Timeframe Signals
4) Longpower and Shortpower Exhaustion Alert signals
5) Chart Asset Standard RSI Exhaustion Alerts
We hope that you find this useful, and that you're interested in the advanced signaling available in our members only scripts which take this concept to a new level.
Supported Assets:
LongAsset "BTCUSDLONGS"
MEMBER "ETHUSDLONGS","XRPUSDLONGS","EOSUSDLONGS","LTCUSDLONGS","BTGUSDLONGS","ETPUSDLONGS","IOTUSDLONGS","ETCUSDLONGS","ZECUSDLONGS","NEOUSDLONGS","XMRUSDLONGS","ZRXUSDLONGS","OMGUSDLONGS","DSHUSDLONGS","BABUSDLONGS","BSVUSDLONGS","SANUSDLONGS","EDOUSDLONGS","TRXUSDLONGS","XLMUSDLONGS","BATUSDLONGS","VETUSDLONGS","SNGUSDLONGS"
ShortAsset "BTCUSDSHORTS"
MEMBER
"ETHUSDSHORTS","XRPUSDSHORTS","EOSUSDSHORTS","LTCUSDSHORTS","BTGUSDSHORTS","ETPUSDSHORTS","IOTUSDSHORTS","ETCUSDSHORTS","ZECUSDSHORTS","NEOUSDSHORTS","XMRUSDSHORTS","ZRXUSDSHORTS","OMGUSDSHORTS","DSHUSDSHORTS","BABUSDSHORTS","BSVUSDSHORTS","SANUSDSHORTS","EDOUSDSHORTS","TRXUSDSHORTS","XLMUSDSHORTS","BATUSDSHORTS","VETUSDSHORTS","SNGUSDSHORTS"
SignalFI was created to help traders and investors to effectively analyze the market based on the Golden Mean Ratio (Fibonacci numbers), plan a trade and ultimately execute it. To help inform and educate market decisions we developed a set of Trading Indicators which are available on TradingView , the most advanced and yet easy to use charting platform available on the web.
SignalFI indicators are just that, indicators. Our indicators are generally configured to use completely historical data (negating repaint), and we advise all alerts created with SignalFI indicators to be fired upon "close" of the current candle. Our indicators can provide valuable context and visualization support when performing market analysis and executing buy and sell decisions. However. we are not financial experts, and all information presented on this site or our other media outlets are for educational purposes only.

The Liquinator : Bitmex BTC Liquidation LevelsProjects likely regions of liquidation based on significant movements and where bad shorts and longs will be liquidated.
Lime green : 100x long liq region
Green : 50x long liq
Teal : 25x long liq
Red : 100x short liq
Maroon : 50x short liq
Orange: 25x short liq
All donations greatly appreciated
BTC : bc1qc95l8r4n4tucj28236adggfkn58g3727yzhxjl

Volumen Consolidado de BTCVolumen consolidado de BTC tomando en cuenta varios exchanges dónde se comercializa.

Real Volume BTCStudy based and adjusted in real Bitcoin volume. It shows important areas of great activity that will help you make better decisions.
This indicator also shows complete cycles of price action based on volume.
In combination with other indicators, it becomes a powerful tool.

Cumulative OBV for BTC and ETHThis takes the OBV from various exchanges and compiles it into one OBV. Currently using Bitfinex, Bitstamp, Bitmex, Coinbase and Binance. Works for BTC or ETH
Bullish and Bearish divergences are marked.

Bitfinex BTC Shorts & LongsBitfinex BTC Shorts & Longs
The upper bar is entry, the lower bar is exid.
The color of the bar is green for buying and red for selling.

Bitfinex BTC Longs & Shorts Positions Proportion ValueBTCUSDLONGS BTCUSDSHORTS Proportion- Bitfinex BTC Longs & Shorts Positions Proportion Value

Bitfinex BTC Longs & Shorts Positions Difference ValueBTCUSDLONGS BTCUSDSHORTS Difference- Bitfinex BTC Longs & Shorts Positions Difference Value

ATR Entries & Stop Loss [Jigga]This is a simple script that displays multiples of ATR and shows you where the potential zones for longing and shorting are. The majority of people use ATR as a stop loss, so we can use it for our advantage and get in when they are stopped out. There is also a possibility to add a stop loss, so a trader can lose little when he is wrong and maximize profit when he is right. It works the best in ranging markets.
Do not forget to always use a proper stop loss and risk management.
Here you can see it in action:
BTC - BitMex - Range bound market

RSI Bands Multi Time Frame [Jigga + LazyBear]This is a modified version of LazyBear's RSI Bands script. I added the possibility to display multiple RSI bands, so you can see the zones, where it is viable to enter a long or a short. You can also use different time frames, so you can visually see where any specific value of RSI is for your given time frame. This gives you a lot of possibilities. Default settings use 1h time frame and the most common reversal areas for RSI. Feel free to change the settings as you see fit. If the script makes your candles too small, you can go to style and turn off individual RSI bands. After that you will still be able to see the zones, but the scale of your chart won't be affected.
It also displays the middle line, which shows you the current trend and can prevent you from entering a long, when RSI is oversold during a strong downtrend or a short, when RSI is overbought during a strong uptrend.
Do not forget to use a proper stop loss and risk management.
Here you can see it in action in different markets:
BTC - BitMex
NASDAQ Composite - Stocks
EUR / USD - Forex

Bitmex BTC FuturesBitmex / Bitcoin indicator.
Just a simple overlay to visualise the contango / backwardation on Bitmex btc futures products so you know which to take position in, at a glance.
There are two selectable instruments (I have Dec18 and Mar19 selected already). By default the one with nearest settlement date is plotted with a filled coloured band from current price, the other plots a cross symbol.


Volume of BTC (BitMEX/bitfinex/bitFlyer)Volume of BTC
BitMEX : red
bitfinex : green
bitFlyer : blue
For details in Japanese on my website

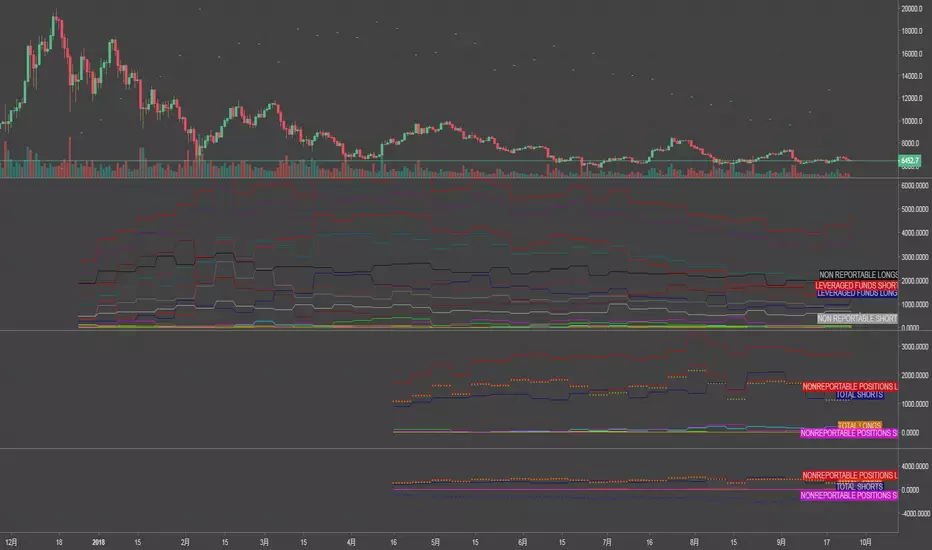
CBOE/CME BTC FUTURE LISThow to pull data from quandl.com
this script for CBOE/CME BTC FUTURE
ex.
if you want to pull www.quandl.com you input "QUANDL:CFTC/1330E1_FO_ALL|n" as TV symbol.("n" is table number)
Bitfinex BTC margin position differencesIf green is over the red it means that longs are currently dominant on BitFinex for BTC.
Same goes if red is over green just that shorts are dominant.
If the green is over red the green will show how many more longs there are than shorts and if you hover over the red you will see how many more shorts there are compared to longs
Vice versa if red is over green .
You can change to a histogram, area, line or any other style of chart in the settings of the indicator
The black dashed line in the middle is 0 aka if u see the indicator go there it means there are an equal amount of longs and shorts
