ANN MACD BTC v2.0 This script is the 2nd version of the BTC Deep Learning (ANN) system.
Created with the following indicators and tools:
RSI
MACD
MOM
Bollinger Bands
Guppy Exponential Moving Averages:
(3,5,8,10,12,15,30,35,40,45,50,60)
Note: I was inspired by the CM Guppy Ema script.
Thank you very much to dear wroclai for his great help.
He has been a big help in the deep learning series.
That's why the licenses in this series are for both of us.
I'm sharing these series and thats the first. Stay tuned and regards!
Note : Alerts added.
"BTC" için komut dosyalarını ara

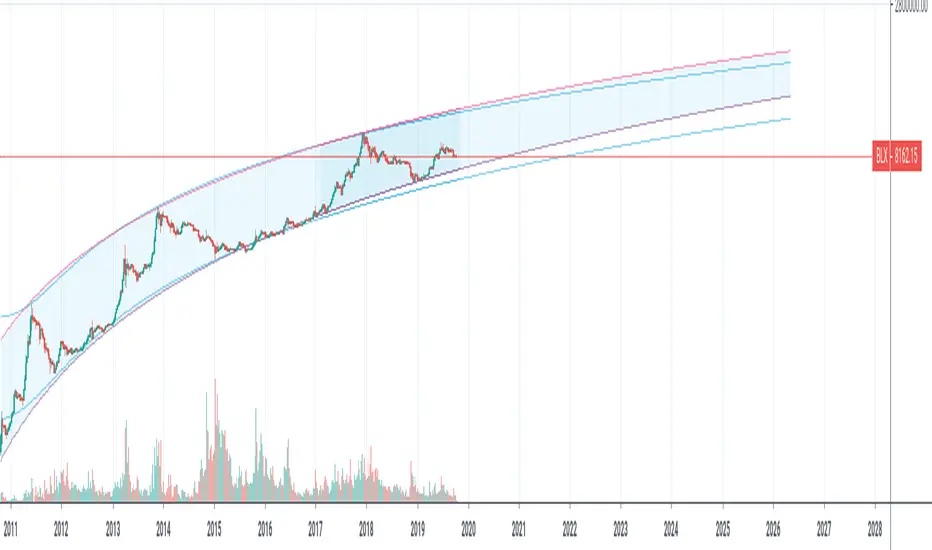
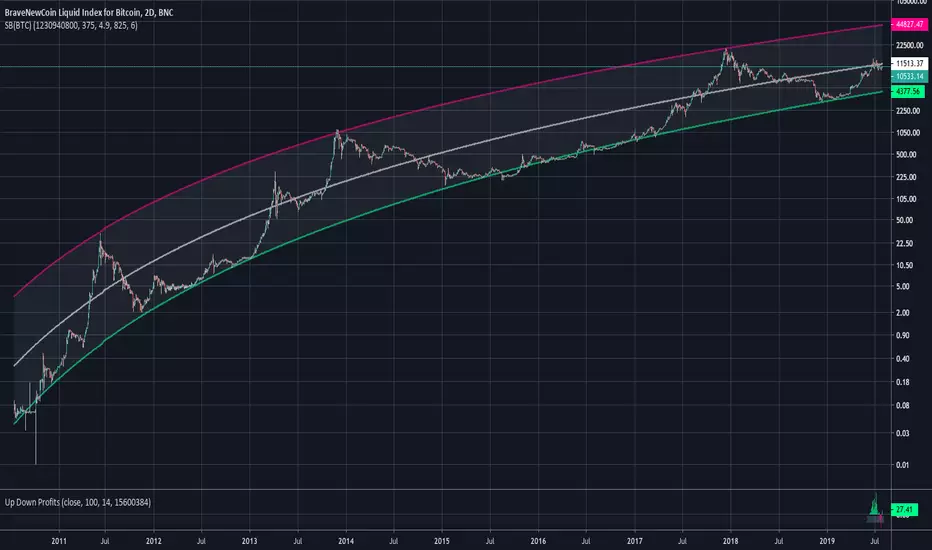
Yope BTC PL channelThis is a new version of the old "Yope BTC tops channel", but modified to reflect a power-law curve fitted, similar to the model proposed by Harold Christopher Burger in his medium article "Bitcoin’s natural long-term power-law corridor of growth".
My original tops channel fitting is still there for comparison. In fact, it looks like the old tops channel was a bit too pessimistic.
Note that these channels are still pure naive curve-fitting, and do not represent an underlying model that explains it, like is the case for PlanB's "Modeling Bitcoin's Value with Scarcity" which uses Stock-to-Flow.
The motivation for this exercise is to observe how long this empirical extrapolation is valid. Will the price of bitcoin stay in either of both channels?
Note on usage: This script _only_ works with the BLX "BraveNewCoin Liquid Index for Bitcoin" in the 1D, 3D and 1W time-frames!
It may be necessary to zoom in and out a few times to overcome drawing glitches caused by the extreme time-shifting of plots in order to draw the extrapolated part.
4HR BTC long/short w/ take profits by Gat TESTCurrently setup for BTC 4 hour only
In testing with other time frames & other coins -> WILL UPDATE SOON

SkyBot - BTC and XBTUSD Trading Bot for CryptoThe SkyBot is written to provide a good balance between long-term trading and short-term for more action. It has been running for over a year before it was decided to share with the public.
SkyBot uses moving price action data from multiple time frames to determine when to go long or short. It also provides the user with the ability to use stop loss and take profit values to match whatever risk management rules you use in your trading.
SkyBot has simple to use alerts making it simple to use with many auto-trading offers.
SkyBot has been coded in the latest version of Pine (v4) and will be updated as new features, functionality, and support is released with Pine.
To get access to SkyBot, please signup here: cryptoscriptking.com
This is the indicator script that is intended to be used to get alerts for the purposes of automation. The strategy script is also included allowing you to do your own backtesting.

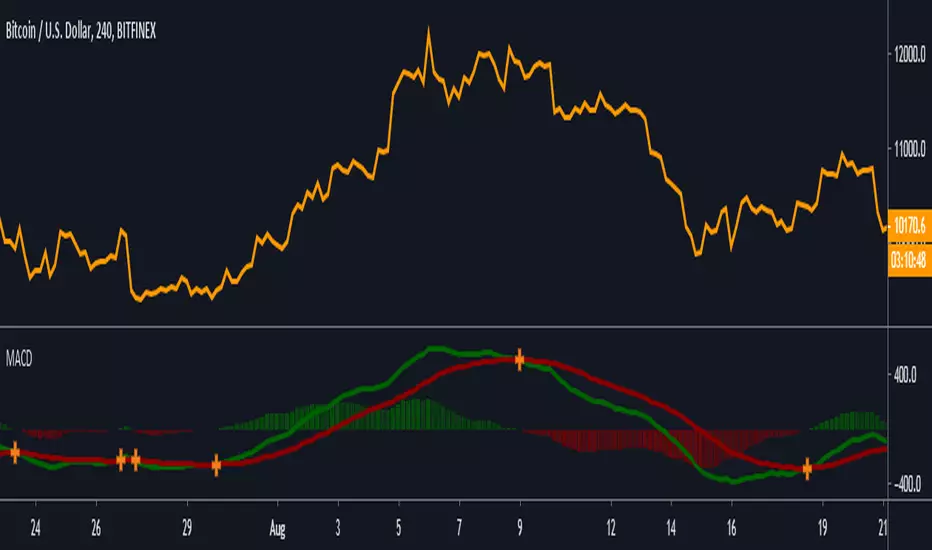
MACD [Gu5]Extremely popular indicator MACD (Moving Average Convergence/Divergence)
Same design of my previous indicators
Show Cross Line for a better visualization
```
Setting recommended for BTC
"Fast Length" = 21
"Slow Length" = 55
"Signal Smoothing" = 14
Other markets try
"Fast Length" = 12
"Slow Length" = 26
"Signal Smoothing" = 9
```
--
El MACD (Convergencia/Divergencia de Medias Móviles) es uno de los mas populares indicadores
Continuando con el mismo estilo de diseño de mis anteriores indicadores
Destaca el cruce de medias para una mejor visualización
msoro daily $1 DCAPlots the dollar value of total btc accrued over the past year by buying 1 dollar's worth daily.
Black line is the breakeven level.

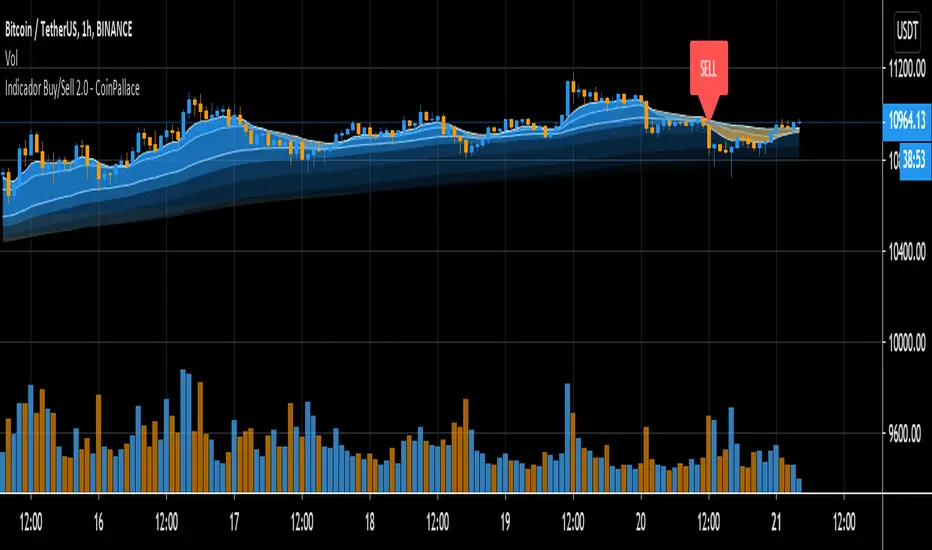
AlphaTradeZone OscillatorAccurate momentum indicator with buy and sell alerts.
Applied to BTC price on 1h timeframe it's giving accurate price predictions.

Support / Resistance TradingDo not worry about drawing the correct support and resistance lines across any time frame. You can enter a long or short position on a major / minor line break out. Feel free to use my script.
Red & Orange - Major and Minor resistance lines.
Lime & Aqua - Major and Minor support lines.
For source code and more info, tip my BTC Jar: 1JddaKpkW4W1UmEuyK9oDUJLA46r1UK2aH

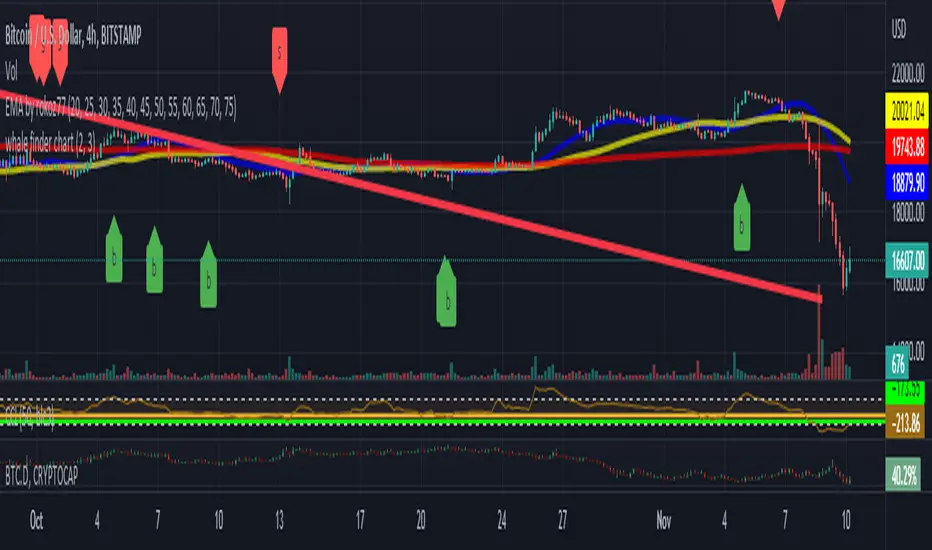
whale finder work very good on BTC 4hour chart
detect the hidden moves in the chart
it give a sell and buy signals and put it on the chart
do not get last candle signal till it close
[SC]SNAP-EX CANDLE : BTCThis indicator shows BTC price in SNAPEX Trading Excange.
average of Houbi, Binance, Coinbase, Bitfinex.
use 1minute chart.


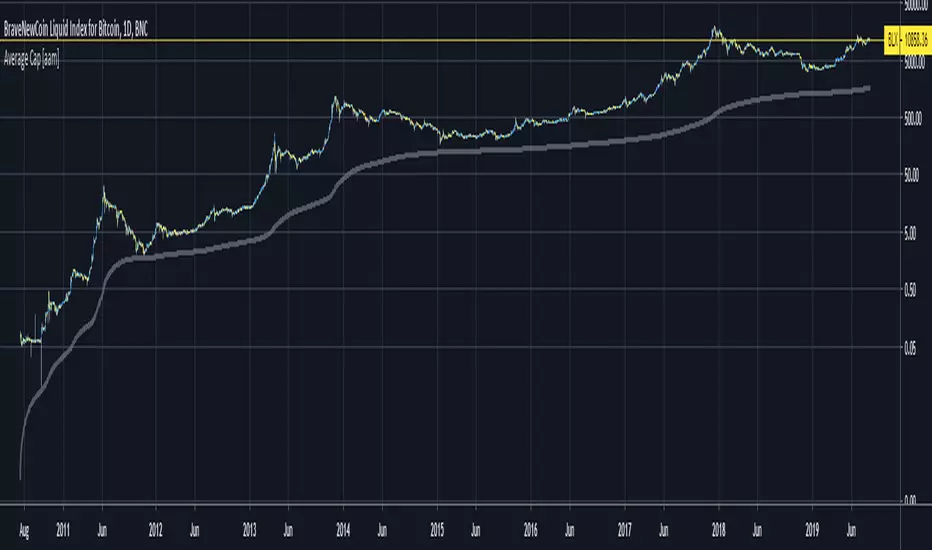
Average Cap [aamonkey]This is the "forever" moving average of the Market Cap.
The cumulative sum of the daily Market Cap values divided by the age of the market in days.
Can be seen as an ultimate bottom that should never be touched and if so is a good buying opportunity.
The default settings are for BTC.
If you want to test this indicator on another chart you have to change the launch date settings (and maybe play around with the multiplier).
Some Interesting Launch dates:
- BTC: 3 JAN 2009
- ETH: 30. JUL 2015
- LTC: 7. OCT 2011
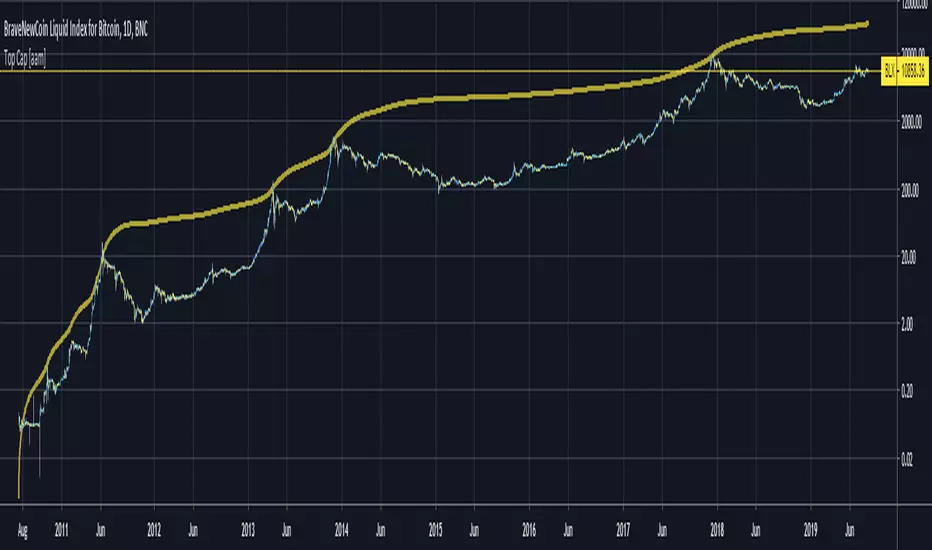
This indicator is also the base for other indicators like my "Top Cap" indicator.
Top Cap [aamonkey]Historically matched market tops for BTC.
It's the Average Cap (see my other indicator) multiplied by 35.
The default settings are for BTC.
If you want to test this indicator on another chart you have to change the launch date settings (and maybe play around with the multiplier).
Some Interesting Launch dates:
- BTC: 3 JAN 2009
- ETH: 30. JUL 2015
- LTC: 7. OCT 2011
RSI Top & Bottom Warning [aamonkey]An enhancement of my RSI Bottom Indicator.
This one finds you Tops & Bottoms.
This indicator uses the RSI and prints you top & bottom warnings directly on the price chart.
The other special thing about this is that the RSI pulls the data from the weekly chart no matter on what timeframe you are on.
The preferred timeframe can, of course, be changed in the settings as well as any thresholds for tops and bottoms.
The default settings are very good for btc, but be free to try and test this indicator with different settings on different charts.

RSI Bottom [aamonkey]This is a modified RSI that prints a bottom signal directly on your price chart.
It pulls the data (in the default settings) from the weekly chart no matter on what timeframe you are on.
You can adjust the timeframe and threshold.
Default settings work best for big BTC cycles.

Crypto InfoPanel (MD)Credits to Daveatt for helping me fix the momentum =)
This panel shows the following:
-BTC LTC ETH prices on different exchanges listed on the panel.
-EMA above/below price 10/20/30/40/50/60/100/200/400 in form of symbols ( based on the "Momentum lines" script)
-MTF Momentum direction in form of symbols 1/3/5/15/30/45/1h/2h/4h/8h/12h/1D/1W/1M (based on the Momentum Divergence script waves)
This script allows you to see every momentum direction of every time frame, put all together into one panel. Making your life easier when scalping with "Momentum divergence" script.
Notes:
If you want me to plot more data into the panel, post a comment what else to add or how to improve the panel.

TOP & BOTTOM Cycle [aamonkey]Works best on BTC and only on the daily timeframe!
This is a TOP / BOTTOM indicator for big market cycles.
These tops and bottoms are based on the difference between the 200MA on the daily and the price.

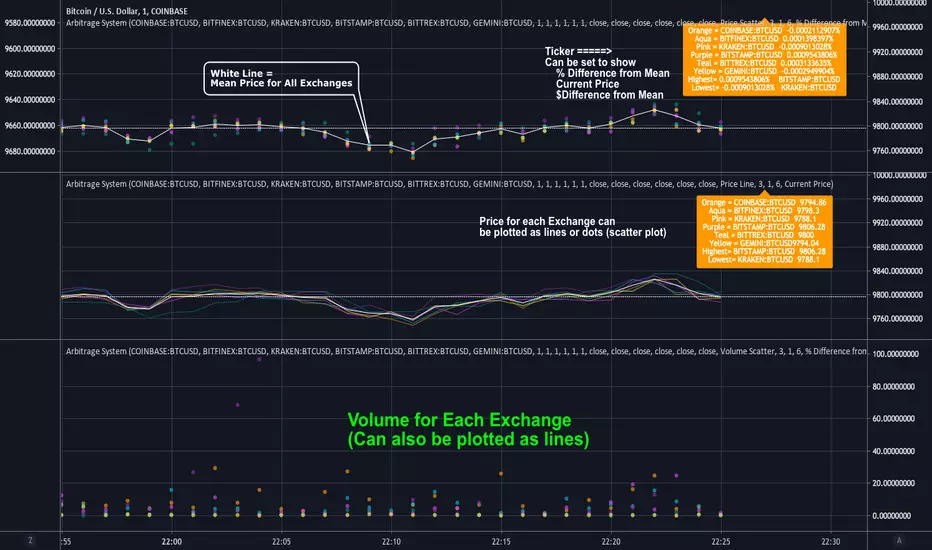
Arbitrage SystemThis script allows you to track the price and volume movement across 6 different exchanges. By default, it is configured for BTC and pulls price and volume data from Gemini, Bitfinex, Bittrex, Bitstamp, Coinbase and Kraken.
Users can use the input options menu to choose which exchanges or symbol is used. It has 4 different modes:
1.Price Scatter: Plots the prices from each exchange around one center white line that represents the mean price across all 6 exchanges.
2. Price Line: Same thing as above, except lines are used instead of circles.
3. Volume Scatter: Plots the volumes for each exchange as colored circles, similar to a scatter plot.
4. Volume Line: Same as above except lines are used instead of circles.
The label in the top right corner displays the current price for each exchange. This can be configured in the input menu and can display
-Current Price
-% Difference from Mean
-$ Difference from Mean
This label also displays the highest and lowest price (or % diff) amongst the 6 exchanges.
Prices are pulled in 1 minute intervals, but the mean price line(white) can be adjusted to show 5, 15, 30, 1 hour or 2 hour avg price across all 6 exchanges.