DMcTrades Trading EngineDMcTrades Trading Engine
Multi-Layer Trend, Structure & Momentum Analysis
This indicator is a comprehensive, rule-based trading framework designed to identify high-quality buy and sell opportunities through multi-timeframe confluence, trend alignment, and price-action confirmation. It combines structure breaks, moving-average alignment, volatility filters, and momentum confirmation into a single, unified visual system.
The script is intended for intraday and short-term swing trading, with particular effectiveness on lower timeframes when higher-timeframe trend alignment is respected.
Core Architecture
The indicator is divided into two independent but complementary engines:
1) Multi-Timeframe Structure & Trend Engine
This engine focuses on directional bias and structural validation.
Key components:
Multi-timeframe EMA alignment (fast and slow timeframes)
Supertrend direction agreement across timeframes
Swing-based Break of Structure (BOS) detection
Configurable trend strictness (Conservative / Balanced / Aggressive)
Optional wick-based or close-based structure confirmation
Signals generated here establish trend-qualified entry permission, not standalone entries.
2) Momentum & Breakout Signal Engine
This engine evaluates entry quality and follow-through probability.
Key components:
Breakout and breakdown detection from recent swing levels
ATR-adjusted volatility and impulse candle filtering
MACD and RSI momentum confirmation
VWAP and higher-timeframe EMA confluence (optional)
Retest-based and impulse-based entry logic
Overextension protection to avoid late entries
Signals are classified as:
CONFIRMED (strong multi-filter confluence)
BASE (core conditions met, fewer filters passed)
Signal Types & Visuals
The indicator provides multiple visual layers:
BUY / SELL triangles for core entries
CONFIRMED BUY / SELL labels for high-confluence setups
Classification boxes highlighting active signal zones
Supertrend overlays (current timeframe + optional 5-minute overlay)
EMA stack visualization (9 / 21 / 50 / 200)
Impulse candle highlighting
Optional reversal warning triangles based on momentum divergence
All visuals are fully configurable and can be enabled or disabled independently.
Risk & Trade Context Features
To help filter lower-probability trades, the suite includes:
Minimum ATR and volume thresholds
Trend stability checks (avoids fresh flips unless momentum is strong)
EMA slope and distance validation
Liquidity sweep and recent structure awareness
Optional higher-timeframe trend agreement
These filters are designed to reduce over-trading and improve signal quality during ranging or low-volatility conditions.
Recommended Usage
Best suited for 1-minute to 15-minute charts
Designed for trend-following and momentum continuation
Works across Forex, indices, commodities, and crypto
Use in conjunction with proper risk management and session awareness
This indicator does not provide take-profit or stop-loss levels and should be used as a decision-support tool, not an automated trading system.
Disclaimer
This script is provided for educational and analytical purposes only.
It does not constitute financial advice. Trading involves risk, and past performance does not guarantee future results.
"BOS" için komut dosyalarını ara

MAJOR PA Zones + Structure + Targets (Gray/Purple)This script highlights major price-action structure (HH/HL/LH/LL), marks BOS/CHOCH events, and draws key supply/demand zones to help visualize trend shifts and potential targets.

USOIL BOS Retest Overlay (HTF + Blocks + Profit Zone + Lot Size)This is a test overlay that should show entry positions and lot sizes to take based on R20 000 account. This was made purely for USOIL

11-MA Institutional System (ATR+HTF Filters)11-MA Institutional Trading System Analysis.
This is a comprehensive Trading View Pine Script indicator that implements a sophisticated multi-timeframe moving average system with institutional-grade filters. Let me break down its key components and functionality:
🎯 Core Features
1. 11 Moving Average System. The indicator plots 11 customizable moving averages with different roles:
MA1-MA4 (5, 8, 10, 12): Fast-moving averages for short-term trends
MA5 (21 EMA): Short-term anchor - critical pivot point
MA6 (34 EMA): Intermediate support/resistance
MA7 (50 EMA): Medium-term bridge between short and long trends
MA8-MA9 (89, 100): Transition zone indicators
MA10-MA11 (150, 200): Long-term anchors for major trend identification
Each MA is fully customizable:
Type: SMA, EMA, WMA, TMA, RMA
Color, width, and enable/disable toggle
📊 Signal Generation System
Three Signal Tiers: Short-Term Signals (ST)
Trigger: MA8 (EMA 8) crossing MA21 (EMA 21)
Filters Applied:
✅ ATR-based post-cross confirmation (optional)
✅ Momentum confirmation (RSI > 50, MACD positive)
✅ Volume spike requirement
✅ HTF (Higher Timeframe) alignment
✅ Strong candle body ratio (>50%)
✅ Multi-MA confirmation (3+ MAs supporting direction)
✅ Price beyond MA21 with conviction
✅ Minimum bar spacing (prevents signal clustering)
✅ Consolidation filter
✅ Whipsaw protection (ATR-based price threshold)
Medium-Term Signals (MT)
Trigger: MA21 crossing MA50
Less strict filtering for swing trades
Major Signals
Golden Cross: MA50 crossing above MA200 (major bullish)
Death Cross: MA50 crossing below MA200 (major bearish)
🔍 Advanced Filtering System1. ATR-Based ConfirmationPrice must move > (ATR × 0.25) beyond the MA after crossover
This prevents false signals during low-volatility consolidation.2. Momentum Filters
RSI (14)
MACD Histogram
Rate of Change (ROC)
Composite momentum score (-3 to +3)
3. Volume Analysis
Volume spike detection (2x MA)
Volume classification: LOW, MED, HIGH, EXPL
Directional volume confirmation
4. Higher Timeframe Alignment
HTF1: 60-minute (default)
HTF2: 4-hour (optional)
HTF3: Daily (optional)
Signals only trigger when current TF aligns with HTF trend
5. Market Structure Detection
Break of Structure (BOS): Price breaking recent swing highs/lows
Order Blocks (OB): Institutional demand/supply zones
Fair Value Gaps (FVG): Imbalance areas for potential fills
📈 Comprehensive DashboardReal-Time Metrics Display: {scrollbar-width:none;-ms-overflow-style:none;-webkit-overflow-scrolling:touch;} ::-webkit-scrollbar{display:none}MetricDescriptionPriceCurrent close priceTimeframeCurrent chart timeframeSHORT/MEDIUM/MAJORTrend classification (🟢BULL/🔴BEAR/⚪NEUT)HTF TrendsHigher timeframe alignment indicatorsMomentumSTR↑/MOD↑/WK↑/WK↓/MOD↓/STR↓VolatilityLOW/MOD/HIGH/EXTR (based on ATR%)RSI(14)Color-coded: >70 red, <30 greenATR%Volatility as % of priceAdvanced Dashboard Features (Optional):
Price Distance from Key MAs
vs MA21, MA50, MA200 (percentage)
Color-coded: green (above), red (below)
MA Alignment Score
Calculates % of MAs in proper order
🟢 for bullish alignment, 🔴 for bearish
Trend Strength
Based on separation between MA21 and MA200
NONE/WEAK/MODERATE/STRONG/EXTREME
Consolidation Detection
Identifies low-volatility ranges
Prevents signals during sideways markets
⚙️ Customization OptionsFilter Toggles:
☑️ Require Momentum
☑️ Require Volume
☑️ Require HTF Alignment
☑️ Use ATR post-cross confirmation
☑️ Whipsaw filter
Min bars between signals (default: 5)
Dashboard Styling:
9 position options
6 text sizes
Custom colors for header, rows, and text
Toggle individual metrics on/off
🎨 Visual Elements
Signal Labels:
ST▲/ST▼ (green/red) - Short-term
MT▲/MT▼ (blue/orange) - Medium-term
GOLDEN CROSS / DEATH CROSS - Major signals
Volume Spikes:
Small labels showing volume class + direction
Example: "HIGH🟢" or "EXPL🔴"
Market Structure:
Dashed lines for Break of Structure levels
Automatic detection of swing highs/lows
🔔 Alert Conditions
Pre-configured alerts for:
Short-term bullish/bearish crosses
Medium-term bullish/bearish crosses
Golden Cross / Death Cross
Volume spikes
💡 Key Strengths
Institutional-Grade Filtering: Multiple confirmation layers reduce false signals
Multi-Timeframe Analysis: Ensures alignment across timeframes
Adaptive to Market Conditions: ATR-based thresholds adjust to volatility
Comprehensive Dashboard: All critical metrics in one view
Highly Customizable: 100+ input parameters
Signal Quality Over Quantity: Strict filters prioritize high-probability setups
⚠️ Usage Recommendations
Best for: Swing trading and position trading
Timeframes: Works on all TFs, optimized for 15m-Daily
Markets: Stocks, Forex, Crypto, Indices
Signal Frequency: Conservative (quality over quantity)
Combine with: Support/resistance, price action, risk management
🔧 Technical Implementation Notes
Uses Pine Script v6 syntax
Efficient calculation with minimal repainting
Maximum 500 labels for performance
Security function for HTF data (no lookahead bias)
Array-based MA alignment calculation
State variables to track signal spacing
This is a professional-grade trading system that combines classical technical analysis (moving averages) with modern institutional concepts (market structure, order blocks, multi-timeframe alignment).
The extensive filtering system is designed to eliminate noise and focus on high-probability trade setups.

CODEX OB + BBMA V1CODEX OB + BBMA is a multi-purpose Smart Money Concepts (SMC) indicator that automatically detects and visualizes key institutional trading elements such as Order Blocks, Fair Value Gaps, Rejection Blocks, Break of Structure, Pivots, High Volume Bars, and several qualitative SMC signals.
In addition to SMC tools, this indicator also incorporates multi-timeframe BBMA logic, allowing traders to view higher-timeframe momentum, trend direction, and volatility envelopes directly from the current chart. This makes it easier to align SMC setups—like OB, FVG, and BOS—with BBMA structure such as MA touches, re-entry zones, extreme candles, and volatility expansions.
This combination helps traders identify institutional footprints, multi-timeframe confluence, and displacement-based setups with high clarity.

Bollinger Bands Forecast [QuantAlgo]🟢 Overview
Bollinger Bands are widely recognized for mapping volatility boundaries around price action, but they inherently lag behind market movement since they calculate based on completed bars. The Bollinger Bands Forecast addresses this limitation by adding a predictive layer that attempts to project where the upper band, lower band, and basis line might position in the future. The indicator provides three unique analytical models for generating these projections: one examines swing structure and breakout patterns, another integrates volume flow and accumulation metrics, while the third applies statistical trend fitting. Traders can select whichever methodology aligns with their market view or trading style to gain visibility into potential future volatility zones that could inform position planning, risk management, and timing decisions across various asset classes and timeframes.
🟢 How It Works
The core calculation begins with traditional Bollinger Bands: a moving average basis line (configurable as SMA, EMA, SMMA/RMA, WMA, or VWMA) with upper and lower bands positioned at a specified number of standard deviations away. The forecasting extension works by first generating predicted price values for upcoming bars using the selected method. These projected prices then feed into a rolling calculation that simulates how the basis line would update bar by bar, respecting the mathematical properties of the chosen moving average type. As each new forecasted price enters the calculation window, the oldest historical price drops out, mimicking the natural progression of the moving average. The system recalculates standard deviation across this evolving price window and applies the multiplier to determine where upper and lower bands would theoretically sit. This process repeats for each of the forecasted bars, creating a connected chain of potential future band positions that render as dashed lines on the chart.
🟢 Key Features
1. Market Structure Model
This forecasting approach interprets price through the lens of swing analysis and structural patterns. The algorithm identifies pivot highs and lows across a definable lookback window, then tracks whether price is forming higher highs and higher lows (bullish structure) or lower highs and lower lows (bearish structure). The system looks for break of structure (BOS) when price pushes beyond a previous swing point in the trending direction, or change of character (CHoCH) when price starts creating opposing swing patterns.
When projecting future prices, the model considers current distance from recent swing levels and the strength of the established trend (measured by counting higher highs versus lower lows). If bullish structure dominates and price sits near a swing low, the forecast biases upward. Conversely, bearish structure near a swing high produces downward bias. ATR scaling ensures the projection magnitude relates to actual market volatility.
Practical Implications for Traders:
Useful when you trade based on swing points and structural breaks
The Structure Influence slider (0 to 1) lets you dial in how much weight structure analysis carries versus pure trend
Helps visualize where bands could form around key structural levels you're watching
Works better in trending conditions where structure patterns are clearer
Might be less effective in choppy, sideways markets without defined swings
2. Volume-Weighted Model
This method attempts to incorporate volume flow into the price forecast. It combines three volume-based metrics: On-Balance Volume (OBV) to track cumulative buying/selling pressure, the Accumulation/Distribution Line to measure money flow, and volume-weighted price changes to emphasize moves that occur on high volume. The algorithm calculates the slope of these indicators to determine if volume is confirming price direction or diverging from it.
Volume spikes above a configurable threshold are flagged as potentially significant, with the direction of the spike (whether it occurred on an up bar or down bar) influencing the forecast. When OBV, A/D Line, and volume momentum all align in the same direction, the model projects stronger moves. When they conflict or show weak volume support, the forecast becomes more conservative.
Practical Implications for Traders:
Relevant if you use volume analysis to confirm price moves
More meaningful in markets with reliable volume data
The Volume Influence parameter (0 to 1) controls how much volume factors into the projection
Volume Spike Threshold adjusts sensitivity to what constitutes unusual volume
Helps spot scenarios where volume doesn't support a move, suggesting possible consolidation
Might be less effective in low-liquidity instruments or markets where volume reporting is unreliable
3. Linear Regression Model
The simplest of the three methods, linear regression fits a straight line through recent price data using least-squares mathematics and extends that line forward. This creates a clean trend projection without conditional logic or interpretation of market characteristics. The forecast simply asks: if the recent trend continues at its current rate of change, where would price be in 10 or 20 bars?
Practical Implications for traders:
Provides a neutral, mathematical baseline for comparison
Works well when trends are steady and consistent
Can be useful for backtesting since results are deterministic
Requires minimal configuration beyond lookback period
Might not adapt to changing market conditions as dynamically as the other methods
Best suited for trending markets rather than ranging or volatile conditions
🟢 Universal Applications Across All Models
Regardless of which forecasting method you select, the indicator projects future Bollinger Band positions that may help with:
▶ Pre-planning entries and exits: See where potential support (lower band) or resistance (upper band) might develop before price gets there
▶ Volatility context: Observe whether forecasted bands are widening (suggesting potential volatility expansion) or narrowing (possible compression or squeeze setup)
▶ Target setting: Reference projected band levels when determining profit targets or stop placement
▶ Mean reversion scenarios: Visualize potential paths back toward the basis line when price extends to a band extreme
▶ Breakout anticipation: Consider where upper or lower bands might sit if price begins a strong directional move
▶ Strategy development: Build trading rules around forecasted band interactions, such as entering when price is projected to return to the basis or exit when forecasts show band expansion
▶ Method comparison: Switch between the three forecasting models to see if they agree or diverge, potentially using consensus as a confidence filter
It's critical to understand that these forecasts are projections based on recent market behavior. Markets are complex systems influenced by countless factors that cannot be captured in a technical calculation or predicted perfectly. The forecasted bands represent one possible scenario of how volatility might unfold, so actual price action may still diverge from these projections. Past performance and historical patterns provide no assurance of future results. Use these forecasts as one input within a broader trading framework that includes proper risk management, position sizing, and multiple forms of analysis. The value lies not in prediction accuracy but in helping you think probabilistically about potential market states and plan accordingly.

HEIST PROPHECY MASTER SUITE v20This is the top level HEIST engine.
Your all-in-one institutional scanner that blends breakout logic, structure mapping, smart zones, trend state and an execution dashboard into one visual system.
MASTER SUITE v20 is built for traders who want everything on the chart without clutter and without guesswork.
You get the bigger picture
the structure
the direction
the levels
and the execution map
all in a single interface.
No strategy leaks.
No code exposure.
Only the outputs.
⸻
⭐ What it displays
• High quality buy and sell signals
• Visual structure shifts (BOS / CHoCH)
• Supply and demand zones
• Liquidity sweep markers
• Clean trend read
• ATR-based risk framework
• TP1, TP2 and TP3 projections
• A compact institutional dashboard showing direction, entry, stop and targets
Everything is visual.
Internal logic stays private.
⸻
⭐ How to use MASTER SUITE v20
1. Load the indicator
Works best on:
• Gold
• Indices
• Major FX pairs
2. Read the trend and signal panel
The dashboard instantly tells you:
• Bullish or bearish trend state
• BUY, SELL or SCANNING mode
• Entry, SL and TP levels
This keeps your decision making clean.
3. Let the chart show the story
The visuals help you see:
• When structure shifts
• Where zones of interest form
• Where liquidity gets taken
• Where continuation or reversal may happen
You’re not guessing anymore.
4. When a HEIST signal appears
Use this simple checklist:
• Does it align with your personal bias?
• Does the dashboard confirm direction?
• Do the levels fit your risk profile?
• Is the market clean or chaotic?
Execution is your choice.
The suite simply organizes the environment.
5. Manage the trade using the built-in levels
• SL is placed visually
• TP1, TP2, TP3 help you scale out or let runners go
• Structure cues help you see when momentum shifts
You control the outcome.
The engine just keeps the map clean.
⸻
⭐ Who MASTER SUITE v20 is made for
• Intraday and swing traders
• Gold and index traders
• Structure-based traders
• Continuation and breakout traders
• Traders who want clean execution without clutter
⸻
⭐ What MASTER SUITE v20 is NOT
• Not a bot
• Not financial advice
• Not a guarantee of outcomes
• Not a replacement for your plan
It’s a visual system designed to support professional-level decision making.
⸻
⭐ Join my free trading ecosystem
Learn how I actually use these tools inside my own workflow:
howtobebullish.com
Want passive exposure to my capital systems?
4xprophet.com/mam
Instagram: @mrkilldamarkets
YouTube: @mrkilldamarkets
Telegram: t.me/prophecyorderflow

Smart Money Time by TMUSMT-Integrated Institutional Structure
This solution addresses a critical limitation in retail technical analysis: Fractal Blindness. While standard indicators operate linearly on a single timeframe, this script utilizes a Synchronous Multi-Timeframe (MTF) Architecture combined with SMT (Smart Money Time) logic to overlay higher-order market structure directly onto your execution chart.
It is engineered to align your entry triggers with the dominant institutional trend, effectively filtering out counter-trend noise that often leads to liquidity sweeps.
Core Technology: The "Fractal-Sync" Engine
1. Hierarchical Trend Propagation (MTF Logic) The script performs a real-time request.security analysis of user-selected higher timeframes to determine the "True State" of the market.
The Mechanism: Instead of repainting historical data, the algorithm uses a Step-Locked logic. It projects the confirmed Swing Highs and Lows of the Higher Timeframe (e.g., 4H) onto your Lower Timeframe (e.g., 5m or 15m).
Practical Value: You instantly visualize the "Big Picture" bias without switching tabs, ensuring your local trades are aligned with the global flow.
2. SMT-Grade Pivot Detection Integrating concepts from Smart Money analysis, the indicator identifies Key Swing Points that have a high probability of defense by large operators.
Technique: By calculating volatility-adjusted deviations (ATR) across multiple timeframes, the script distinguishes between a standard "pullback" and a genuine Structure Shift (MSS) or Break of Structure (BOS).
Benefit: It visually separates weak internal structure (inducement) from strong external structure (protected levels).
Technical Specifications & Filters
To satisfy strict stability requirements and provide objective signals, the engine incorporates unique validation methods:
Volatility Normalization: Structure breaks are validated against a dynamic ATR threshold. This ensures that low-volume consolidation does not trigger false structural resets.
Candle-Close Validation Protocol: A level is considered breached only if the candle body closes beyond the pivot. This filters out "Wick Fakeouts" and Stop-Hunts often seen during news events.
Conflict Resolution: When the Lower Timeframe trend contradicts the Higher Timeframe structure, the indicator visualizes this as a "Retracement Phase," advising caution.
Operational Workflow
This tool acts as a Market Context Filter, not a simple signal generator:
Trend Alignment: Use the visual cues to instantly recognize the dominant institutional flow.
Zone Identification: The script automatically plots "Strong Lows" (Invalidation Points) and "Weak Highs" (Targets).
Execution: Seek entries on your timeframe only when the higher timeframe structure (shown by this script) confirms the direction.
Note for Professional Use: This script is designed for precision execution. It minimizes chart clutter by displaying only confirmed structural points, providing a clean, logic-driven workspace for objective decision-making.

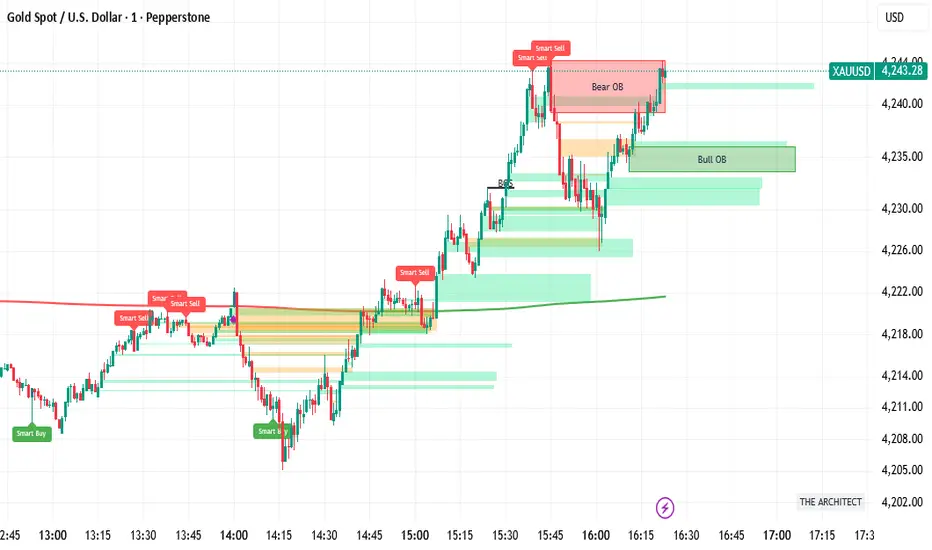
FVH THE ARCHITECT (The Consensus)HE ARCHITECT - Institutional Logic Engine
System Philosophy: THE ARCHITECT is a defensive consensus engine designed to filter market noise and align price structure with institutional momentum. It does not generate signals in isolation; it requires a "Consensus" between Price Action, Volume, and Divergence before confirming a setup.
Core Features:
Institutional Structure: Automatically identifies Order Blocks (Bull/Bear), Fair Value Gaps (FVG), and Break of Structure (BOS) based on fractal logic.
Smart Consensus Filter:
Smart VWAP: Color-coded trend filter (Green = Up, Red = Down).
Volume Spikes: Identifies institutional injection (Purple Candles) at >1.5x average volume.
Smart Reversals: RSI Divergence labels are only printed if the candle color confirms the rejection.
Focus Mode: A toggle to switch between "History Mode" (Context) and "Focus Mode" (Active Zones Only) to reduce chart clutter.
How to Use:
Buy: Wait for price to enter a Green Bull OB. Look for a "Smart Buy" label or Purple Volume Spike.
Sell: Wait for price to enter a Red Bear OB. Look for a "Smart Sell" label.
Alerts: Includes hard-coded alerts for "Smart Buy", "Smart Sell", and "Volume Spikes" for automated notifications.
Stochastic RSI Forecast [QuantAlgo]🟢 Overview
The Stochastic RSI Forecast extends the classic momentum oscillator by projecting potential future K and D line values up to 10 bars ahead. Unlike traditional indicators that only reflect historical price action, this indicator uses three proprietary forecasting models, each operating on different market data inputs (price structure, volume metrics, or linear trend), to explore potential price paths. This unique approach allows traders to form probabilistic expectations about future momentum states and incorporate these projections into both discretionary and algorithmic trading and/or analysis.
🟢 How It Works
The indicator operates through a multi-stage calculation process that extends the RSI-to-Stochastic chain forward in time. First, it generates potential future price values using one of three selectable forecasting methods, each analyzing different market dimensions (structure, volume, or trend). These projected prices are then processed through an iterative RSI calculation that maintains continuity with historical gain/loss averages, producing forecasted RSI values. Finally, the system applies the full stochastic transformation (calculating the position of each forecasted RSI within its range, smoothing with K and D periods) to project potential future oscillator values.
The forecasting models adapt to market conditions by analyzing configurable lookback periods and recalculating projections on every bar update. The implementation preserves the mathematical properties of the underlying RSI calculation while extrapolating momentum trajectories, creating visual continuity between historical and forecasted values displayed as semi-transparent dashed lines extending beyond the current bar.
🟢 Key Features
1. Market Structure Model
This algorithm applies price action analysis by tracking break of structure (BOS) and change of character (CHoCH) patterns to identify potential order flow direction. The system detects swing highs and lows using configurable pivot lengths, then analyzes sequences of higher highs or lower lows to determine bullish or bearish structure bias. When price approaches recent swing points, the forecast projects moves in alignment with the established structure, scaled by ATR (Average True Range) for volatility adjustment.
Potential Benefits for Traders:
Explores potential momentum continuation scenarios during established trends
Identifies areas where structure changes might influence momentum
Could be useful for swing traders and position traders who incorporate structure-based analysis
The Structure Influence parameter (0-1 scale) allows blending between pure trend following and structure-weighted forecasts
Helps visualize potential trend exhaustion through weakening structure patterns
2. Volume-Weighted Model
This model analyzes volume patterns by combining On-Balance Volume (OBV), Accumulation/Distribution Line, and volume-weighted price returns to assess potential capital flow. The algorithm calculates directional volume momentum and identifies volume spikes above customizable thresholds to determine accumulation or distribution phases. When volume indicators align directionally, the forecast projects stronger potential moves; when volume diverges from price trends, it suggests possible reversals or consolidation.
Potential Benefits for Traders:
Incorporates volume analysis into momentum forecasting
Attempts to filter price action by volume support or lack thereof
Could be more relevant in markets where volume data is reliable (equities, crypto, major forex pairs)
Volume Influence parameter (0-1 scale) enables adaptation to different market liquidity profiles
Highlights volume climax patterns that sometimes precede trend changes
Could be valuable for traders who incorporate volume confirmation in their analysis
3. Linear Regression Model
This mathematical approach applies least-squares regression fitting to project price trends based on recent price data. Unlike the conditional logic of the other methods, linear regression provides straightforward trend extrapolation based on the best-fit line through the lookback period.
Potential Benefits for Traders:
Delivers consistent, reproducible forecasts based on statistical principles
Works better in trending markets with clear directional bias
Useful for systematic traders building quantitative strategies requiring stable inputs
Minimal parameter sensitivity (primarily controlled by lookback period)
Computationally efficient with fast recalculation on every bar
Serves as a baseline to compare against the more complex structure and volume methods
🟢 Universal Applications Across All Models
Each forecasting method projects potential future stochastic RSI values (K and D lines), which traders can use to:
▶ Anticipate potential crossovers: Visualize possible K/D crosses several bars ahead
▶ Explore overbought/oversold scenarios: Forecast when momentum might return from extreme zones
▶ Assess divergences: Evaluate how oscillator divergences might develop
▶ Inform entry timing: Consider potential points along the forecasted momentum curve for trade entry
▶ Develop systematic strategies: Build rules based on forecasted crossovers, slope changes, or threshold levels
▶ Adapt to market conditions: Switch between methods based on current market character (trending vs range-bound, high vs low volume)
In short, the indicator's flexibility allows traders to combine forecasting projections with traditional stochastic signals, using historical K/D for immediate reference while considering forecasted values for planning and analysis. As with all technical analysis tools, the forecasts represent one possible scenario among many and should be used as part of a broader trading methodology rather than as standalone signals.

FRPC - Fractal Reversal Permission ComponentThis tool identifies high-probability reversal points using a three-stage confirmation model:
1️⃣ Liquidity Sweep (LS)
Price must take out a previous fractal high/low, indicating stop-hunt liquidity removal.
2️⃣ Reclaim (RC)
After sweeping liquidity, price must close back inside the previous swing, showing absorption and rejection.
3️⃣ Break of Structure (BOS)
A structural break confirms a true shift in market direction and avoids false reversal signals.
FRPC only triggers BUY or SELL signals when all three layers align, creating actionable reversal conditions rather than random fractal noise.
This approach helps avoid chasing breakouts, filters low-quality sweeps, and identifies areas where reversals are statistically more likely.
------------------------------------
What FRRC Helps You Identify
------------------------------------
True reversals after stop-hunts
Liquidity grabs followed by displacement
Avoiding fake breakouts
Swing points with strong reaction potential
High-probability turning points with real structure support
----------
Sidenote
----------
The accuracy of the signals range from 56% to 72% and is mainly designed to be a structural filter to be paired with a strong exhaustion system. This is just a bare bones version and I plan to work on a more advanced version yo pair with the current exhaustion systems I'm building out

MTF 4h Structure + FVG (CORRECTED)This is a fully customizable Multi-Timeframe (MTF) indicator for SMC traders. It overlays true Higher Timeframe market structure onto your current chart. While it defaults to the 4-Hour (4h) structure, you can easily change this to 1h, Daily, or Weekly in the settings to suit your strategy.
Key Features:
1. Dynamic MTF Overlay: Select any Higher Timeframe (HTF) in the settings. The script calculates true pivots on that timeframe and projects them onto your chart without repainting issues.
2. Active Dealing Range: Automatically displays the Swing High and Swing Low of the selected HTF.
3. Equilibrium (EQ): Marks the 50% level of the range to help you identify Premium (Sell) vs. Discount (Buy) zones.
4. HTF Fair Value Gaps (FVG): Detects and draws unmitigated FVGs from your selected timeframe, acting as high-probability POIs.
Visuals & Logic:
- Green/Red: Signals CHoCH (Trend Reversals).
- Gray: Signals BOS (Trend Continuation) - keeping the chart clean.
- Smart Calculation: Calculates structure explicitly on the HTF data to prevent false signals on lower timeframes.
How to use:
1. Add to your chart (e.g., 5m or 15m).
2. Open Settings -> Select your desired "Higher Timeframe" (Default is 4h).
3. Trade in the direction of the HTF Trend (Labels) and look for entries within HTF FVGs in the correct Discount/Premium zone.

Momentum Candle by DNDFXMomentum Candle v2 is a simple yet powerful indicator designed to detect strong momentum candles based on candle body size and the ratio between the body and total wick.
This indicator is ideal for traders who focus on:
Momentum trading
Breakout strategies
XAUUSD (Gold) scalping
Supply & Demand / Smart Money Concepts (SMC) confirmation
🔧 How the Indicator Works
The indicator analyzes each candle and classifies it as a Bullish Momentum or Bearish Momentum candle when these conditions are met:
✅ The candle body exceeds the minimum size
✅ The total wick is smaller compared to the body
✅ The Body-to-Wick ratio meets the strength filter
Visual signals include:
Green background for bullish momentum
Red background for bearish momentum
Up/Down triangle markers as entry guidance
⚙️ Customizable Parameters
Min Body Size (Points) – Sets the minimum candle body size
Min Body : Wick Ratio – Controls how dominant the body is compared to the wicks
All parameters can be optimized according to your trading style and timeframe.
✅ Best Use Cases
This indicator is useful for:
Breakout confirmation
Momentum validation
Filtering false breakouts
Scalping and intraday trading on XAUUSD
🧠 Trading Tips
For better accuracy, combine this indicator with:
Support & Resistance
Supply & Demand zones
Break of Structure (BOS) / CHoCH
Best performance on M5 – H1 timeframes.
⚠️ DISCLAIMER
This indicator is a supporting tool, not a guaranteed profit system. Always apply proper risk management. You are fully responsible for your trading decisions.

TrendForce X🔹 Indicator Overview
This indicator is built to give traders simple, reliable, and high-probability signals by combining three powerful concepts:
market structure, trend direction, and premium/discount zones.
It removes complexity and delivers clean BUY and SELL signals that align with the true flow of the market.
📌 Key Features
Accurate trend detection to stay aligned with market direction
Premium & Discount model to identify smart-money price zones
Automatic Market Structure analysis ( CHoCH & BOS )
BUY signals when price shifts bullishly from a discount area
SELL signals when price breaks structure bearish from a premium area
Clean, user-friendly visual signals
Works on any pair , market , or timeframe .
🟢 Buy Signal Logic
A BUY signal is generated when:
Price is in a discount zone
The market shows a bullish change of structure
This combination filters out weak setups and highlights strong upside reversals.
🔻 Sell Signal Logic
A SELL signal is triggered when:
Price is in a premium zone
The market forms a bearish break of structure
This helps catch high-probability downside moves with precision.
⚠️ Disclaimer
This indicator is a powerful tool, but no indicator guarantees 100% accuracy. Always practice proper risk management and confirm signals with your trading plan.

Liquidations (TV Source / Manual / Proxy) Cruz Pro Stack + Liquidations (TV Source / Manual / Proxy) is a high-confluence crypto trading indicator built to merge reversal detection, volatility timing, structure confirmation, and liquidation pressure into one clean decision engine.
This script combines five pro-grade components:
1) RSI Divergence (Regular + Hidden)
Detects early momentum shifts at tops and bottoms to anticipate reversals before price fully reacts.
2) BBWP (Bollinger Band Width Percentile)
Identifies volatility compression and expansion cycles to time breakout conditions and avoid low-quality chop.
3) Market Structure (BOS / CHOCH proxy)
Confirms trend continuation or change-of-character using swing breaks for more reliable directional bias.
4) Liquidations Layer (3 Modes)
Adds liquidation-driven context for where price is likely to squeeze or flush next:
TV Source: Use TradingView’s built-in Liquidations plot when available.
Manual Totals: Paste 12h/24h/48h long/short totals for higher-level regime bias.
Proxy (Volume Shock): A fallback approximation for spot charts using volume + candle direction.
The script automatically converts your chart timeframe into rolling 12/24/48-hour windows, then computes a weighted liquidation bias and a spike detector to flag potential exhaustion moves.
5) Confluence Score + Signals
A simple scoring engine highlights high-probability setups when multiple factors align.
Signals are printed only when divergence + structure + volatility context agree with liquidation pressure.
How to use
Best on BTC/ETH perps across 15m–4H.
For maximum accuracy:
Add TradingView’s Liquidations indicator (if your exchange/symbol supports it).
Set Liquidations Mode = TV Source.
Select the Liquidations plot as the source.
If that plot can’t be selected, switch to Proxy or Manual Totals.
What this indicator is designed to improve
Earlier reversal recognition
Cleaner breakout timing
Structure-confirmed entries
Better risk management around liquidation-driven moves
Fewer low-quality trades during dead volatility

AJ Price Action Trading SetupThe AJ Price action trading setup Involves :
1. Buy / Sell Signals Based On Previous Price Action
2. BOS/ COCH Showing Trend Reversals
3. Market Momentum Based On Price Action
Disclaimer :
Never Take trades based on Indicator only, make your own analysis and trade accordingly.
Price Action is not every body cup of cake, we are trading against smart and educated institutions its not easy to steal money from them.There is nothing in this world which helps in guaranteed returns,no indicator have done yet neither this one do.Try to Control your emotions and do not over trade.This is my updated version of my previous indicator Previous Candle Breakout Startegy.Follow and Comment for any clarifications.

AR-LiquidityAR-Liquidity is a clean, “chart-first” liquidity mapping tool built to automatically identify and maintain Buy-Side Liquidity (BSL) and Sell-Side Liquidity (SSL) levels, classify them as IRL / ERL using a dealing range filter, and mark sweeps/raids with an optional raid zone box—while keeping drawings stable using a fixed object bank (no random disappearing lines).
________________________________________
What it detects
1) BSL & SSL (Liquidity Pools)
• BSL (Buy-Side Liquidity): swing highs clustered into meaningful levels (areas where stops tend to rest above price).
• SSL (Sell-Side Liquidity): swing lows clustered into meaningful levels (areas where stops tend to rest below price).
Instead of plotting every single pivot, the script clusters nearby pivots using an ATR-based margin so you get clean, actionable liquidity levels, not noise.
2) IRL / ERL (Dealing Range Context)
Each liquidity level is labeled as:
• IRL (Internal Range Liquidity): inside the dealing range
• ERL (External Range Liquidity): outside the dealing range
By default, the dealing range uses:
• PDH / PDL (Previous Day High / Previous Day Low) as the IRL boundaries.
This helps you instantly understand whether a level is “internal” (often targeted during consolidation/mean reversion) or “external” (often targeted during expansion/displacement).
3) Sweeps / Raids (Liquidity Taken)
A sweep is flagged when price:
• Wicks through a confirmed level
• Then closes back inside (classic raid behavior)
The script marks swept levels with a ✓ check mark in the label.
Optionally, it can draw a raid zone box showing the wick-extreme to the level.
________________________________________
How it draws (stable & clean)
This indicator uses banked objects for lines/labels/boxes. That means:
• No flickering
• No unstable rendering
• No “objects disappearing” when new levels are created
Lines will extend to the right, and can be configured to stop when invalidated (depending on your build/settings).
________________________________________
Inputs (what each one actually means)
Detection
• Swing length (pivot L=R): controls pivot sensitivity (higher = fewer, stronger swings).
• ATR length: ATR basis for clustering margin.
• Cluster margin × ATR: how close pivots must be to merge into one liquidity level.
• Min touches to confirm: how many pivot touches are required before a level is considered valid.
• Max clusters to scan (perf): performance cap for how many stored levels the script checks.
Show / Filters
• Mode (Present/Historical):
o Present focuses on most relevant/active levels.
o Historical can show deeper history depending on your scan/visibility limits.
• Max visible levels per side: maximum number of BSL lines + SSL lines drawn at once.
• Extend levels right: keeps levels projected forward.
• Only above / only below: filter BSL above price and SSL below price (cleaner “current context” view).
• Hide swept levels: removes already-raided levels from view (if you want only “untouched” liquidity).
IRL / ERL (Dealing Range)
• Use PDH/PDL as dealing range: defines IRL boundaries using previous day high/low.
• Show PDH/PDL lines: plots those boundaries as dotted reference lines.
Sweeps / Raid Zones
• Mark sweeps: enables raid detection + check mark labeling.
• Show raid zone box: displays a box from level to wick extreme.
• Raid box extend (bars): how far the box projects to the right.
Style
Full control over:
• IRL vs ERL colors for BSL/SSL
• Line width
• Label size
• Raid box colors
________________________________________
How to use it (practical)
• Use BSL above price as likely upside draw / where liquidity may be taken.
• Use SSL below price as likely downside draw / where liquidity may be taken.
• Use IRL/ERL to decide whether the market is targeting internals (range) or externals (expansion).
• Use the ✓ sweep mark to identify “liquidity already taken” vs “still resting.”
• Pair it with structure (MSS/BOS), sessions, and displacement to time entries after raids.
________________________________________
Pro tips
• If you want more lines, increase:
o Max visible levels per side
o Max clusters to scan (perf)
• If the chart is too busy, increase:
o Swing length
o Min touches
o Or reduce Max visible levels per side

AR–Volumized Blocks & S&DAR–Volumized Blocks & S&D is a clean, price-action order-block tool that automatically detects Bullish & Bearish Order Blocks (OB), tracks their evolving state into Mitigation Blocks (MB) and Breaker Blocks (BB), and adds a volumetric overlay showing an estimated split between buyers vs sellers inside each zone. It also includes a lightweight Supply & Demand (S&D) module with the same buy/sell visualization.
This indicator is designed to keep the chart readable: zones are drawn with thin boundaries, optional breaker fill, short reference lines, centered labels, and shortened volumetric bars (instead of huge full-width blocks).
________________________________________
What it draws
1) Order Blocks with State Tracking
Each detected Order Block is shown with:
• Top/Bottom boundaries (thin lines)
• A zone container (mostly invisible for OB/MB, semi-filled for BB)
• A label that updates live with:
o Total zone volume
o Volumetric balance %
o Current state: OB / MB / BB
o Optional extra line: Buy vs Sell estimate
States
• OB (Order Block): Newly detected zone, still valid.
• MB (Mitigation Block): Zone has been touched by price (mitigated) but not broken.
• BB (Breaker Block): Zone has been invalidated (broken through) and becomes a breaker.
Optional BB cleanup
• “Hide invalidated BB” can auto-remove breaker blocks that become invalid again (to keep the chart clean and only show active breakers).
________________________________________
2) Supply & Demand Zones
Supply & Demand zones are detected using pivot logic:
• Supply: pivot highs → zone from pivot high down to pivot candle body area
• Demand: pivot lows → zone from pivot low up to pivot candle body area
They are drawn as:
• A zone holder + thin lines
• A label (“Supply” / “Demand”), with optional volumetric text
• Optional buy/sell volumetric bars, same style as OB/BB/MB
S&D zones are removed completely once broken (clean and decisive behavior).
________________________________________
Volumetric Buy/Sell (the mini bars + text)
This script adds an extra layer called Volumetric (Buy/Sell):
-Volumetric Bars (short + clean)
Inside each zone, it can draw two small stacked bars:
• Top half: Buy volume (green)
• Bottom half: Sell volume (red)
You can choose:
• Display side (Left or Right of the zone)
• Bar length in bars (shortened by design)
• Transparency
-Volumetric Text (buyers vs sellers)
The label can optionally show:
• B 123K | S 98K
So you instantly see who dominated in that block.
Important Note (Very Honest)
These buy/sell numbers are NOT real bid/ask delta.
They are an estimate based on candle direction:
• If a candle closes green (close ≥ open) → its volume is counted as “buy”
• If it closes red (close < open) → its volume is counted as “sell”
This is still extremely useful for visual confirmation, but it is not a broker-level footprint.
________________________________________
Detection Logic Summary (simple + effective)
Order Block detection (swing-based)
• Uses a swing finder to identify relevant turning points.
• Confirms OB creation on a breakout beyond the swing level.
• Builds the OB range by walking backward to capture the strongest base candle area.
• Filters out oversized zones using ATR × Max OB height filter.
Zone lifetime handling
• Zones extend forward automatically.
• OB becomes MB on first meaningful touch.
• OB becomes BB if violated in the opposite direction.
• BB can optionally be hidden if it becomes invalid (depending on your settings).
________________________________________
Inputs & Customization
Detection
• Swing length (OB): controls sensitivity. Lower = more zones, higher = fewer stronger zones.
• Use candle body for extremes: reduces wick noise by using candle bodies for boundaries.
• ATR filter: avoids huge messy blocks (keeps zones tradable).
• Max zones to keep: keeps chart lightweight.
Visual
• Bull/Bear colors
• Label size
• Forward extension
• Short line length
• Label offset
Supply & Demand
• Enable/disable S&D
• Pivot swing length
• Forward extension, line length
• Label offset X and Y (ticks)
• Max S&D zones
Volumetric Buy/Sell
• Turn bars on/off
• Turn text on/off
• Bars side (left/right)
• Bar length (short, by bars)
• Bar transparency
________________________________________
How to use (practical workflow)
For Entries
• Use Bullish OB / Demand as a potential buy zone after a displacement up.
• Use Bearish OB / Supply as a potential sell zone after a displacement down.
• Look for confluence:
o market structure shift / BOS + displacement candle + return to OB/MB
For Bias Filtering
• The buy/sell split helps you quickly sanity-check:
o A “bullish OB” that shows heavy sell dominance might be weaker (and vice versa)
o Strong imbalance zones often show a clear dominance split
For Risk Management
• BB zones are great “line in the sand” areas.
• Use zone boundaries for invalidation, with your own model rules.
________________________________________
Performance Notes
This script is built with object limits in mind and includes:
• max_boxes_count, max_lines_count, max_labels_count
• Cleanup logic when max zones are exceeded
• Optional hiding of invalid breakers to reduce clutter
________________________________________
Disclaimer
This tool provides technical visualization and estimated volumetric info based on candle direction. It does not represent true order flow, bid/ask delta, or broker tape. Always risk-manage properly and confirm with your trading plan.
SBT LEVELS with CR Daily time frame levels PDH/ PDL/ PDC. I managed to code day count directly into the indicator complete with a table to show you the trigger day as well as current day. Im measuring higher and lower closes. that being said it is up to the trader to realize when a FRD/FGD is a A+/A++/A+++ setup. BO is the designation to show when breakout traders are triggered into the market. CIB (close in breakout). FB- FALSE BREAK- INSIDE - inside day.

(FVH) Helios Alpha v6.3.2 — Institutional Engine Helios Alpha v6.3.2 is an institutional-grade Smart Money Concepts indicator designed to reveal true market structure, trend direction, and liquidity behavior across all timeframes.
It automatically detects BOS/CHOCH, liquidity sweeps, valid orderblocks, mitigation points, premium/discount zones, and displacement—giving traders a complete structural map without chart clutter.
Version 6.3.2 introduces enhanced orderblock filtering, improved trend-engine accuracy, multi-timeframe confirmation logic, and cleaner structural visualization.
Whether analyzing Forex, Gold (XAUUSD), Indices, or Crypto, Helios Alpha delivers consistent, high-precision trend and structure insights for traders who want reliability and clarity in any market environment.
This tool does not generate signals or promises profits. It is designed to support analysis and improve decision-making through objective structural data.

🟡 GOLD 4H HUD v12 — Time-Safe Nuclear Edition🟡 GOLD 4H HUD v12 — Time-Safe Nuclear Edition
A full–scale Smart Money Concepts (SMC) analytics engine designed exclusively for XAUUSD on the 4-Hour timeframe.
This script combines market structure, liquidity, displacement, order blocks, imbalance, volume profile, SMT divergence, and institutional behavior modeling into a single unified HUD.
Built with a time-safe architecture, all structural elements (OB/FVG/Sweep) are stored by timestamp to minimize repainting and preserve event integrity.
📌 Core Features (12 Modules + Full HUD)
1 — Market Structure Engine
Automatically detects:
HH / HL / LH / LL
BOS (Break of Structure)
MSS (Market Structure Shift)
CHOCH (Change of Character)
Real swing pivots & trend state
2 — Sweep Engine (Liquidity Grab Detection)
Identifies institutional liquidity grabs:
Break + reclaim of highs/lows
ATR-filtered invalidation
Displacement-backed sweeps
3 — Time-Safe FVG Engine
Detects Bullish/Bearish Fair Value Gaps
ATR-tolerant FVG logic
Automatic right-extension
Auto-delete when filled or invalid
4 — Time-Safe Order Block Engine
Demand & Supply OB detection
Strength classification (Weak vs Strong)
FVG-overlap confirmation
Timestamp-locked (non-repainting)
5 — Volume Profile Engine (HVN / LVN / POC)
Real-time micro-profile:
High Volume Node (HVN)
Low Volume Node (LVN)
Point of Control (POC)
6 — SMT Engine (Gold vs DXY Divergence)
Smart Money Divergence built-in:
Bullish SMT
Bearish SMT
Directional confirmation with zero lag
7 — Displacement Engine
Measures institutional impulse:
Body-based impulse detection
Multi-leg continuation signals
FVG continuation moves
Generates displacement score
8 — Premium / Discount Model
Auto-classifies price into:
Discount (Buy zone)
Premium (Sell zone)
9 — SMC Trend Engine (Score-Based)
Combines 10+ factors:
Structure
FVG
OB power
Displacement
POC positioning
SMT conditions
Outputs:
BULL / BEAR / RANGE
Full scoring system
10 — Institutional Imbalance Model (IMB Engine)
Combines:
PD zones
Sweep direction
Displacement
SMT
OB strength
CHOCH/MSS
A complete institutional bias filter.
11 — Entry Engine (Signal Fusion Model)
Entry conditions fuse:
Sweep
CHOCH
Displacement
OB strength
FVG alignment
SMT confirmation
Also outputs:
Suggested SL/TP
Entry score
12 — Trendline Engine
Auto-draws:
HL → HL bullish trendlines
LH → LH bearish trendlines
+ Full Nuclear HUD
Displays:
Market structure
Trend direction
SMT / CHOCH / MSS
FVG / OB zones
HVN / LVN / POC
Liquidity strength
Entry model
Liquidity Magnet direction
SL/TP map
A complete institutional dashboard in one place.
⚠ Usage Requirement
This script is designed ONLY for the 4H timeframe.
✨ Summary
GOLD 4H HUD v12 — Time-Safe Nuclear Edition
is not just an indicator.
It is a full institutional-grade SMC analysis system, built specifically for Gold.
If you trade XAUUSD on the 4H timeframe —
this is your complete market intelligence HUD

Aurora Reversal Suite: Liquidity & Inversion ModelConcept & Methodology The Aurora Reversal Suite is not a general-purpose indicator; it is a hard-coded algorithmic implementation of a specific institutional reversal model often referred to as the "2022 Mentorship Model" or "Sweep-to-Inversion" setup.
While many scripts display Liquidity Sweeps or Fair Value Gaps individually, this script solves the problem of "confluence fatigue" by algorithmically enforcing a strict order of operations. It does not alert on every sweep; it alerts only when a specific sequence of price action events occurs in a verified order.
The Algorithmic Logic (How it Works) The core value of this script lies in its conditional filtering logic, which automates the following manual verification process:
Event A: Liquidity Sweep
The script first monitors key institutional levels: Previous Day High/Low, Session High/Low (Asia/London/NY), and dynamic Swing Points.
It detects a "Sweep" event when price breaches a level but fails to close beyond it (or closes back inside within a defined lookback period).
Event B: Displacement & Inversion
Unlike standard FVG indicators, this script searches specifically for Inversion FVGs (iFVG) that form immediately following the sweep event.
The script logic requires that the iFVG be created by the displacement leg that reverses the sweep. This binds the "Entry Signal" directly to the "Liquidity Event."
Event C: Algorithmic Filtering (The "Strict" Mode)
To filter out false positives common in choppy markets, the script applies a multi-layer filter before printing a signal:
Volume Qualification: The signal bar's volume must exceed a user-defined multiple of the N-period average volume (default 1.5x) to confirm institutional participation.
SMT Divergence Filter: The script cross-references a correlated asset (e.g., NQ vs. ES or EU vs. DXY). If enabled, a signal is only valid if the correlated asset failed to make a matching high/low at the moment of the sweep (SMT Divergence).
Bias Alignment: The script calculates directional bias using a waterfall logic (Daily > 4H > 1H). Signals counter to this calculated bias are suppressed in "Strict" mode.
Included Features & Components
Automated Market Structure: Real-time labeling of BOS (Break of Structure) and MSS (Market Structure Shift) based on swing point logic.
Session Killzones: Visual boxes for Asia, London, and NY sessions with auto-extending high/low lines to track session liquidity.
Multi-Timeframe Dashboard: A calculated table displaying the trend state of the Daily, 4H, and 1H timeframes to assist with top-down analysis.
Power of 3 (PO3) Overlay: Visualization of higher-timeframe candle geometry on lower-timeframe charts to identify accumulation/distribution phases.
Why This Mashup is Necessary Attempting to trade this specific reversal model using separate indicators results in chart clutter and conflicting signals. By combining the Sweep detection, iFVG creation, and SMT filtering into a single codebase, we can programmatically eliminate "naked" sweeps that have no displacement, providing a cleaner and more objective view of the market structure.
Settings & Customization
Signal Mode: Choose between "Simple" (Price Action only) or "Strict" (Trend + Volume filtered).
SMT Input: Manually define the correlated asset ticker for divergence checks.
Visuals: Fully customizable colors for Bullish/Bearish scenarios to fit light or dark themes.
Disclaimer This script is a tool for market analysis and does not guarantee future results. It is intended to assist traders in identifying high-probability setups based on historical price action concepts.

ICT Base Candle with Volume Filter📘 ICT BASE CANDLE WITH VOLUME FILTER
Institutional Base Candle Detection System
Smart Money Concepts (SMC/ICT)
🔍 What This Indicator Does
ICT Base Candle with Volume Filter automatically detects institutional Base Candles—also known as pause candles, decision candles, compression candles, or repricing pauses.
These candles often appear at key algorithmic points:
After a displacement
After a liquidity sweep
Before a fair value gap reaction
Inside an Order Block (OB)
At premium/discount zones
Before large expansions
This tool highlights these candles using:
✔ Body-percentage filtering
✔ Optional volume-based filtering
✔ Bullish/Bearish color coding
✔ Optional labels (+ / –)
✔ Accurate fixed historical plotting
✔ Customizable settings
This makes it extremely useful for SMC, ICT, and algorithmic orderflow traders.
🎯 Why Base Candles Matter (SMC/ICT Context)
The market moves in an algorithmic sequence:
Liquidity Sweep (grab stops above/below)
Displacement (strong impulse candle)
Base Candle (pause candle before continuation)
Expansion / Reversal
Base candles indicate:
Loss of momentum
Repricing
Order absorption (buy/sell programs)
Potential mitigation zones
Possible entry (continuation)
Possible reversal (if sweep + base + displacement)
They act as footprints of algorithmic activity, confirming where smart money is momentarily active.
🎨 Indicator Features
✔ Customizable Base Candle Colors
Choose unique colors for bullish and bearish base candles.
Option to use the same color for both.
✔ Volume Filter
Enable/disable volume filtering
Adjust lookback and threshold values.
✔ Label Toggles
Display “+” above bullish base candles
Display “–” below bearish base candles
✔ Fixed Historical Markers
All detected base candles remain consistent as bars update.
✔ Tooltip-Enhanced Inputs
Includes advanced trading notes inside input tooltips.
📈 How to Use (Practical Guide)
1️⃣ Identify the Impulse
Look for strong displacement or impulsive candles.
2️⃣ Locate the Base Candle
A small-body candle directly following a displacement.
3️⃣ Validate With Volume (Optional)
Low volume confirms a pause in the algorithm's movement.
4️⃣ Use It With SMC Tools
Base candles work best when aligned with:
FVGs
Order Blocks
BOS / CHoCH
Liquidity sweeps
Premium/discount equilibrium
5️⃣ Entry Model (Example)
Continuation Model:
Displacement
Base Candle forms (small body)
Enter on break of base candle
SL beyond candle wick
TP at liquidity / FVG end
📌 Example Explanation
A bullish impulse appears → price pauses → forms a bullish base candle → FVG below → price mitigates → resumes trend.
This indicator marks the base candle and helps you visualize where the algorithm slowed down before continuing the move.
🚫 Limitations & Notes
This is not a buy/sell signal indicator
It highlights context, not trades
Must be combined with structure & liquidity analysis
Volume filter is optional and should be tested per asset
🔒 Invite-Only Access (If Applicable)
If published as Invite-Only, include this:
Access is manually approved
Redistribution is not allowed
Do not share access publicly
Contact the author to request access
Unauthorized reselling is strictly prohibited
🏁 Final Notes
This indicator is designed for traders who understand:
Smart Money Concepts
Institutional orderflow
Liquidity models
Algorithmic ranges
Candle behavior within displacement
Use it as part of a full trading framework—not as a standalone signal.
📜 Credits
Created by: Manish Kumar Gupta / ask2maniish
Inspired by ICT / SMC price delivery concepts
