ATR Volume DivergenceThe indicator measures ATR relative to VOLUME of each candle, marks the candles where there is more volume than in the previous one, but a lower ATR - signifying a compression in price movement - resistance. It also marks the candle where there is a greater ATR than in the previous candle, but lower volume - signifying an expansion in price movement - vacuum.
P.S. Bring indicator to FRONT to see the colored candles clearly
"ATR" için komut dosyalarını ara

ATR with Impulse AlertsThis is a very simple script which simply plots an ATR (the built-in ATR function, using RMA) and plots a cross when the previously closed bar is larger than the ATR by a given threshold. There are also alert conditions set so you can be alerted when these impulse bars show up, either up or down bars. Have fun and safe trading!

ATR Vol Proxy CrossThis script is a simple ATR cross, where the short-term ATR helps quickly and easily determine whether volatility is "high" or "low" compared to the long-term ATR value. Both values are adjustable, but initially calibrated for the daily chart.

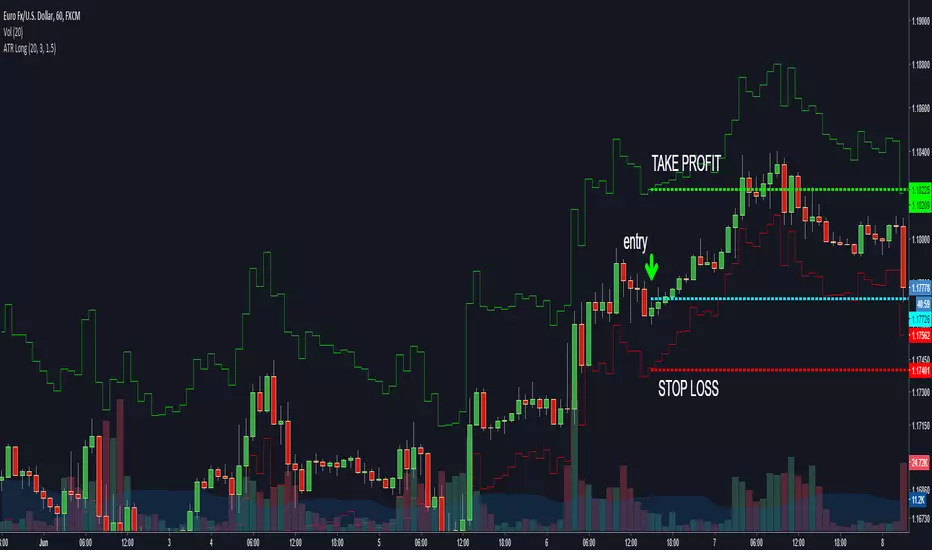
ATR based Stop and Take-Profit levels in realtime Little tool to quickly identify stops and take-profit levels based on Average True Range. User can change ATR multipiers, as well as the ATR length used. Green and red lines show these levels; plot is visible over last 8 bars only to reduce clutter. Label showing the current ATR, up above the last bar

ATR ChannelsAn Exponential Moving Average (EMA) with three sets of channel lines each one Average True Range (ATR) apart, above and below the EMA. Fully customizable, you can toggle the EMA and ATR set visibility, line colors, etc.
Inspired by Elder's 'The New Trading For a Living' , page 93: "Kerry Lovvorn likes to plot 3 sets of lines around a moving average: at one, two, and three ATRs above and below an EMA. These can be used for setting up entry points and stops, as well as profit targets."

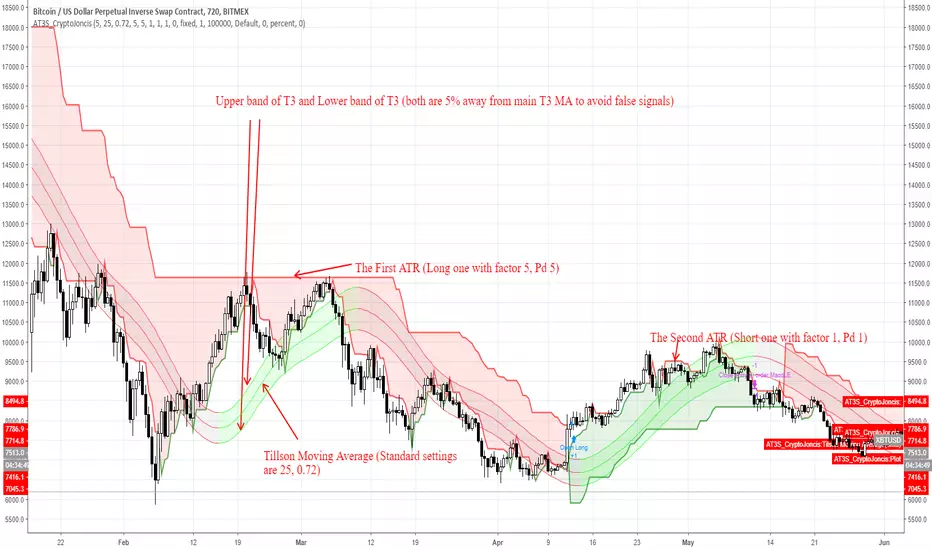
ATR and T3 strategyT3 Moving Average indicator was originally developed by Tim Tillson in 1998/99.
T3 Moving Average is considered as improved and better to traditional moving averages as it is smoother and performs better in trending market conditions.
It offers multiple opportunities when the price is in the state of retracement and therefore allows to minimize your exposed risk and allowing your profits run.
This strategy is for trend followers who are patient enough to have 6-10 trades per year.
What's included in strategy?
Two ATR (Code was taken from J.Dow and modified)
Tillson Moving average
Enter long signal:
When both ATR (Long and Short) are in uptrend and the bar closes above Upper Tillson's moving average band: Enter Long
Exit Long signal:
When hl2 is lower than Lower Tillson Moving Average band
Enter short signal:
When both ATR (Long and Short) are in downtrend and the bar closes below Lower Tillson's moving average band: Enter Short
Exit Shortsignal:
When hl2 is higher than Upper Tillson's Moving Average band
Best to use with Bitcoin on 12H TF
Can be used for different time frames as well but the settings must be adjusted accordingly
Remember, overtrading can be harmful to your trading account.
If this is helpful for you, consider a tip
BTC: 3FiBnveHo3YW6DSiPEmoCFCyCnsrWS3JBR
ETH: 0xac290B4A721f5ef75b0971F1102e01E1942A4578
Created by CryptoJoncis
ATR Short [zauoyds]This script was made to calculate in real time the stop and take profit based on ATR to SHORT positions. By default, the number is 1,5 ATR to stop-loss and 3 ATR to take profit. You can change according to your trading system.

ATR Long [zauoyds]This script was made to calculate in real time the stop and take profit based on ATR to LONG positions. By default, the number is 1,5 ATR to stop-loss and 3 ATR to take profit. You can change according to your trading system.
ATR+ (Stop Loss Indicator)This script is designed to aid in back-testing and trade execution.
It displays three sets of values - the teal colored value is the current ATR, the green colored value is your stop loss distance (in pips) below the most recent swing low for long trades , and the red colored value is your stop loss distance (in pips) above the most recent swing high for short trades .
You can change the stop loss settings to base your stop loss on a set pip amount or by however many multiples of the current ATR as you wish (eg. 1.5x ATR).
Feel free to ask any questions or edit the script without permission :)
- Matt.

ATR and Volume AnalysisHi!
I would like to present an indicator that's meant to measure ratio of Volatility to Volume.
Basically it measures 2 moving averages (14 and 100 period) of ATR and Volume and then compares them. The output is ATR14 / Vol14
Color scheme
Red: Volume and ATR is both below 14 period
Green: Both are above
Yellow: Volume up, volatility down
Purple: Volume down, volatility up
Then there are two lines - 1 and 1.5
That is, in my opinion, the most optimal state to trade, because 1 means that there is some volatility and it's confirmed by volume. Above 1,5 you could see it as overbought (or oversold) zone. If it's above this line, we could expect a retracement since the volatility is not backed by volume. Above 2 it's quite critical and I would suggest closing trades.
(You can use it across all timeframes. In fact it's better if you do so. Longer timeframes are good for spotting tradeable markets while shorter timeframes show overbought / oversold zones)
I have also added option to choose between 4 different moving averages, but in my opinion RMA works the best.
Feel free to share some feedback, I would really appreciate it.
Sincerely,
Beefmaster
ATR Percentage ValuesThis indicator is created to give you the daily ATR 2% and 10% values for any product that you are looking at. The way the indicator is designed is to only show the most recent 2 and 10 percent values on any chart and will not show you any other number. If you are hovering over price that occurred in the past it will show zeros on the values. To get the right values, take your mouse off of the chart and it will show you the values.
The way this indicator is coded will give you the daily ATR numbers no matter what chart timeframe you are currently looking at. The idea is to save time and make sure you do not make a mistake getting the wrong value.
*** To make this show up on the status line, click on the settings, click on the style box and check the box "VALUES IN STATUS LINE" ****

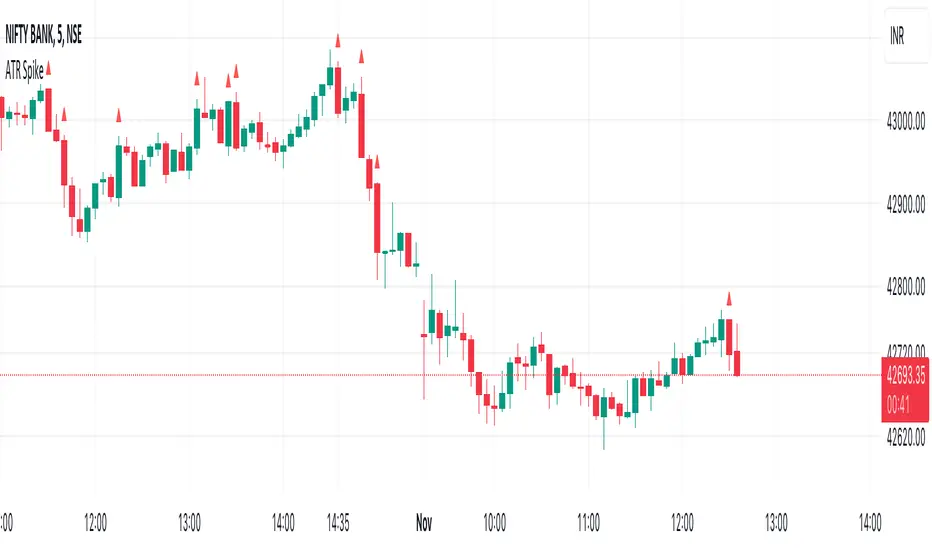
ATR SpikeALWAYS TRADE THE DIRECTION OF THE TREND
This indicator is useful for 5-minute Bank Nifty intraday trading.
It compares the Open-Close value for a 5-minute bar with the current ATR value.
When a bar has higher than the ATR value then it means that the current bar has a higher Open-Close than the ATR.
This means that after a period of dull action, some action has taken place.
And more action will follow in the direction of the immediate trend.
It signals the start of momentum which I look for as a intraday trader.
Feel free to experiment and change values as it suits you.
I use it on Bank Nifty only on 5 minute timeframe with 14 period ATR.
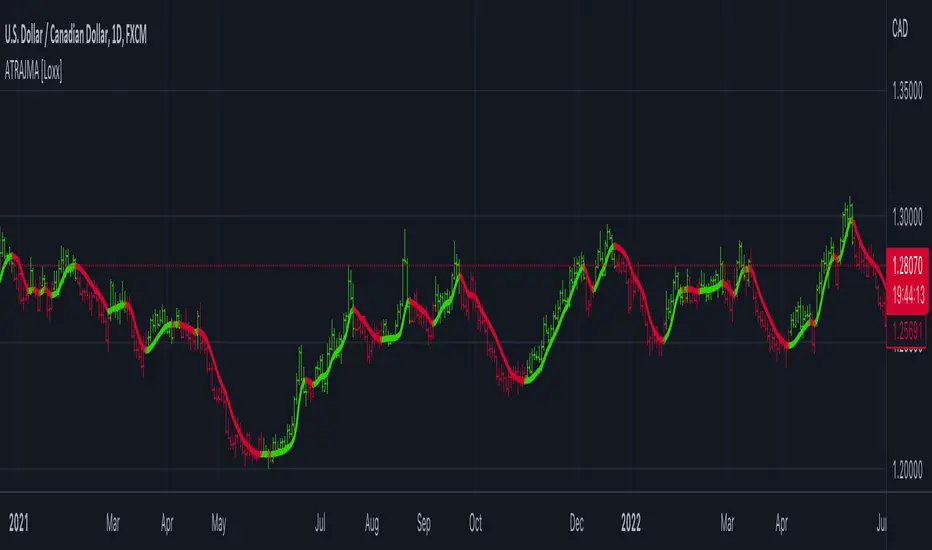
ATR-Adaptive JMA [Loxx]Not many know that the JMA (Jurik Moving Average) is already an adaptive indicator (it is adapting using the usual market volatility monitoring mode). Hence, making it adaptive "once more" makes it double adaptive. Fro the adaptivity in this case, we are use ATR (Average True Range) to make the JMA double adaptive. The ATR period is the same as the JMA period (there is no separate setting for that) so the usage of the indicator is as simple as it gets.
What is Jurik Volty used in the Juirk Filter?
One of the lesser known qualities of Juirk smoothing is that the Jurik smoothing process is adaptive. "Jurik Volty" (a sort of market volatility ) is what makes Jurik smoothing adaptive. The Jurik Volty calculation can be used as both a standalone indicator and to smooth other indicators that you wish to make adaptive.
What is the Jurik Moving Average?
Have you noticed how moving averages add some lag (delay) to your signals? ... especially when price gaps up or down in a big move, and you are waiting for your moving average to catch up? Wait no more! JMA eliminates this problem forever and gives you the best of both worlds: low lag and smooth lines.
Included:
Bar coloring
ATR MultiplierOVERVIEW
The Average True Range Multiplier (ATRX) is a simple technical indicator that takes the value of the ATR indicator and multiplies it by a user-specified amount.
CONCEPTS
This indicator is primarily used to set key levels based on historical volatility. The ATR indicator alone measures the historical volatility of the selected instrument, this indicator just multiplies that value to save the hassle of doing that yourself.

[DT] ATR Trigger Bar OverlayATR Trigger candle is an idea that I originally heard about studying alexander elder's work at spike trade. This code is my interpretation of his work.
The idea behind an ATR trigger bar is to find areas where price is likely trapping market participants. In some cases a trigger will not form in one bar so a two bar analysis is also included in study.
Bull trap condition:
- price moves above previous bar high and in the same candle will close below previous bar close
Bear trap condition:
- price moves below previous bar low and in the same candle will close above previous bar close
TODO:
- categorize trigger bar as 1 bar or 2 bar price action
- allow user to filter 1 bar or 2 bar price action
- multiple timeframes
- volume filter
- horizontal line for average price on a trigger bar

ATR stoploss bands ATR止损通道线计算方式为开盘价,方便一开始就知道这根k线的止损位置。
用21和1.618作为参数,在btc上经常能看见刚好差一点打破到这个止损,不知是否是我的错觉。
使用方法:
出现信号后,将止损设置在当前k线止损点处,也可以用前一根的止损点,或前几根k线之内的最高价K线的ATR来止损。

ATR Stop Loss FinderThis Indicator uses Average True Range (ATR) to determine a safe place to put stop losses to avoid being stop hunted or stopped out of a trade due to a tight stop loss. Default multiplier setting is 1.5. For a more conservative stop loss use 2 and for a tighter stop loss use 1. ATR and stop loss prices are displayed in table at bottom of screen. Use high(red) for shorts and low(teal) for longs.

ATR with EOM and VORTEXThis is a strategy, designed for long trends for stock and crypto market.
Its made of ATR for volatility, EOM for volume and VORTEX for the trend direction.
In this case on the ATR, I applied an EMA to check if current position is above the EMA -> bull trend, below ema -> bear trend
For EOM I am using the positive and negative value scale, if its positive we are in a bull movement, otherwise a bear movement.
Lastly for VORTEX, I took the min and max, and made an average, after that I am using the average and compare it with 1 value. Above 1 -> bull, belowe 1-> bear.
This strategy only goes long.
If you have any questions, let me know.

ATR Without OutliersIt is an ATR indicator which filters out outliers.
Outliers are values which are higher than the standard deviation of the true range.
It may be better than normal ATR for stop loss, because it does not keep large values after pump or dump.
It is very useful for high volatile markets like crypto markets.

ATR Volatility Bars 1.0This script will be featured in upcoming video ideas about catching liquidations spikes in cryptocurrencies.
The script measures the unique size of each bar compared to the Average True Range (ATR) of the evaluation period. The evaluation period can be set in the inputs. The desired benchmark for what will be highlighted is also set in the inputs as a percentage. The default settings are to evaluate the last 26 bars for ATR and highlight bars that are 300% or larger than ATR.
When a bar meets the criteria of the indicator it will show a label and highlight the bar accordingly. The user may select the indicator to only show Buy or Sell opportunities. The indicator has alert functionality.

[CP]ATR Triple Stop Loss LevelsATR based Triple Stop Loss levels that are plotted on the chart (like moving averages!).
With ATR Levels plotted on the price chart itself, you can better set your volatility based trailing Stop Loss.
Also helps to define the SL when making an entry into a stock.
Note:
This indicator is supposed to be used on Daily and Weekly Charts.
For other timeframes you would need to tweek the default parameters.

ATR Percent of PriceShows:
1. The current True Range, taken as ATR(1) as % of the close price
2. The SMA(14) of the current True Range, taken as ATR(1) as % of the close price
