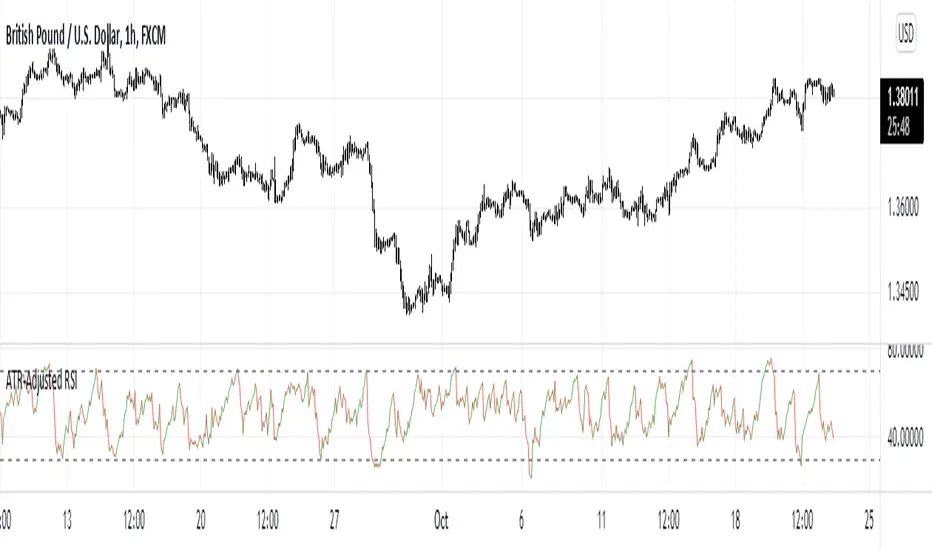
ATR-Adjusted RSIThis indicator adjusts the RSI values using the Average True Range. It is used the same way as a normal RSI.
"ATR" için komut dosyalarını ara
ATR-%RThis indicator uses a combines the "Williams %R" and "ATR_Normalized" indicators to find potential price tops and bottoms, as suggested by simultaneous extreme values on both of the aforementioned indicators.

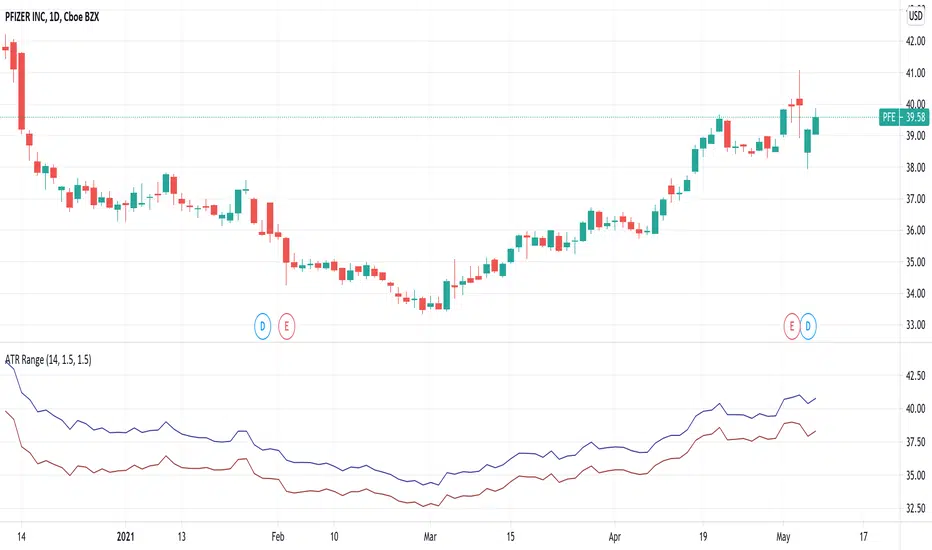
ATR RangeUseful in case you use Average True Range to determine Shows Stop Loss and Take Profit price levels.
For example, if you want to put Stop Loss with a distance of 1.5xATR and Take Profit 2xATR for a long trade, put 1.5 as Lower Factor and 2 as Upper Factor. Lower and Upper prices will show price levels for SL and TP respectively.
ATR Volatility Stop by CanUk101Attempts to put a line on the chart that can trigger a stop alert. Based on ATR volatility.
A work in progress, feel free to help improve it.

ATR PercentAverage True Range in Percent to price
- 2 customizable horizontal line: to be used as custom levels.
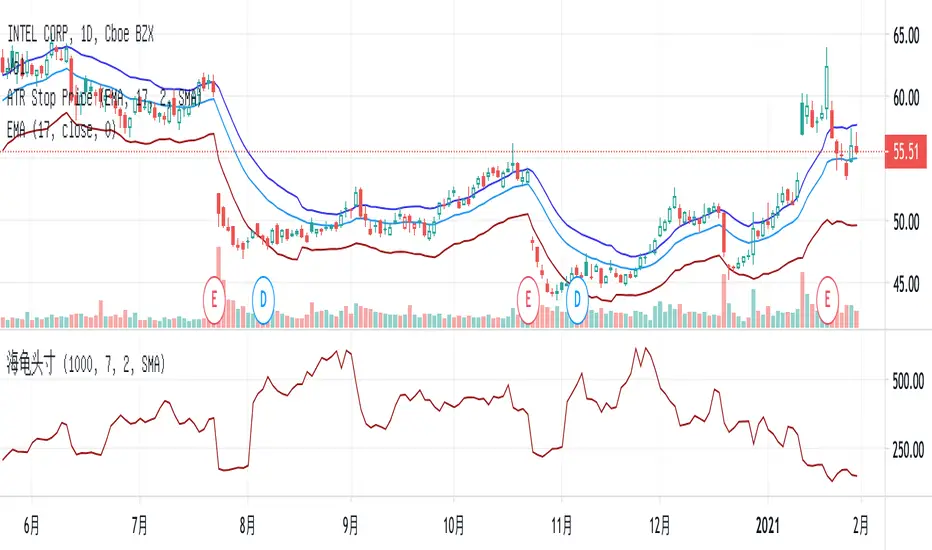
ATR Stop PriceSet stop price and add-position price according to the cost and current ATR.
You may set an alert with the condition when the stock price crossing down the Stop Price.
Example:
stock price: $150
volatility multiple: 2
current ATR: $3
stop price = $150 - $3 * 2 = $144
add-position price = $150 + $3 * 2 / 2 = $153
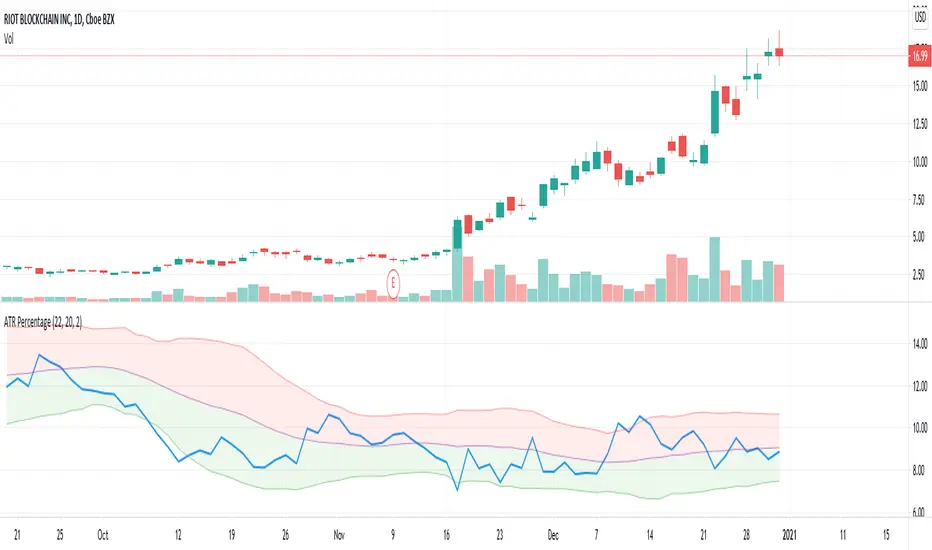
ATR PercentageThis indicator plots ATR as percentage of close price. Also applying bollinger bands on it to visualize it is relatively high or low.
ATR-Based Moving Average EnvelopesSimple MA envelopes, but the distance which the MA is projected is dependent on ATR. User chooses MA length, ATR length. Additionally, there is a multiplier which can be used to project the bands additional X amount of ATR.

ATR COG (Joy Bangla)Notes:
Black crosses indicate squeeze. It means an impending move once squeeze is released
Price tends to go from red dot to green dot to red dot to green dot to red dot in an endless cycle. We wait for the price bar to not touch the dots before we make a move
If the price goes between the dots and the lines, it means it is likely overheated/oversold respectively
If the price moves above the top line, it means the market is super overbought
If the price moves below the bottom line, it means the market is super oversold
This is an updated version 4 script from Lazy Bear's code as found from here
The update is there to ensure we can have alerts successfully set on Trading View

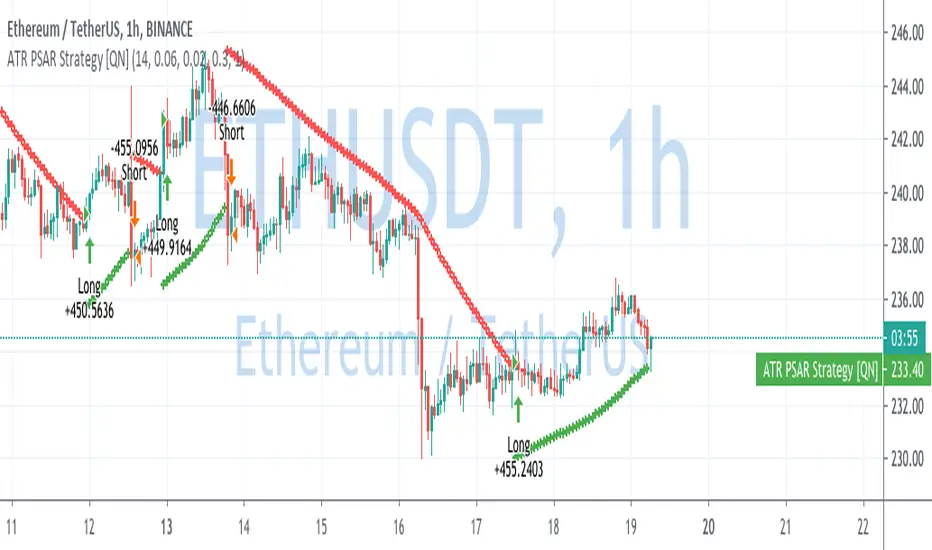
ATR Parabolic SAR Strategy [QuantNomad]I created a version of Parabolic SAR when I accelerate it not based on the difference from the extreme point but based on current ATR. So the idea is that for a more volatile market it should move faster.
Performance is calculated based on 25% equity invested and 0.1% commission.
What do you think about it? Does it make sense to do something like that?
Do you have in mind other ways I can accelerate it when the market starts to be more volatile?
Disclaimer
Please remember that past performance may not be indicative of future results.
Due to various factors, including changing market conditions, the strategy may no longer perform as good as in historical backtesting.
This post and the script don’t provide any financial advice.
ATR Levels////Strategy is designed to show strong candlesticks ( Buyers & Sellers) when the close breaks ATR(2). Short term trading Strategy.

ATR/StdDev SL/TP LabelThis is a handy little info box containing the Stop-Loss/Take-Profit values
for a LONG/SHORT position based on either the ATR or the Standard Deviation
multiplied by a configurable constant.


ATR Timeframe RangeThis indicator shows the ATR range on the daily or any other timeframe on your current chart. All settings are fully customize-able.

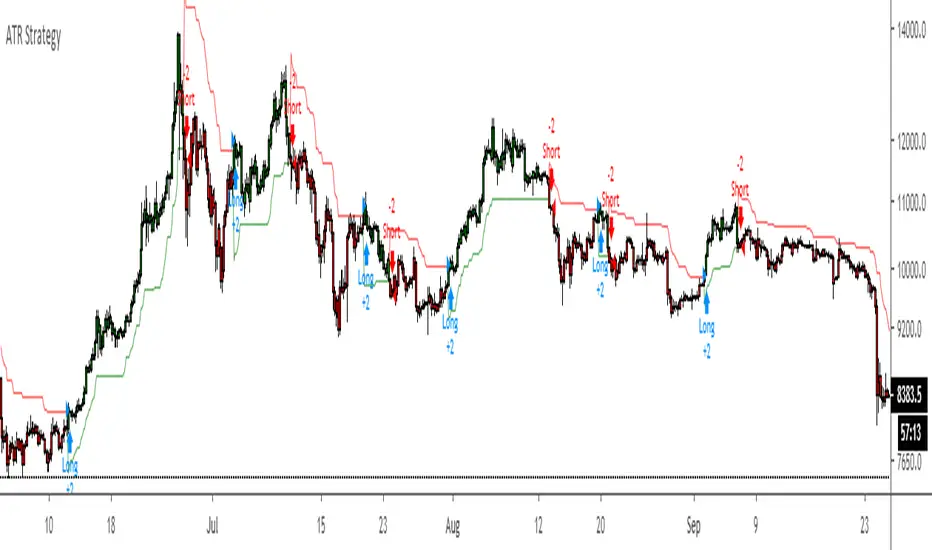
ATR Strategy Back test Original script by HPotter
ATR strategy is profitable.
Buy when it says buy and sell when it says sell.
ATR, Kijun-Sen, %R Strategy [No Nonsense FX]A strategy that employs the No Nonsense FX method as described by VP.
1. Risk: ATR
2. Baseline: Kijun-Sen
3. Confirmation #1: Williams % Range
4. Volume: TBD
5. Confirmation #2: TBD
6. Exit: TBD
Give me a follow if you enjoy and please PM me for more info/collabs!
Notes:
The defaults seem to work on all pairs
Please check the "two digit" box if running on JPY or Metals
If you have any ideas for a volume indicator, confirmation, and/or exit leave a comment!

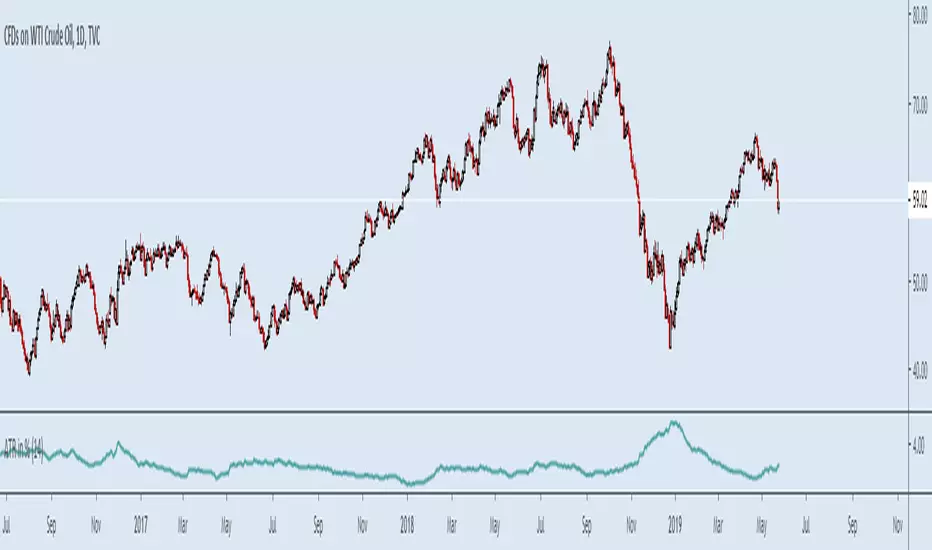
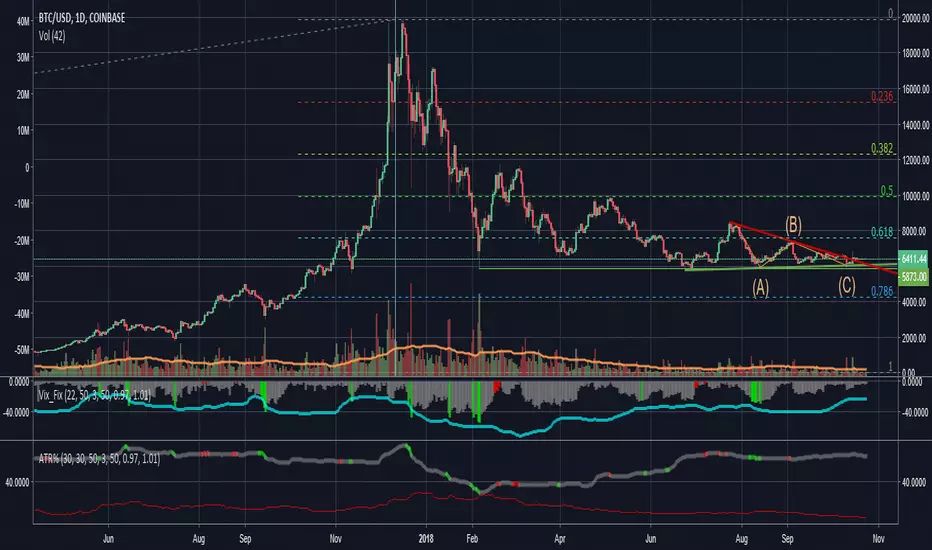
ATR in %Muh indicator :)
Simple but so useful little script. I work in percents because this is what makes sense not "pips" and "ticks" my account grows or diminishes a certain percentage I risk "1%" for example not ticks, ticks is what bad dogs have.
Was tired of calculating manually every time.
Makes it easier to set stop losses, get an idea of what to expect, risk in a kind of worse case scneario, backtest strategies, compare charts etc quickly. More quick now.
Example.
Bitcoin and NatGas, you do NOT need leverage...
optionsellers.com that somehow got surprised by Natgas volatility and squeezed, I think he did not bother doing this...
Happens all the time on NatGas, that "short seller catastrophy" that made the headlines was not even that big of a spike...
Plenty of way worse ones not long ago
ATR Z ScoreThis script normalizes ATR to a Z Score, or a number of standard deviations it is from its long term average, positive or negative.

ATR * 1.5 FX Stop LossPlots two lines to help with back testing strategies assuming a Stop less set at ATR*1.5

ATR TrueThis is True Average True Range, ((Hi-Low)/Lenght), Lenght (1,2 and more), no EMA, SMA etc.
Only based on Hi/Low Lenght.
Why Is all ATR bulish there is not correctly?

ATR Ranging market backgroundJust publishing a separate indicator from my ATR & RSI indicator if ever you liked to analyze and use them separate. Have a nice day

ATR and VIX For Profit Target and RSI LimitThe red line, based on ATR, should be used as a percentage gain goal. So I will set my profit targets based on this percentage.
The grey line is based on William's VIX and I use it to judge what RSI I should sell at.
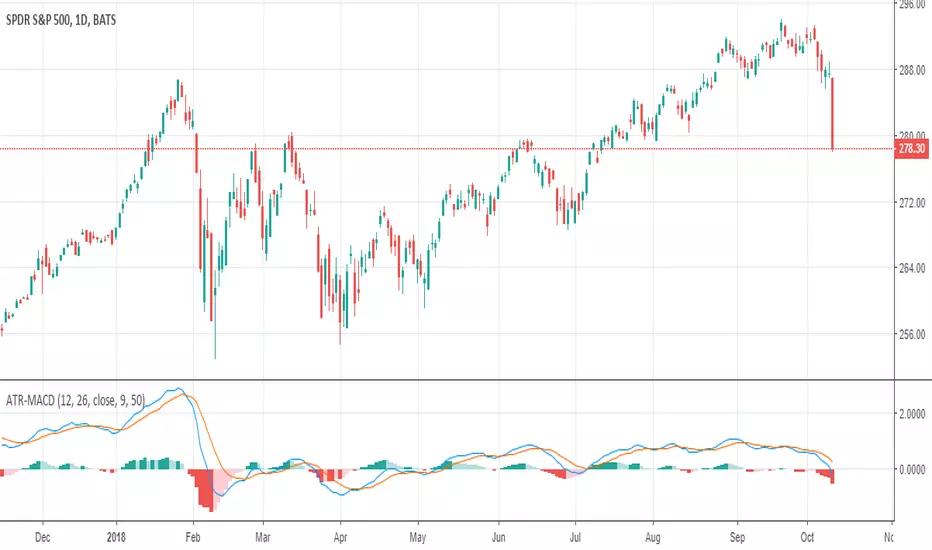
ATR adjusted MACDWhen running MACD, it can be useful to compare the value of the MA difference to other values. In other words, is a particular stock or futures contract at a more extreme MACD value than another. This can be done by dividing by the price, however, that doesn't adjust for volatility differences. Using ATR, one can adjust for price and volatility at the same time, allowing comparisons between securities more easily.