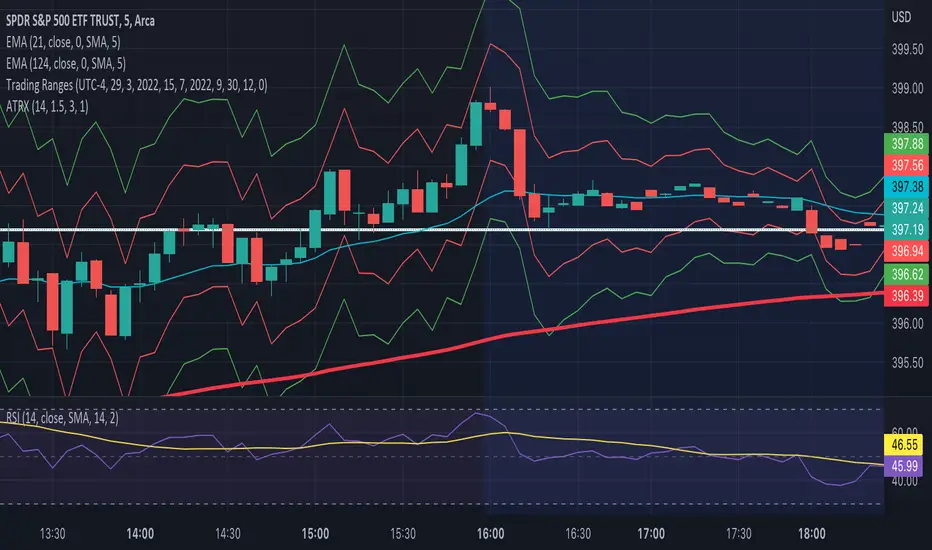
ATR Trailing Stop Loss [V5]A complete ATR Trailing Stop Loss in version 5.
Features Include:
Timeframe Option
Long/Short Triggers (Green/Red Triangles)
Long/Short Conditions (Bottom Colored Line)
"Golden" Long/Short Triggers (Yellow Triangles)(Hanging Man or Shooting Star Candlestick patterns breaking ATR trailing stop)
Alerts
"ATR" için komut dosyalarını ara

ATR Multiplier OverlayFunctions like ATR Multiplier by bjr117, but is overlaid on chart to make your setting of stop-loss and take profit levels easier.
Simply set the multiplier, script will take the ATR for that time with whatever setting, multiply it with your input and plot that number plus and minus each candle close.
ATR GainThis indicator shows the amount, in terms of a percentage, that the ATR is currently above or below the current ATR average.
This can be translated to the amount of volatility in the market compared to the current "standard" volatility.
See also "Average True Range" technical indicator

+ ATR Support and ResistanceThis, a very different script from most of mine, is my attempt at making a useful, and not messy, support and resistance indicator. If you've never looked into trader xkavalis, and his scripts and discord, I would highly recommend it. He talks about "pay attention candles" a lot. It got me thinking about what those are. Best as I can tell all he means by that phrase is large, impulsive candles. Sometimes these lead to break outs of ranges, or they may signal tops, bottoms, or near-tops and bottoms. The only way I could make sense of this in a mathematical way was by using the average true range. Basically, any candle's true range outside of the ATR is considered a "pay attention candle," by my definition.
This script originally began as just a candle coloring exercise with some optional shapes plotted above/below certain candles, but I quickly realized I wanted to draw lines or zones from these candles, so eventually, after many hours spent figuring out and learning 'line.new' and 'box.new' I got things sorted.
Essentially, my line of thinking is that on impulsive candles down, the origin of the impulse is more important than the close (not always of course, as there are no unbreakable rules in what markets can do), and with impulsive candles up, the same theory applies.
So, for upward impulsive candles I've marked out the zone from the open to the low as a support (until broken, in which case it may become resistance). For downward impulsive candles the zone encompasses the open to the high. I've given the option to plot a line from the close for all of these. It's turned off by default as it's just less stuff on the chart, but you may like it.
The line length is customizable in a menu. It does funny things on low timeframes on forex and stock charts (long lines that result in chart compression), but for some reason very rarely on crypto charts. If someone who is smart (not me) and has much experience with pinescript could perhaps help me out with a fix for this, that would be great. I suspect it has something to do with my "bar_index_duration" that I defined using the time function, but I'm not sure how or why.
Line length on time frames of one hour and up it is typically fine.
Use the ATR multiple to change the sensitivity of the indicator. This is basically the determination of when a candle is beyond the ATR. A multiple of two is two times the ATR. With lower volatile pairs you can maybe make this lower. On lower time frames or with more volatile pairs (illiquid alts in particular) a higher multiple might serve better. I find the default 1.75 is mostly acceptable.
As I started this I also thought adding some sort of volume information to the candles might be useful as well, so I added a simple candle coloring feature referencing the OBV and a 21 period EMA. Candles are colored based on the OBV's relation to its moving average.
I added some plot shapes and candle coloring utilizing the RSI as well. Options to turn on or off shapes plotted for overbought and oversold across the top of the chart. The most interesting feature that I implemented here is a support/resistance zone around the centerline of the RSI. If the RSI is between 49 and 51 then you can have optional candle coloring, shapes plotted above the candles, and s/r zones drawn on the chart. In trending markets the centerline of the RSI will frequetly act as support or resistance, so by being alerted of this condition on the chart you can use that with actual levels marked off in order to help make a judgement on a trade. I think it's a nice addition, and an oft overlooked aspect of the usefulness of the RSI.
I've also included a calculation, with candle coloring and/or plot shapes, for something like a stop run on high volume. The calculation for that is in its section below, and should be pretty self explanatory.
Lastly, typing this as I'm posting it, this indicator could also be useful for helping to find placement for trailing a stop. Just a thought!

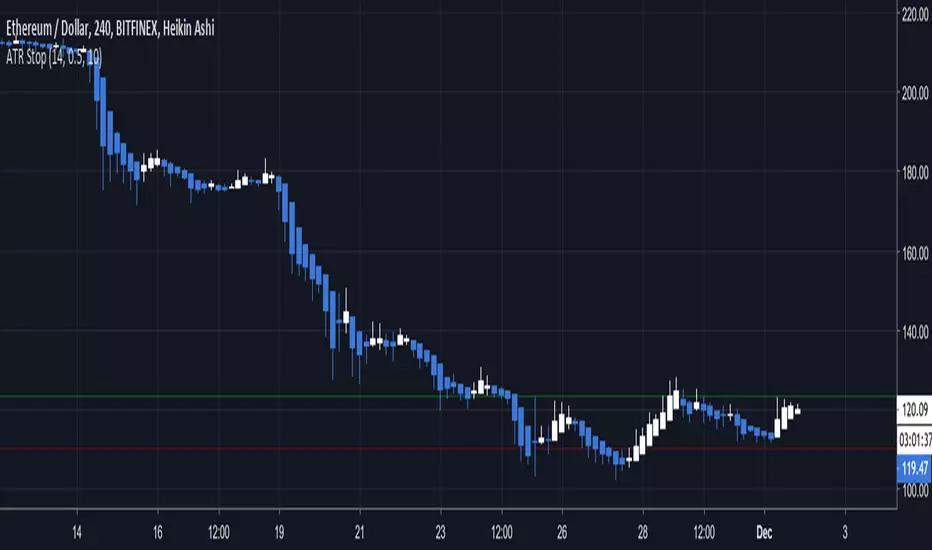
ATR Stop BandView ATR Stop in a different timeframe, the default timeframe is 1D, the default ATR multiplier is 60%.
upperStop = current high + dayATR * 60%;
lowerStop = current low - dayATR * 60%;

ATR-DAY TRADER AHINSTEAD OF HAVING AN EXTRA TAB AT BOTTOM OF THE CHART THIS ATR DOES THE SAME WORK WITHOUT GIVING ANY ADDITIONAL TABS. IT JUST GIVES A VALUE AT THE LEFT HAND SIDE TOP, WHERE WE SEE ALL OUR INDICATOR SETTINGS DISPLAYED. AS ATR IS USED MAJORLY FOR SETTING UP PROPER STOPLOSS THE ONLY THING I PERSONALY NEED IN HANDY IS THE VALUE AT THE SIDE.
HOPE THAT THIS HELPS FOR MANY PEOPLE AROUND THERE WHO DO NOT WISH TO MAKE THE SCREEN COMPACT AND LOOK LOST WHILE TRADING BY ADDING TO MANY INDICATORS.
THANKS & REGARDS -
DAY TRADER AH
@HUZAIFA_786

ATR with Take and StopThis simple indicator will plot the take profit and stop loss values based on the ATR indicator.
It's possible to set how many times the ATR value will be applied to the closing price and
what trade type is used, Long or Short.

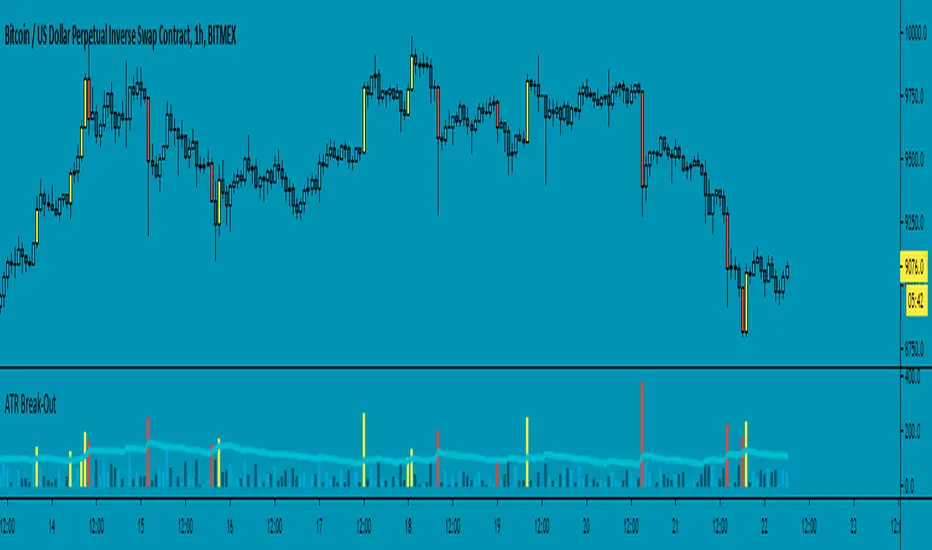
ATR Break-Out - evoThis script measures candle length and average true range (ATR). A break out occurs when a candle is larger than the given ATR value. You can choose to calculate length from wicks or from the body (open & close).
You can use this as trend direction indicator by following the last break out candle or open a position after a break out with a stop just above or below the candle. Enjoy!

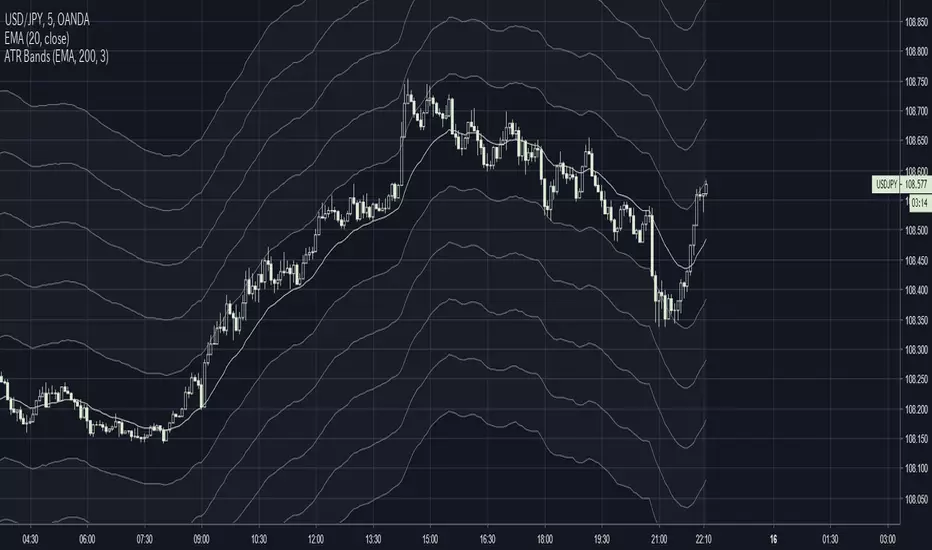
Scott’s ATR volatility histogram with smoothingATR shows volatility. The sma of the ATR (default=14 period) shows the average volatility over the look-back period, (default=200 period.)
When volatility is higher than average, the histogram turns green. When volatility is less than average, the histogram turns red. This shows volatility expansion and contraction. Volatility expansion is a good confirmation for entering a trade position. Volatility contraction is a sign that a trend is not developing.
Now I have added an sma which acts as a smoothing of expanding or contracting volatility. When the histogram is higher than this smoothing (default=21) then volatility expansion momentum is creasing. WWhen the histogram is lower than the smoothing sma, volatility contraction momentum is increasing.
I introduce an idea that volatility momentum can be used as a substitute for volatility expansion and contraction.
Now we have volatility expansion momentum and volatility contraction momentum.

ATR stop and threshold valueOne can use the average true range for both entries and stops. A possible way to reduce false breakouts is to enter (say) at 0.5 * atr above the breakout level. Then you could use a 1.0*atr for a stop setting. This indicator allows you to set entries and stops for both long and short setups directly on the chart. I use it with breakout systems as it allows me to easily setup my trades.

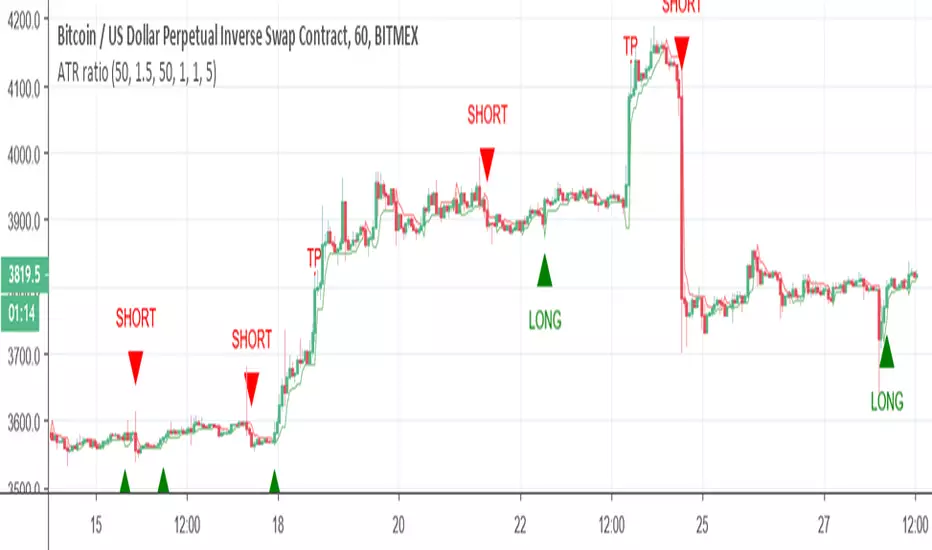
ATR ratioThis model is based on ATR ratio between the high and the low.
I add to Super trend that can act as filter or act by its own (setting is 1 and 1 but try to change it to find better outcome)
add take profit on 5%
Similar to price channel model and don ratio model I use the difference between the high and the low to create the signal
The aim of the super trend is to try to filter sideway signal . You can replace it with another method if you think its better in order to remove stupid signals when market go sideway
or add what ever you want
the ATR signal controlled by lookback (now on 50)
alerts is inside
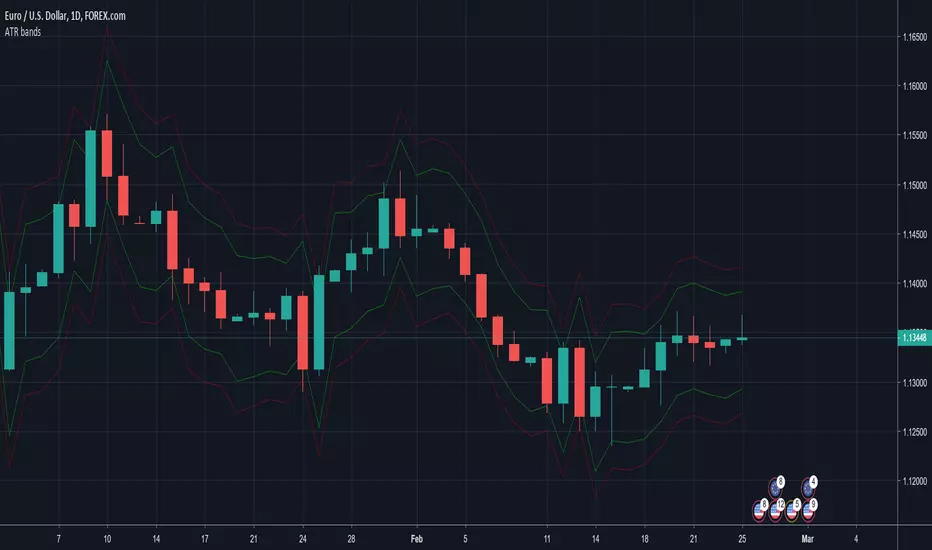
ATR BandsEach line is drawn at intervals based on the value ATR * Coefficient.
Params
Source: Specifies a center line. Default value is close.
Period: ATR Period.
Coefficient: Adjusts the bandwidth.
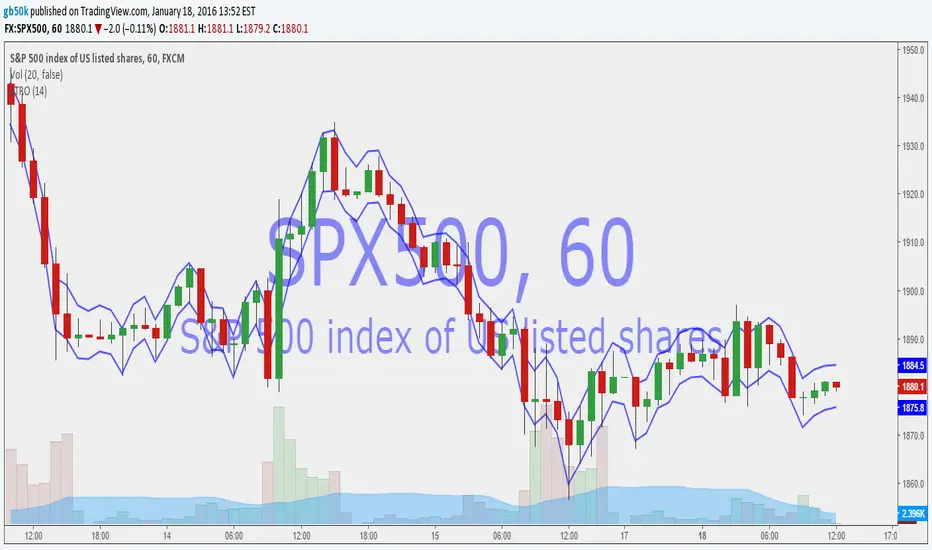
ATR Stop Loss VisualizerThis will help you figure out what stop loss settings work best for you. Some people might prefer ATR 14 * 0.5 for shorter timeframes, some might prefer more extreme settings such as ATR 30 * 2 to not get stopped out as often.

Average True Range Overlay - BandPlots a band of width 1 ATR around the midpoint (HL2)
Settings:
- Length of ATR
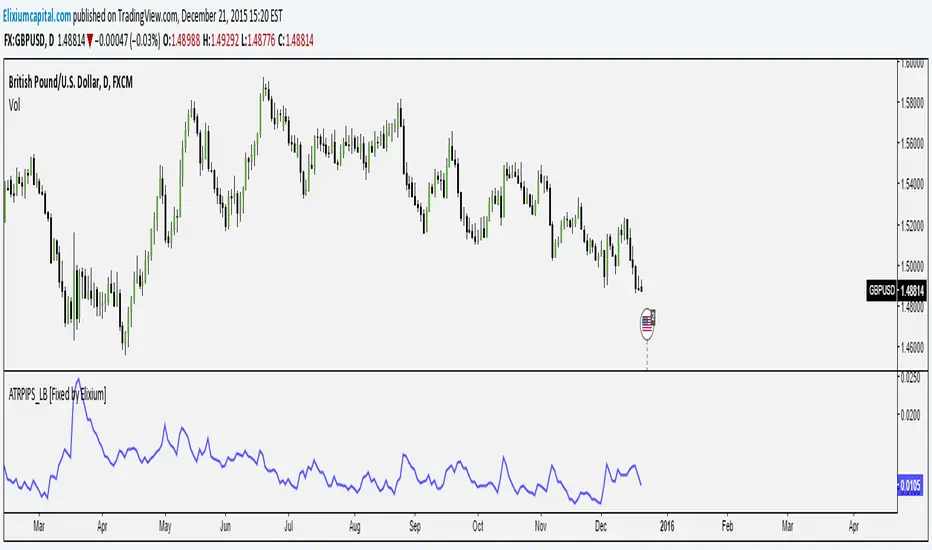
ATR Pips [LazyBear] [Fixed by Elixium]This is ATR in pips. This was requested by user @ElixiumCapital on Twitter. ATRPIPs in his words:
How to use: Change the chart to the Daily time frame. The indicators value e.g. 0.0105 means that the average daily range of the past 5 trading days is 105 pips. (On standard pairs like EURUSD, GBPUSD)
"ATR PIPs is useful for finding markets with your desired amount of volatility, for example I prefer to trade forex pairs with the highest amount of volatility in the past 5 days, setting the length parameter to 5 days. And setting my stop loss at 25% to 33% of the the indicators value."
Fixed: Default parameters and a critical bug.
ATR Table (Top Right) - Multi Rangejust your friendly atr table to multiple ranges and for the sense of what is brewing

ATR Volatility Impulse Candles (Bull & Bear)This indicator highlights unusually strong momentum candles using ATR as a volatility filter. Treyding Stocks was the inspiration behind this powerful swing indicator!
A candle is marked only when its body is larger than the Average True Range, meaning price moved farther than normal for that timeframe. This filters out noise and focuses attention on candles that often matter most.
Lime green candles represent strong bullish impulse. They occur when price closes above the open and the candle body is larger than ATR. These candles often show aggressive buying, late-stage momentum, or exhaustion before a reversal.
Blue candles represent strong bearish impulse. They occur when price closes below the open and the candle body is larger than ATR. These candles often signal aggressive selling, liquidation, stop runs, or breakdown confirmation.
The indicator includes alerts for both bullish and bearish impulse candles, allowing traders to monitor multiple charts without watching them constantly.
Traders commonly use this tool to identify momentum exhaustion, reversal zones, and high-impact candles near VWAP, key moving averages, or important price levels. It works on any timeframe, does not repaint, and is designed to keep the chart clean while highlighting only the most meaningful price moves.
The Red (Blue) candle is very useful for swings especially on the Daily chart
*When the Blue (RED) candle appears, mark the high/low, and enter when the next candle breaks /closes above it.

ATR High and Low Offset from PriceAverage True Range based on last X time periods. Learned this from the master Trader Dante, but wanted to code my own ATR indicator for practice and I noticed his keeps moving throughout the day on BTC, so testing my own.

ATR Daily & Weekly With Stop Buffer this script shows Daily & Weekly ATR and also add 10% Stop buffer calculation so you can add stop loss.

ATR + True RangeOne indicator for ATR & TR its a common indictor which can be used as one
instead of 2 different its is trial mode only not to be used with out other references
