Hull MA +- ATR by shoxi Added HMA-ATR and HMA+ATR to make easier taking profits and placing stop losses in intraday trading.
"ATR" için komut dosyalarını ara

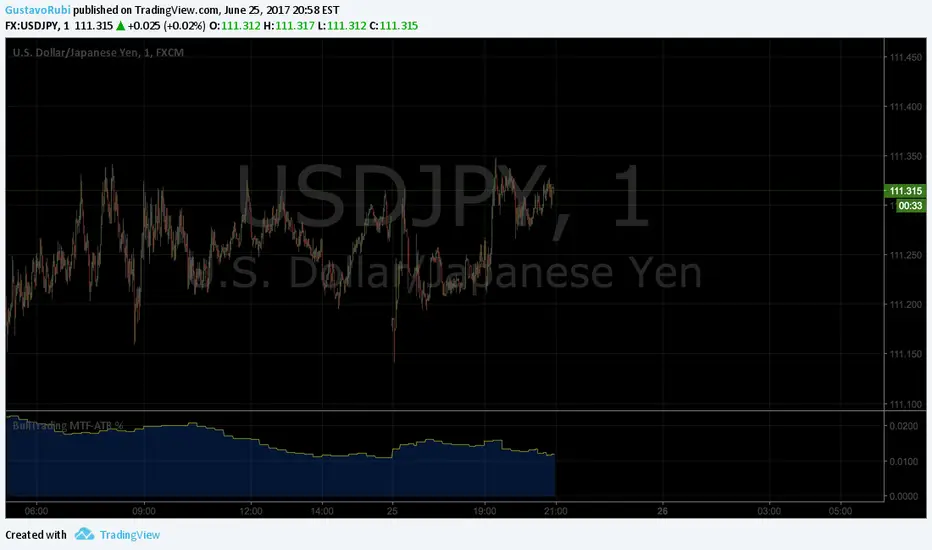
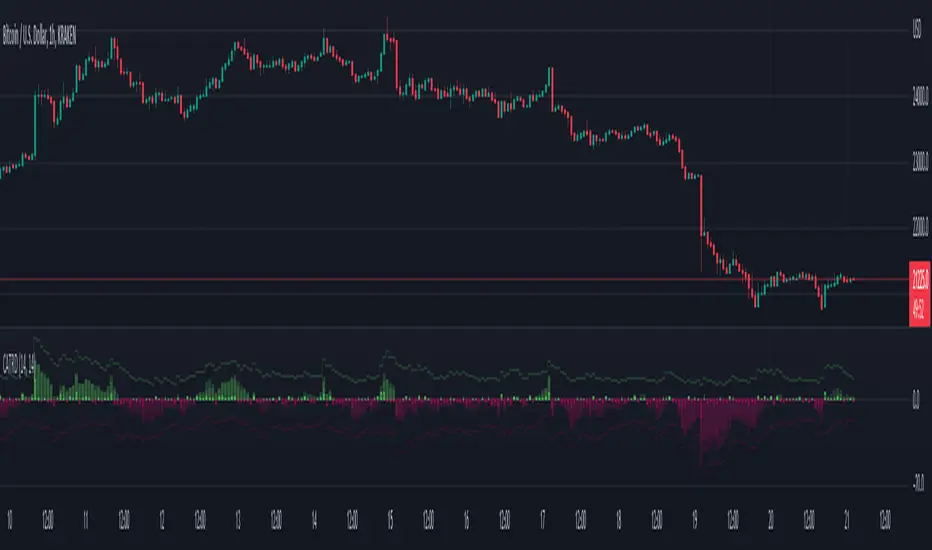
BullTrading MultiTimeFrame ATR %Good afternoon traders.
Have you ever got trapped on the middle of a consolidation? Well, it just happened to me trading the 1 minute chart last friday!
So, I coded this script to display a percentage of ATR for a given resolution.
Now, how can you benefit using this information?
For example:
Using the standard settings (resolution is calibrated 15 minutes in order to trade 1minute charts), just draw your prefered support and resistance. Then measure the number of pips between support and resistance. This number should be approximately the same the indicator is displaying. If the indicator is displaying a lower value, maybe it will be a good idea to tighten your support/resistance levels (if the price goes against you, you will have confidence and probability on your side to open an opposite position and reach your Take profit before a new reversal take place.
Change colors and resolution for your desired timeframe until you find your particular "sweet spot"
Have a nice trading week.
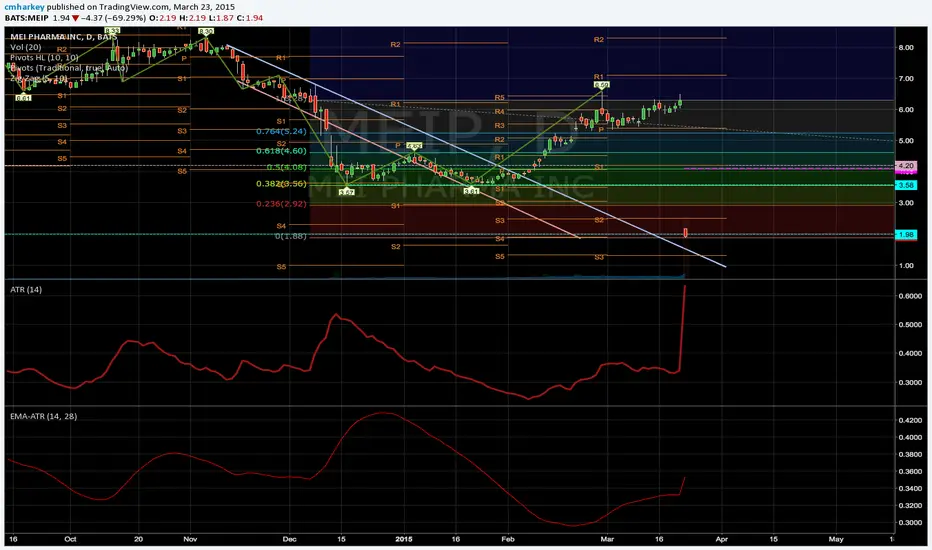
Moving Average of Average True Range - EMA ATRSo I came across the need of wanting to smooth out the ATR of something that has some violent swings in it in order to better place some stops.
Simply put the output of the ATR into the EMA function.
Everything is labeled easily in the settings window you you can clearly change period length for each function.
ATR + BJ Signal V3ATR + BJ Signal (Optimized for GOLD)
This indicator is designed for mean-reversion scalping on GOLD, focusing on volatility expansion and momentum exhaustion.
Key features:
ATR-based candle expansion filter to detect abnormal moves
RSI overbought / oversold confirmation
Optional Bollinger Band deviation filter
Clear BUY / SELL signals for reversal entries
Automatic SL / TP projection lines and price labels (individually toggleable)
Best suited for short-term reversal and scalp trades during high-volatility conditions.
All visual components can be enabled or disabled independently. be enabled or disabled independently.

ATR + EMA + Sessions ProATR + EMA + Sessions Pro By Saeed Fadi to save indicator space, it,s for atr, emas, sessions etc.

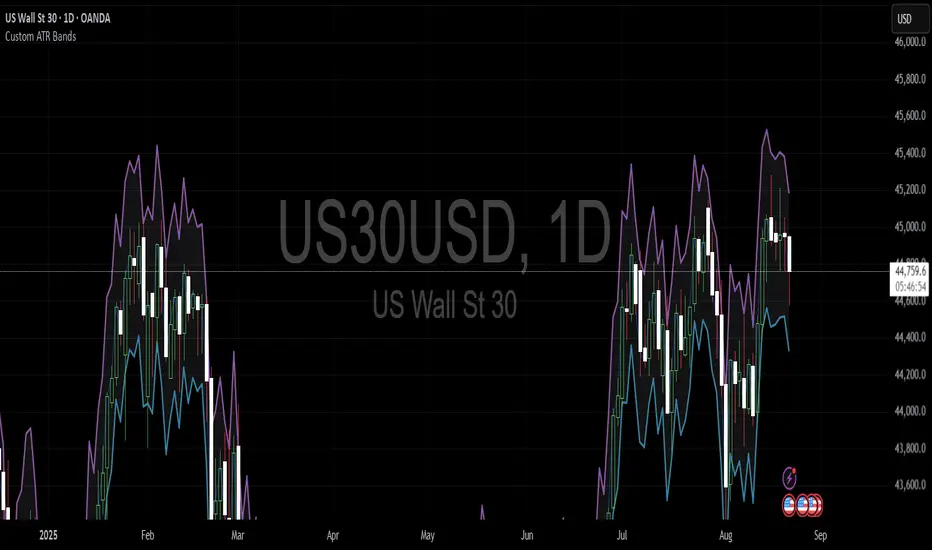
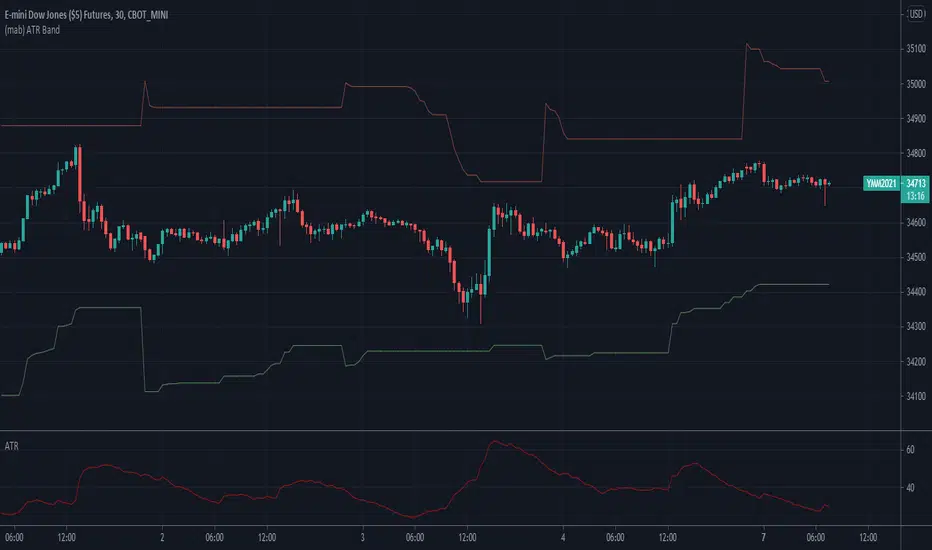
Custom ATR BandsThis indicator provides a customisable, easy to view band around the price, based on the ATR. The ATR length and multiplier can be adjusted.

DTR/ATR Scanner v1.0This indicator allows you to view DTR vs. ATR % for multiple instruments. When colors are Red the instrument is near 90% of its daily ATR.

Cumulative ATR Distance Oscillator// A Price/ATR oscillator with cumulative waves.
// Based on Cumulative Volume Delta, but using price movement alone.
// Public Domain
// By Jolly Wizard
ER-Adaptive ATR [Loxx]Average True Range (ATR) is widely used indicator in many occasions for technical analysis. It is calculated as the RMA of true range. This version adds a "twist": it uses Perry Kaufman's Efficiency Ratio to calculate adaptive true range
You can use this indicator the same way you'd use the standard ATR.

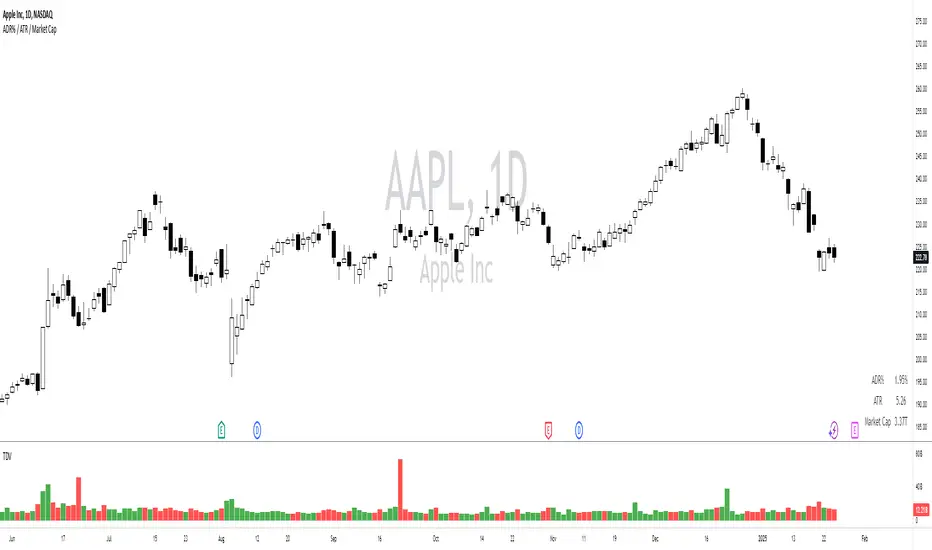
ADR% / ATR / Market CapDisplays the following values in a table in the upper right corner of the chart:
ADR%: Average daily range (in percent).
ATR: Average true range (hidden by default).
Market Cap: Total value of all a company's shares of stock.
All values are calculated based on daily bars, no matter what time frame you are currently viewing. Doesn't work for time frames >1D, which is why the table is not shown on weekly/monthly charts.
Credit to MikeC / TheScrutiniser and GlinckEastwoot for ADR% formula, and ArmerSchlucker for the original script which includes LoD Dist . instead of Market Cap.
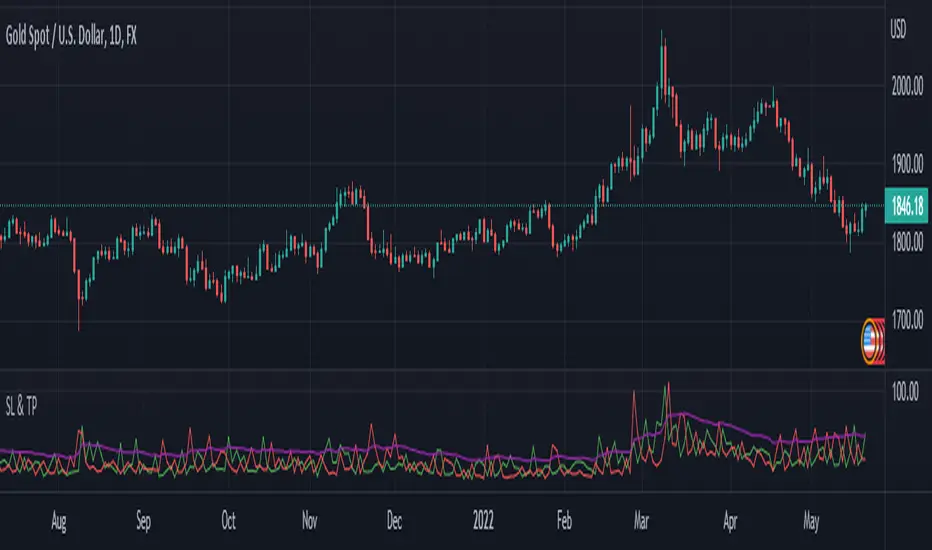
SL and TP - ATRThis indicator is using ATR ( Average True Range ) to set the Target point and Stop loss.
Use the pink number as target, always.
If you are in Long position, use the green number as stop loss, so the red number is not useful in Buys.
If you are in Short position, use the Red number as stop loss, so the green number is not useful in Sells.
** Need to enter the numbers in ticks --> VERY IMPORTANT: Write it completely, even the numbers after the point sign but DO NOT WRITE the point sign itself. e.g. : if the target tick on indicator is 123.75, you have to write 12375 ticks for your TP. ( one more example: If the number is 0.0001203 , write 1203 ticks. )
Enter the information of the opening candle.
Most of the times, risk/reward ratio is a bit higher than 1.
Works on multi timeframes. P.S: Haven't checked the weekly timeframe.
Not trying to oversell the indicator, but this is perhaps the best TP/SL specifier.
For beauty purposes, change (Sl @ buy) and (TP @ sell) to histograms.
Histograms are only for visual purposes. Customize the indicator as you want :)) Hope you enjoy
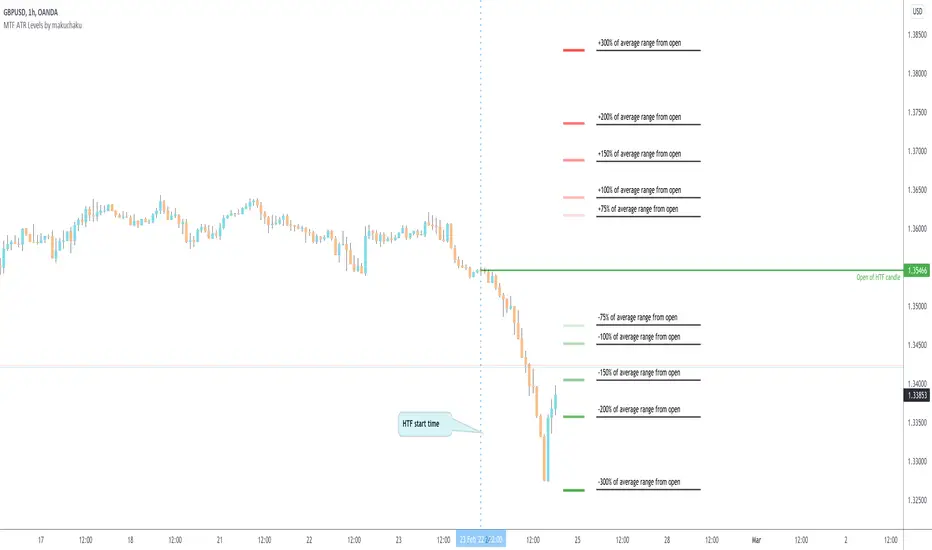
MTF ATR Levels by makuchakuKnowing how big a range one is operating in (from a higher time frame perspective) is very important to understand where the reversals could potentially come from.
This indicator uses the closing price of previous HTF candle and plots its ATR range - and several levels on top of it.
+/- 75%
+/- 100%
+/- 150%
+/- 200%
+/- 300%
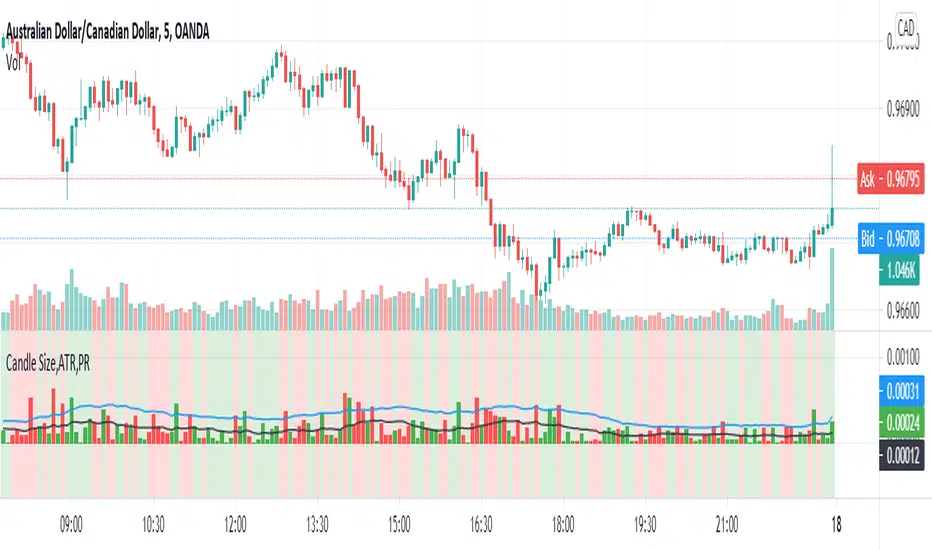
Percent ATRThe script changes the default output of ATR and shows the result based on the percentage. It could be usefull when do you want to know about the percentage of the movement.

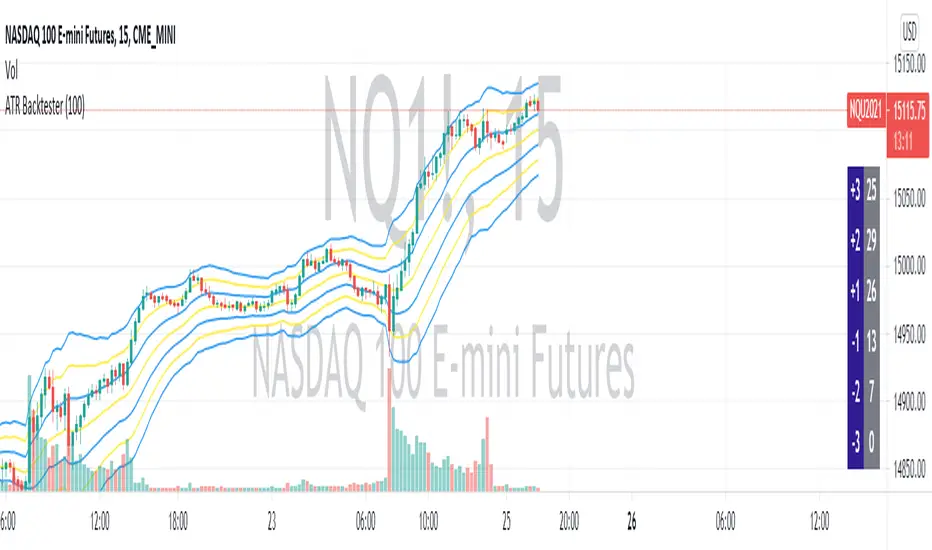
ATR BacktesterATR backtester... input the desired number of bars backwards (I'd recommend 100 or so), and then it'll spit out in the columns on the right side of the screen how many times each ATR was hit. Helps to tell at a glance where bullish and bearish is for the stock. May not be insanely useful since you can just look at the chart, but feel free to use the code yourself for something.
ADR% / ATR / LoD dist. TableDisplays the following values in a table in the upper right corner of the chart:
ADR%: Average daily range (in percent).
ATR: Average true range (hidden by default).
LoD dist.: Distance of current price to low of the day as a percentage of ATR.
All values are calculated based on daily bars, no matter what time frame you are currently viewing. Doesn't work for time frames >1D, which is why the table is not shown on weekly/monthly charts.
Credit to MikeC / TheScrutiniser and GlinckEastwoot for ADR% formula

Position Sizing w/ ADR&ATR TrackingScript to use for position sizing based on portfolio size, max position, and max loss inputs. The option to use custom entry and stop are available, but default to last price for entry, and Low of Day (LoD) for stop. The ATR % is a measure of the low of day to current price as a percentage move.
Credit to LonesomeTheBlue for the base code on position sizing and TheScrutiniser/GlinckEastwoot for ADR formula
-Nelgoth, best of luck

3 SuperTrends + ATR SL + 3 EMAsHere I have assembled 3 indicators, SuperTrend + ATR + Ema, to make them fit into one indicator to make things more organized and to save space. Check Script for original Authors of the used scripts. The UI or the indicator is far from perfect as my programming skills are very low :D

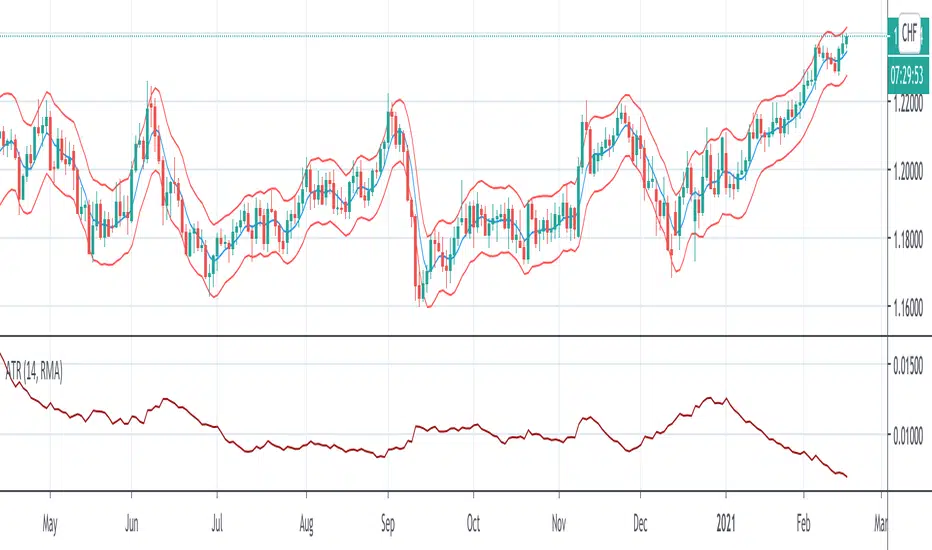
Arnaud Legoux Moving Average With ATR BandsArnaud Legoux Moving Average With ATR Bands to get an idea of the volatility.
Indicator - ATR Profit Loss - DGHi Traders,
This is an on chart indicator that can be used for setting take profit and stop losses very easily using the Average True Range Indicator (ATR). Using a volatility adjusted TP and SL will allow you to set your targets and losses based on market conditions. In the settings, you are able to adjust how much of a multiplier you require depending on your risk tolerance and strategy. For those that follow the NNFX method, the defult settings are preset to 1xATR TP and 1.5xATR SL.
How to use:
- For longs, 'isLong' box must be ticked, for shorts, this box is unticked
- For longs, green line is TP, red line is SL
- For shorts, red line is TP, green line is SL
Regards,
Dillon Grech
