Weighted Relative Strength IndexWRSI uses 3 different user defined time frames with user defined weight on each time frame to give a final RSI value
Default values:
RSI 1 = 5 minute timeframe with a weightage of 9:14
RSI 2 = 15 minute timeframe with a weightage of 4:14
RSI 1 = 60 minute timeframe with a weightage of 1:14
Works best on a 15 min chart.
Please note this indicator will show exactly same values on all time frame charts so if you are looking at a daily chart you may want to change to 60 min, Daily & Weekly RSI time frame in settings.
The weights used here are basically sqaures of 1,2,& 3, you may choose any numbers that work for you.
The RSI length taken here is 27 (count of nakshatras)
The RSI MA length taken here is 28 (count of nakshatras + Abhijit Nakshatra)
You can obviously change it to what works best for you.
Komut dosyalarını "28年大学生毕业人数" için ara

CoinFlip Indicator + StrategyFlip a coin every Monday.
Heads, go long. Tail, go short. Stoploss at 1 ATR, and Take profit at 1 ATR too. 1:1 risk to reward ratio.
After backtesting 2018, 2019, and 2020 with 28 major currency pairs. We are getting close to a 50% win rate with an 8% standard deviation.
Believe it or not, this simple performs better than lots of the popular indicators out there.
Don't believe me? Test it out yourself!!
Use this as a baseline for your backtest and expose all your other crappy indicators :)
HOW TO USE:
As an indicator:
1. Use a daily chart
2. Green arrow below chart, go long, set a stop-loss at 1 x ATR, and take profit at 1 x ATR
3. Red arrow above chart, go short, set a stop-loss at 1 x ATR, and take profit at 1 x ATR
As an indicator:
1. In setting, set a year to test (default to 2020)
2. Go to the strategy tester and observe the stats
P.s. You can also set the period of the ATR to another value other than 14 periods.


SRJ RSI Outperformer StrategyFor Daily timeframe use 100, 40, 21, 200 in input settings.
For 15 Minute time frame use 14, 28, 21, 100 in input settings

Imbalance Identifier With Target BoxTarget Area to help me with my target area for visual reference
Imbalance Identifier - Helps me to see where the trade may come back to
EMA on 1 Minute Time frame for helping to identify Direction to take trades in
I primarily use this as a tool to help me identify very short term direction for scalping small target area (Adjustable)
Preset for the main 28 Forex Pairs, US30,US100,US500 Dax40 and Gold on the 1 Minute timeframe

Multi Day vWAP (Customizable) with AverageIntroducing the Multi-Day vWAP indicator that is fully customizable with average indicator option.
High level overview (default settings):
Default is 10 plots with each setting 1 day apart (1-10 day look back)
Labels for each plot are turned on by default (labels will default to your value, more below)
Use Style tab in options to change colors, plot style, and turn on/off individual plots
Average is turned off by default (style panel will show it's on-- go to Inputs panel and select "Show vWAP Average" to turn on)
Best use case is go to Visibility Panel in options and turn off for Days, Weeks, and Months
To turn off all labels at once go to Style tab and unselect "Labels" checkbox
If you want plots to be as small as possible in Inputs panel set the Plot Width to 0 (zero)
Detail Overview
This indicator will plot your custom daily vWAP values.
You can change the lookback period. If you change the lookback period the label will match your custom value.
For instance, if you change vWAP 1 value to "5", the label for this plot will be 5.
Average Notes:
The average will average all the vWAP values by the divisor. The default is to average all values by 10.
The average will always start to plot from the shortest lookback period. It is not possible to have the average plot before that point.
Trading Tips (default settings)
The simple way to use the vWAP is to treat them as magnets.
For intance,
Generally if price is trading below all the vWAP plots the chart is in a momentum short enviroment. All vWAP areas can be used for upside resistance/reaction areas.
If price is trading above the chart is in a momentum long enviroment and pullbacks can to vWAP levels can be looked as areas of support/reaction.
For instance:
Price is above the current day vWAP and looking to test the previous day vWAP value.
As it approaches the 2 value you are expecting this area to be a reaction area (good trade entry area) for a continuation short trade. Possibly to check back into the current day vWAP value.
I should share that this is a simple way to trade with the vWAP (true success with vWAP is understanding that price trades in vWAP channels).
Stacking and Strong Momentum
The other pattern you should look for is stacking.
For instance on this CL chart:
This chart is strong momentum long.
All 10 day vWAP plots are stacked on top of each other.
Previous action tested below all vWAPs. Price traded thru and came back and retested. Finally closing above all and above the vWAP avearge (red).
When the day vWAP was broke the next target you look for is the 2 vWAP. This reaction area held up and momentum long continued and continuing to trade above current day vWAP.
7 Day Rolling Example (Larger Timeframe)
Another great way to use this indicator is to customize the values for rolling 7 days (5 days for cash markets).
To do this set values to: 7, 14, 21, 28, 35, 42, 49, 56, 63, 70
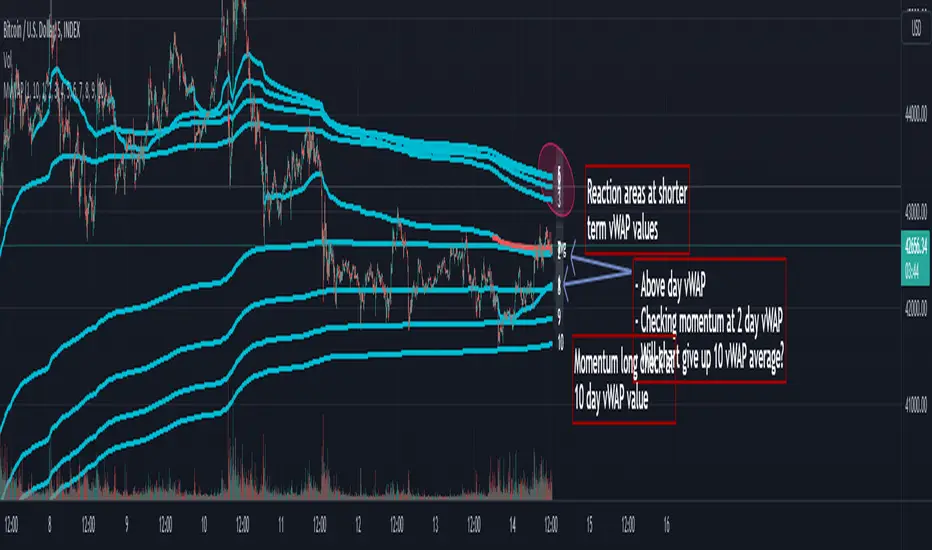
For instance, this BTC chart:
This chart provides a good example of what you'll find when a chart is at a pivot point.
Price is checking in at the average to remain momentum long.
Upside longer term vWAP plots have been tested and had expected reaction.
Price is trading above the shorter term values.
Simple TA here will note if chart continues to trade above and takes out upper vWAPs long momentum is gaining ground.
On the downside if price trades thru the lower vWAP plots you would expect further downside. In this scenario you would be mindful to expect upside tests before (which could be good entry/reaction areas).
NQ example with 7 day values:
Overall chart is momentum short.
7 is above 14, 21
Maybe early sign of bottom.
If price takes out these values and holds above the buyers have quite a few challenges above.
CHOPORSI
CHOPORSI is a multiindicator.
This indicator help You to recognize potential in or out singal.
Base singals are from Choppines, RSI, AND DMI indicators.
It is a combination of 3 separate indicators like choppines RSI and DMI.
Then our new indicator see like bellow on next image.
Yellow line is sum of CHOP index and RSI , in this case we can say its a CHOPORSI Index.
Green line is DMI- line , this show us strength of sell position on the market.
We schould use other signals, like LSMA 50/100 to improve trend changing. Like on next picture.
Now how this indicator works?
Yellow line is the sum oF Chop and RSI value - 50.
Max and minimum value of CHOP and RSI are the same from 0 to 100.
We have sum of them.
Our minimum signal is 0+0-50=-50
maximum signal is 100+100-50= 150
Most times if both of tem are on top level ( then we have 150) the trend is chanhing from bullish to bearish.
The same way if the RSI ist on 0 and chop is over 50 ( then we have index 0 ) wee changing the tren from bearish to bullish.
Off course it not every time. We see other signals, to take our risk self not sugested by some art of indicators.
But if we are abowe topline, witch is set to 85 we can sey, we have have oversold signal.
Underline 30 isour potentialy buy signal.
Midrange 50 is mostly trand changin line.
This valu of top, mid bottom line you can change on the setting.
Every Coin have another level of this lines, and need to be checked individual to the coin.
Standard, settings are set fo timeframe : 12 min. 24 min, 1H and 4 H >
Blue crosses signalize possibilities trend changing.
This picture shou us how this indicator works.
Buy long signal : If yellow line is mostly at the bottom and green mostly on the top.
Sell long signal l. Yellow -top , green -bottom.
The Green line is from Directional Movement Index and is - DI line. Its show us selling trend. even higher position then mor sell of .
Standard value of CHOPPINES is 14 , works fin on 1H and abowe also wit the value of 28
Standard value for RSI AND -DI unchanging 14.
I tjink this is a simplu helpfull indycator.
WARNING!!! IF YOU AT THIS POINT CANT UNDERSUD THIS INDICATOR, PLEASE DONT USE THEM .
Signal, schould be confirmed with other indicators like MA, EMA even better with LSMA .
Please try it an make only paper trading, to undertand how its realy works.
Thank You!

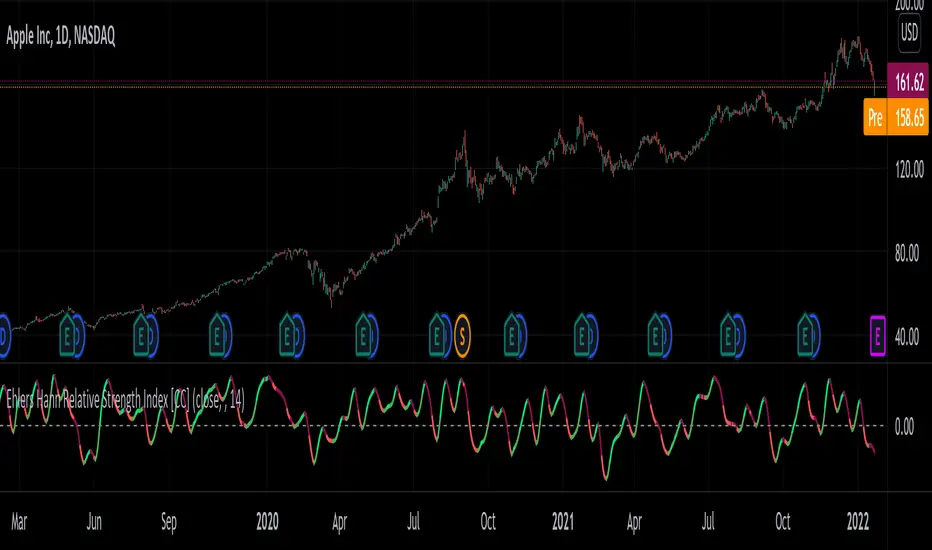
Ehlers Hann Relative Strength Index [CC]The Hann Relative Strength Index was created by John Ehlers (Stocks and Commodities Jan 2022 pgs 26-28) and this indicator builds upon his Hann Window Indicator to create an unique rsi indicator that doesn't rely on overbought or oversold levels to determine a reversal point and also provides a very superior smoothing without any of the lag associated with traditional smoothing. A much more useful RSI than the standard version in my honest opinion. Short term you buy when the line turns green and sell when it turns red. Medium to long term you buy when the indicator rises above the 0 line and sell when it falls below the 0 line. I have included strong buy and sell signals in addition to normal ones so strong signals are darker in color and normal signals are lighter in color.
Let me know if there are any other indicators or scripts you would like to see me publish!
[JL] How Many Signals last N barsGot this idea after I found Multiple Indicators Screener from QuantNomad.
This script learnt some codes from QuantNomad's great script. Thanks to him.
------------------------------------------------------------------------------------------------------------------------------------------------------------------------
This table show how many signals happened during the last N bars.
I only take care Forex, so this table only has 28 symbols. Feel free to change it.
Calculate the following signals:
RSI cross over/under 50
Short Moving average cross over/under long moving average
Stochastic k cross over/under d
MACD hist cross over/under 0
Williams Fractals: Up and Down fractals happened.
The concept is simple: Range period will always happen more cross signals than the trend period.
When the counter is less than median of all symbols, will be set green color. So more green mean more chance to be trend.

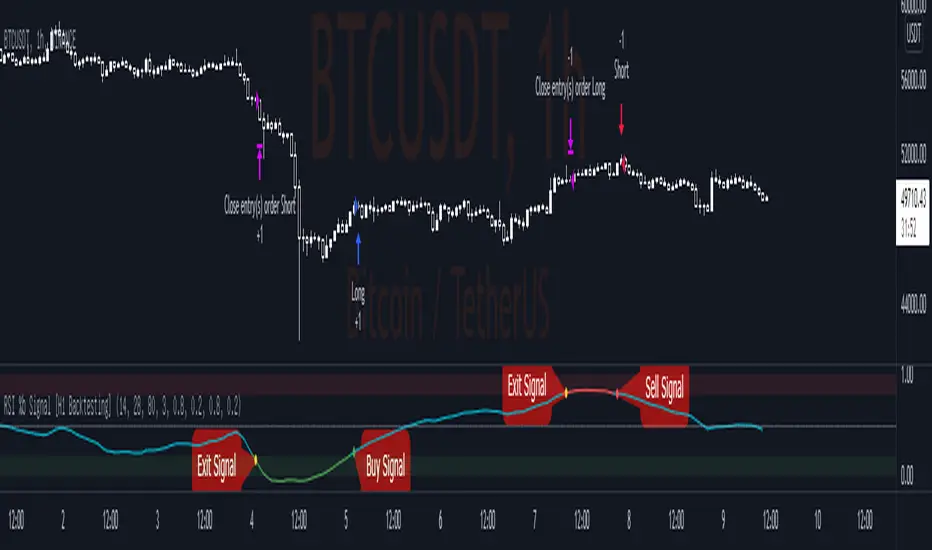
RSI %b Signal [H1 Backtesting]-----------------------------------------------------------------
This simple strategy base on RSI, EMA, Bollinger Bands to get Buy and Sell Signal with detail as below:
-----------------------------------------------------------------
1.Define Oscillator Line
+ Oscillator Line is smoothed by ema(28) of RSI(14) on H1 Timeframe
2.Define Overbought and Oversold
+ Apply Bollinger Bands BB(80,3) on Oscillator Line and calculate %b
+ Overbought Zone marked above level 0.8
+ Oversold Zone marked below level 0.2
3.Buy Signal
+ Entry Long Position when %b crossover Point of Entry Long
+ Deafault Point of Entry Long is 0.2
+ Buy signal marked by Green dot
4.Sell Signal
+ Entry Short Position when %b crossunder Point of Entry Short
+ Deafault Point of Entry Short is 0.8
+ Sell signal marked by Red dot
5.Exit Signal
+ Exit Position (both Long and Short) when %b go into Overbought Zone or Oversold Zone
+ Exit signal marked by Yellow dot
-----------------------------------------------------------------
Volume Based Ichimoku CloudIntroduction
This release focuses primarily on a volume-based Donchian. For some time I was looking for a volume-based Donchian, not finding anything that satisfied me I tried to apply one, and then I applied it to Ichimoku.
I found advantages especially in the lateralization phase, where the integration with the volume filters some false signals.
I have added some features:
- Check the conditions of buy/sell of classic Ichimoku
- Verified reverse buy/sell condition
- Alerts
- Entrance package
- possibility to choose the type of Donchian to use (classic, volume-based)
Settings
There are the classic parameters of Ichimoku, for scalping, I use setting like(6-17-34-17 or 5-14-28-14), the new parameters are:
Donchian Type : Classic / Volume Based
Show Condition : it shows green/red square on the bottom when all the conditions of Ichimoku are satisfied, without the checkmark the inputs or the alarms will not work for this type of signal
Show Reversal : it shows yellow/purple triangle on the bottom when all during short/long state condition of Ichimoku Tenkan cross the Kijun, without the checkmark the inputs or the alarms will not work for this type of signal
Trades Framework
Show Trade Lines : show the lines for Entry Point, TP1, TP2, SL
Per n Bars : For how many bars the sending lines will be drawn
Enter Gap : It's the gap, in percentage, from the last candle low/high. For example, the entry point will be set 0.1% higher than the last high of the candle, in a long situation, or 0.1% lower than the last low of the candle in a short situation.
Take Profit 1 : It's the gap, in percentage, from the entry point. For example, the first take profit will be set 0.5% higher/lower than the entry point.
Take Profit 2 : It's the gap, in percentage, from the entry point. For example, the second take profit will be set 0.5% higher/lower than the entry point.
Stop Loss : It's the gap, in percentage, from the entry point. For example, the stop loss will be set 0.5% higher/lower than the entry point.
How to use
The use will be like that for the classic Ichimoku, the combination with a volatility indicator or the volume analysis will certainly help to reduce false signals and therefore to select only the most profitable signals.
Remember that every statistical indicator is just a tool, it needs to be understood to be used at its best, otherwise, it is just a colored line in a colored graph.

Supertrend + RSI Strategy [Alose]This strategy combines the best of both indicators (Supertrend & RSI).
As we know, Supertrend is excellent at finding changes in the market trend and thus finding the best entries, however in my opinion it has a great weakness and it is that it does not know how to find the best exit point.
For this reason I decided to combine it with the RSI that we know usually knows the highest and lowest rebound points of the price, thus managing to find the best exit point for the strategy.
The best thing about combining these 2 indicators is that our trades will obtain better profits in less time.
LONG ENTRY
When SuperTrend changes its direction and it is less than 0.
LONG EXIT
There are two ways to close the trade:
When RSI is overbought, you can choose the "Overbought Level " inside the strategy settings (Default: 72).
When SuperTrend changes its direction and it is grater than 0.
SHORT ENTRY (You can enable short entries in strategy settings)
When SuperTrend changes its direction and it is grater than 0.
LONG EXIT
There are two ways to close the trade:
When RSI is oversold, you can choose the "Oversold Level " inside the strategy settings (Default: 28).
When SuperTrend changes its direction and it is less than 0.

Indicators & Conditions Test Framework [DTU]Hello All,
This script is a framework to build strategies by combining indicators and conditions (long, short, exits). You are able to analyze your strategies in realtime by changing the input parameters related to indicators, conditions and their combinations.
OVERVIEW
With this Study/Strategy framework, you will be able to create strategy conditions, display them on the chart, and test them using existing indicators as well as external and custom indicators that you can add.
The main purpose of the Framework is to choose your indicators to be used in the conditions and test your strategy by producing your "Long, short, Exit long, Exit short" combinations.
Although may be, it can be a bit difficult and complicated at first start, but you can understand the logic on its use in a very short time.
Notes:
I removed external links off descriptive images and video to be comply with Trading view violation House Rules
Since I am new in the community and still trying to understand the pine script language I can make errors and violations on my script. Please Inform me on any issue that I made..
HOW TO
STEP 1: SETTINGS ______________________________________________________________________________________________________
SOURCE, TIMEFRAME, SECURITY
Select the Source, timeframe and Secure type that your indicators will use.
Here, the Secure entry consists of 3 parts and the f_security function is used to determine it.
a)Secure
This option is defined as reducing repaint in tradingview calculations as much as possible. The following function is used.
request.security(_symbol, _res, _src , lookahead=barmerge.lookahead_on)
b)Semi Secure
While this option can reduce repaint in tradingview calculations as much as possible, it is less secure. The following function is used.
request.security(_symbol, _res, _src )
c)Repaint
This option turns on the repaint feature. The following function is used.
request.security(_symbol, _res, _src ) : na
Ind Source:
You can the source that indicators will use their own calculations
Ext Source:
You can import external Indicator sources from here . It appears on condition/combination area as "EXT".
To export the External indicator plot it with a title. It will be visible in source dropdown input
PERIOD , ALERTS...
Period:
Determine your strategy testing period by selecting start and end date/time
(!!! According to your tradingview subscription, it takes the last 5000, 10000.. bars.
The extra bar option may cause problems such as not appearing in the calculations or errors).
Plot Alerts:
Plot condition result as alerts arrows on the chart's bottom for "LONG" and the top for "SHORT" entries, exits
Close on opposite:
When selected, a long entry gets closed when a short entry opens and vice versa
Show Profit:
It appears if script is in strategy mode (not in study) this can display current or open profit for better reanalyzing your strategy entry exit points. (Currently under development)
PLOT TYPE OPERATIONS
This option has 4 entries
a) Mult
Sets the multiplier for the selected Plot Type (stochastic, Percentrank, Org Range (-1,1) ) except for "Original" in the range (-1,1).
EXAMPLE: When 1000 is selected, the indicator in the range of (-1,1) will appear in the range of (-1000, 1000) on the screen.
b) Shift
It determines the shift that will appear on the screen for the selected Plot Type (stochastic, Percentrank,Org Range (-1,1) ) in the range (-1,1) other than "Original".
EXAMPLE: When Shift:35000 and mult:1000 are selected, the indicator will appear in the range (34000, 36000) on the screen.
c) Smooth
This option (only for Stochastic & PercentRank) allows to smooth the indicator to be displayed.
Here, tradinview ta.swma function is used.
b) hline
Adjusts the horizontal lines to appear on the screen according to the mult factor for the range (-1,1)
The lines represent the values (-1, -05, 0, 05, 1)
STEP 2: INDICATORS ______________________________________________________________________________________________________
You need to choose indicators that you can use in strategy conditions.
Here, the indicators come from the dturkuler/lib_Indicators_DT open script library defined in the code
In addition, you can add the indicators that you will create in the area defined in the code to this list..
You can also import external indicators and test them with other variables on the system..
You can choose a maximum of 5 indicators that you can use in total. (can be increased in new versions)
Indicators are categorized in 3 main sections
Indicator Selection:
You can select your indicators from this area
a)Moving Averages
These are indicators such as EMA, SMA that you can show on the stock. They come from the library.
These indicators are fed from Settings/source. Only the length value can be used as a parameter.
In addition, line colors can be changed..
As of now, there are 28 indicators in the library in total and 5 indicators are left as future use for this field for now.
b)Other Indicators
These are different indicators from the stock value such as RSI, COG. They come from the library. These indicators are fed from Settings/source.
Only the length value can be used as a parameter. In addition, line colors can be changed.
As of now, there are 24 indicators in the library in total and 5 indicators are left as a future use for this field for now.
c)Custom Indicators
These indicators are the ones you can create by programming yourself in the source code..
The area at the bottom of the settings screen is reserved for the parameters of this type of indicators.
Indicator Length:
You can update your selected indicator length value from here. (Not: it doesn't work for custom indicators since they have their parameter on cust. Ind. input screen )
Indicator Plot Type:
Next to the indicators, there is an input selection field about how they will be displayed on the screen.
a)Original
The indicator is displayed on the screen with its current values. It is an ideal solution for displaying moving average indicators such as (EMA, SMA) over current stock.
Since the values of indicators such as (RSI, COB) are low (-100,100 : -1.1), they appear at the bottom of the screen and make analysis difficult.
For this reason, other options may be more suitable for these.
b)Stochastic
The indicator is displayed on the screen with stochastic calculation in the range of -1.1.
It uses the stochastic(50) calculation method to spread indicators such as (RSI, COB) over the range (-1,1).
Indicators in this selection can be fixed and monitored under stock on the screen with the parameters under the Plot Type section.
You can see the original values of the relevant indicator on the Data Window screen.
(!!! Do not use the values on the chart in your condition calculations. Instead, get the values from Data Window)
c)PercentRank
The indicator is displayed on the screen with stochastic calculation in the range of -1.1. .
Since the values of indicators such as (RSI, COB) are low (-100,100 : -1.1), they appear at the bottom of the screen and make analysis difficult.
Indicators in this selection can be fixed and monitored under stock on the screen with the parameters under the Plot Type section.
You can see the original values of the relevant indicator on the Data Window screen
((!!! Do not use the values on the chart in your condition calculations. Instead, get the values from Data Window)
d)Org Range (-1,1)
If your indicator is in the range of -1.1, your indicator will be displayed on the screen with its original calculation in the range of -1.1.
Indicators in this selection can be fixed and monitored under stock on the screen with the parameters under the Plot Type section.
You can see the original values of the relevant indicator on the Data Window screen.
(!!! Do not use the values on the chart in your fitness calculations. Instead, get the values from Data Window)
STEP 2 NOTES:
STEP 3: CONDITIONS ______________________________________________________________________________________________________
After choosing the indicators you will use in the conditions, you move on to the "CONDITIONS" section.
There are 4 conditions type here.
• LONG ENTRY CONDITION
• SHORT ENTRY CONDITION
• LONG CLOSE CONDITION
• SHORT CLOSE CONDITION
The use of each condition is the same.
There are 3 combinations you can use in each condition. (can be increased in new versions)
a)COMBINATIONS
There are 3 combinations you can use in each condition. (can be increased in new versions)
Each combination are build from 4 parts
1)1st Indicator
If set to "NONE" this combination will not be used on calculations. You can select
IND1-5: from indicators (See above),
EXT: value from externally imported indicator
Stock built-in values: close, open...
2)Operator
Selected Operator compares 1st Indicator with the 2nd one. You can select different operators such as
crossover, crossunder, cross,>,<,=....
3)2nd Indicator
This indicator will be compared with the 1st one via selected Operator. You can select
IND1-5: from indicators (See above),
VALUE: a float value defined in the combinations value parameter
EXT: value from externally imported indicator
Stock builtin values: close,open...
4)Value
When the 2nd indicator field is "VALUE", value area compares the entered value.
ex: 1st indicator="open", op=">", 2nd indicator="VALUE", value=3000.12 means is(close>3000.12)
In other conditions, it compares the previous values of the indicator.
ex: 1st indicator="open", op=">" 2nd indicator is "close" and value is 2 means is(open>close )
EXAMPLES:
indicator 1= "IND1", Operator=">", indicator 2= "IND2" => is(IND1>IND2)
indicator 1= "IND1", Operator=">", indicator 2= "VALUE", "0.1" => is(IND1>0.9)
indicator 1= "IND2", Operator="crossover", indicator 2= "IND1" => is(IND2 crossover IND1) : like a=ta.crossover(IND2, IND1)
indicator 1= "IND1", Operator="<", indicator 2= "close" => is(IND1>close)
indicator 1= "IND1", Operator="<", indicator 2= "EXT" => is(IND1>EXT) , EXT mean external imported indicator that define on settings section
indicator 1= "IND1", Operator="<", indicator 2= "IND1", Value="1" => is (IND1>IND1 )
b)JOIN COMBINATIONS
Each combination in Condition is compared with the next one via JOIN operator
The join operator can be selected as AND or OR.
Examples:
1st combination= is(IND1>0.9) true
2nd combination= is(IND2 crossover IND1) false
1st combination "AND" 2ndcombination" => false (is(IND1>0.9) AND is(IND2 crossover IND1))
1st combination "OR" 2nd combination" => true (is(IND1>0.9) OR is(IND2 crossover IND1))
STEP 3 NOTES:
When the 2nd indicator field is "VALUE", value area compares the entered value. In other conditions, it compares the previous values of the indicator.
In cases where "VALUE" is not selected, integer values must be entered in this field. (float should not be entered. ie 1, 2 should be entered)
!!!If the 1st indicator is "NONE" in the combination, that combination is cancelled.
Each combination returns true/false, allowing the selected value to be compared with another value
Example: EMA(21)>EMA(50) returns true under all conditions or (EMA(21) crossover EMA(50)) returns true when passed.
You can use , Value of 5 indicators (IND1-IND5) or (VALUE) that you have defined in combinations or import indicator (EXT) or stock values (close, open, high...) in your calculations.
combination Compares the 1st indicator with 2nd indicator via the operator.
STEP 4: CUSTOM INDICATORS ______________________________________________________________________________________________________
There is an area in the code for designing Custom Indicators.
Here you can design your own indicators and use them in the framework.
You can also create unlimited parameters for your indicators in the SETTINGS custom indicator field.
For now, only 3 Custom indicators have been defined.
Examples are entered in the code for custom indicators.
STEP 4 NOTES:
Including / updating custom to the code is explained in the source code
• LIMITATIONS:
!!! According to your tradingview subscription, it takes the last 5000, 10000.. bars. More bar options may cause problems such as not appearing in the calculations or errors.
• RAMBLINGS:
• NOTES [ /i]
This Script can be used as an indicator if the last strategy parts in the code are commented out and converted to the initial strategy study.
It was originally prepared for my use with my own strategy framework and has export functions accordingly.
When integrated to my own strategy framework it brings many more features over strategy definition of trades.
• TODO [ /i]
TODO: Add tooltips to the settings screen
TODO: Add double triple, Quatr factor for all indicators (convert any indicator to factor2-4 facotr. ex: EMA to DEMA, TEMA, QEMA...)
TODO: Add factorized Fibo avg range indicator (good for trend definition and entry exit points)
TODO: Add bands to the indicator and conditions
TODO: Add debug window for exporting indicator's parameters
TODO: Add isRising(value) isFalling(value), is...(value) .... to combinations (they can be used as custom indicator also
TODO: Reassess condition entry screen for user friendly GUI
TODO: Increase # conditions from 3 to 4
TODO: Reassess strategy entries, exit and close (should be improved)
TODO: Add Alerts, Condiional alerts for indicator (study) part
TODO: Create export function v3 for Pinecoders Indicator framework
• THANKS:
For Pine script format docs RicardoSantos .
For Pine script coding standards Pinecoders .
For moving average script used on library s RodrigoKazuma .

Ehlers Error Correcting Exponential Moving Average [CC]The Error Correcting Exponential Moving Average was created by John Ehlers and Ric Way (Stocks & Commodities V. 28:11 (30-35)) and this is an excellent moving average that accurately identifies the trend and sticks with the price during trends or choppy periods pretty well. It looks back to find the best gain setting for each day that returns the smallest difference between the current price and the ema based on the gain setting and uses that day's info in it's total calculations and if there is a zero gain for the day then it is just a classic ema. I have included strong buy and sell signals in addition to normal ones so lighter colors are normal and darker colors are strong. Buy when the line turns green and sell when it turns red.
Let me know if there are any other indicators you would like to see me publish!

Prime Number CheckerThis is not a foolproof method for finding every prime number but will work well on assets $10 to $100. I will be working on something more robust with scaling for all assets. If you want a main pane indicator with just the background coloring keep the indicator as it is. If you want a lower pane indicator get rid of the current study function and replace with the commented out study function by deleting the //. Also comment in line 28 also by deleting the //. Prime numbers are an excellent natural mathematical site of reversal and you will begin to see this as you work with them.
Any questions don't be scared to ask.
Eliza.

Barcolor X 2021-9-28This barcolor setting adds dimension to whether it's above or below where it was X bars ago by adding a longer term argument to filter out sideways price action. For example, the white price bars show when the price stayed above where it was five bars ago AND twenty bars ago. Adjust the lookback values to suit your needs. As usual, the settings I come up with work best when used on multiple time frames!
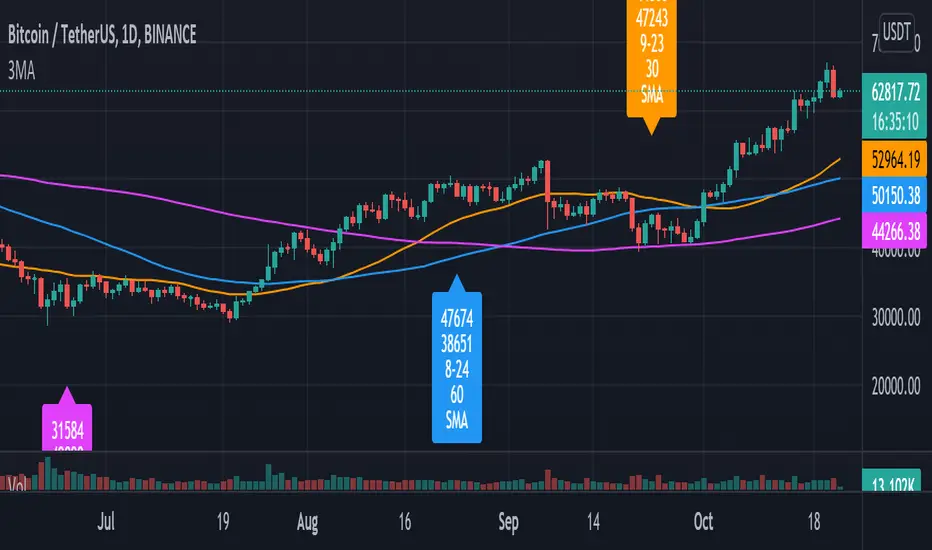
Pulu's 3 Moving Averages
Pulu's 3 Moving Averages
Release version 1, date 2021-09-28
This script allows you to customize three sets of moving averages, turn on/off, set color and parameters. It also tags the start date of the last set of moving average if there is. This, release version 1, supports eight moving average algorithms:
ALMA, Arnaud Legoux Moving Average
EMA, Exponential Moving Average
RMA, Adjusted exponential moving average (aka Wilder’s EMA)
SMA, Simple Moving Average
SWMA, Symmetrically-Weighted Moving Average
VWAP, Volume-Weighted Average Price
VWMA, Volume-Weighted Moving Average
WMA, Weighted Moving Average
The availability and function parameters
Func. Availability Parameters
ALMA
MA1, MA2, MA3
source
length
offset
sigma
EMA
RMA
SMA
VWMA
WMA
MA1, MA2, MA3
source
length
SWMA
VWAP
MA1
source
Parameters
Parameter Description
source the series of values to process. The default is to use the closing price to calculate the moving average.
length an integer value that defines the number of bars to calculate the moving average on. The SWMA and VWAP do not use this parameter.
ALMA offset a floating-point value that controls the tradeoff between smoothness (with a value closer to 1) and responsiveness (with a value closer to 0). This parameter is only used by ALMA.
ALMA sigma a floating-point value that specifies the ALMA’s smoothness. The larger this value, the smoother the moving average is. This parameter is only used by ALMA.
I'm not sure if it is needed, so I do not let the three Moving Averages of the script to have indivial algorithm setting. Because that will involve much complicated condition testing and use up more TradingView script lines limit. If you need to combine different algorithms in the three sets of moving averages, or have other ideas, leave a message to let me know; maybe I will try it in the next update.
我不確定是否需要,所以我沒有讓腳本的三組移動平均線有各別的算法設置。因為這將涉及更多複雜的條件測試,並使用更多 TradingView 腳本列數限制。如果您需要在三組均線中組合不同的算法,或者有其他想法,請留言告訴我;也許我會在下一次更新中嘗試。
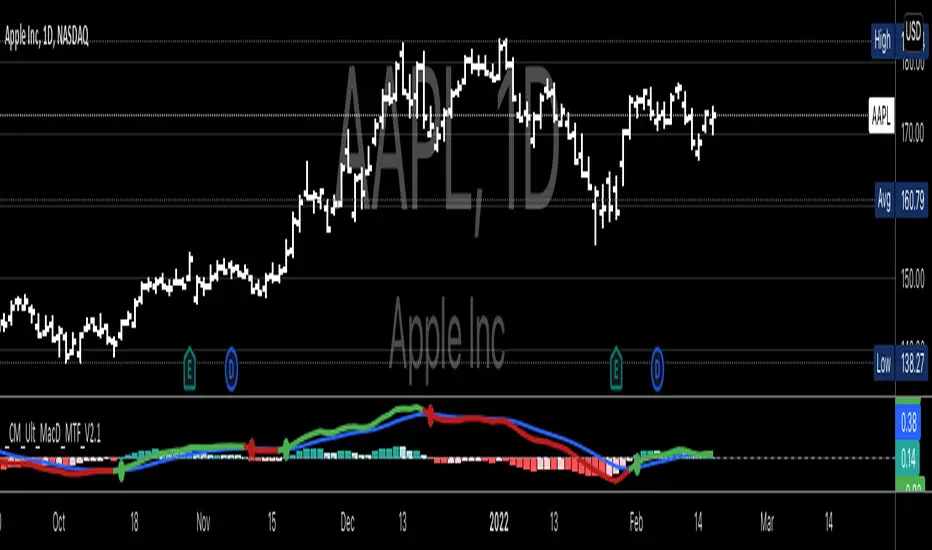
CM MACD Custom Indicator - Multiple Time Frame - V2***For a Detailed Video Overview Showing all of the Settings...
Click HERE to View Video
New _CM_MacD_Ult_MTF _V2 Update 07-28-2021
Thanks to @SKTennis for help in Updating code to V2
Added Groups to Settings Pane.
Added Color Plots to Settings Pane
Switched MTF Logic to turn ON/OFF automatically w/ TradingView's Built in Feature
Updated Color Transparency plots to work in future update
Added Ability to Turn ON/OFF Show MacD & Signal Line
Added Ability to Turn ON/OFF Show Histogram
Added Ability to Change MACD Line Colors Based on Trend
Added Ability to Highlight Price Bars Based on Trend
Added Alerts to Settings Pane.
Customized how Alerts work. Must keep Checked in Settings Pane, and When you go to Alerts Panel, Change Symbol to Indicator (CM_Ult_MacD_MTF_V2)
Customized Alerts to Show Symbol, TimeFrame, Closing Price, MACD Crosses Up & MACD Crosses Down Signals in Alert
Alerts are Pre-Set to only Alert on Bar Close
See Video for Detailed Overview
New Updates Coming Soon!!!
***Please Post Feedback and Any Feature Requests in the Comments Section Below***
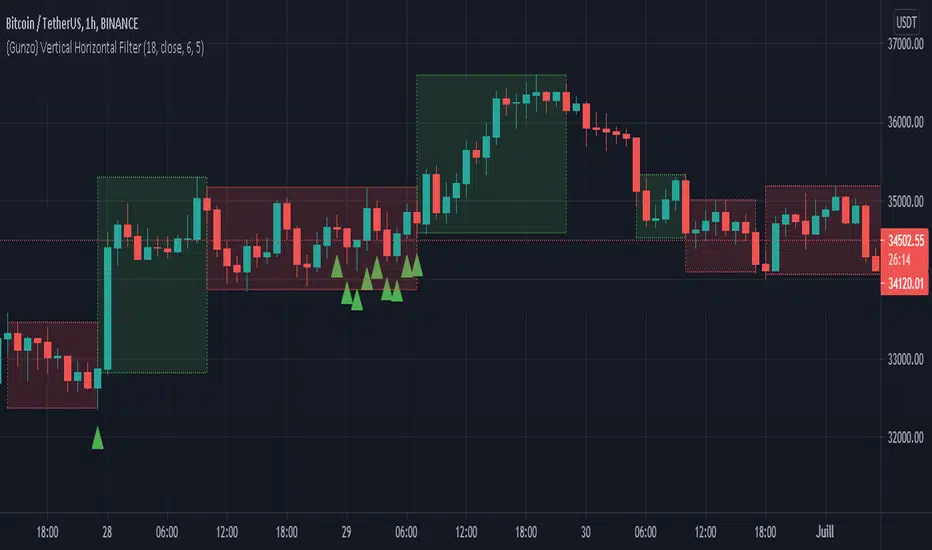
{Gunzo} Vertical Horizontal Filter (Trading ranges)Vertical Horizontal Filter indicator is a tool that can be used to identify market conditions (ranging or trending). It measures if the price is going vertical (uni-directional) or horizontal (non-directional).
OVERVIEW :
The Vertical Horizontal Filter is a technical analysis indicator created by Adam White in 1991. He described it in the “Issues of Futures” magazine for the first time. The indicator is only composed of one line that measures the level of trend activity.
If the VHF line is increasing, we consider that the trend is getting stronger (up-trend or down-trend). Otherwise, if the VHF line is decreasing, we consider that the trend is weakening (going sideways or even ranging) as the market is getting calmer
CALCULATION :
The level of trend activity is calculated as the ratio between the distance from the highest to the lowest value (on the last N days) and the movement of the closing price.
VHF = ( highest (high) – lowest (low) ) / sum( close – previous close)
SETTINGS :
VHF length : Length of the vertical horizontal filter (28 or 18 recommended)
VHF source : Source of the vertical horizontal filter (close recommended)
VHF smoothing length : Extra smoothing applied on the VHF line to filter noise (1 or 6 or 9 or 14 recommended)
Display ranging market rectangles : Display rectangles on the chart around the area where VHF is decreasing (ranging market)
Display trending market rectangles : Display rectangles on the chart around the area where VHF is increasing (trending market up or down)
Minimum rectangle size : Hide rectangles that are smaller than X candles
Display signal line : Display circles at the bottom of the chart with the raw VHF direction (green if increasing /red if decreasing)
Display VHF tops and bottoms : Display triangles if the VHF line is reaching a new high or new low over the last 100 candles. When consecutive triangles appear, it may be a sign that the current market conditions are ending. Green triangles mean the possible end of the ranging market and red triangles mean the possible end of the trending market.
VISUALIZATIONS :
This indicator has 3 possible visualizations :
Rectangles : the rectangles are drawn on areas where the VHF is decreasing (red) or increasing (green) for a minimum number of consecutive candles. The first candles of an area may not be representative of the market conditions as the VHF line is still in extreme values but going slowly in the opposite direction. The market conditions (ranging or trending) get stronger with the VHF line keeping the same direction.
Signal line : The signal line is the VHF raw data : the red circle is a decreasing VHF line, and the green circle is an increasing VHF line.
Tops and bottoms : The tops and bottoms are signals indicating that the VHF line is reaching extreme values, there is a high probability that the market conditions are going to change after that.
USAGE :
This indicator can be used as a filter for strategies based on other technical analysis indicators.
If you are using trending indicators like moving averages, you should consider using them only when the market is trending. You can use VHF increasing to confirm that the market is not ranging.
If you are using oscillating indicators like stochastic or commodity channel index, you may prefer using them when the market is ranging as trending indicators may not be useful. You can use the VHF decreasing to confirm that the market is ranging.
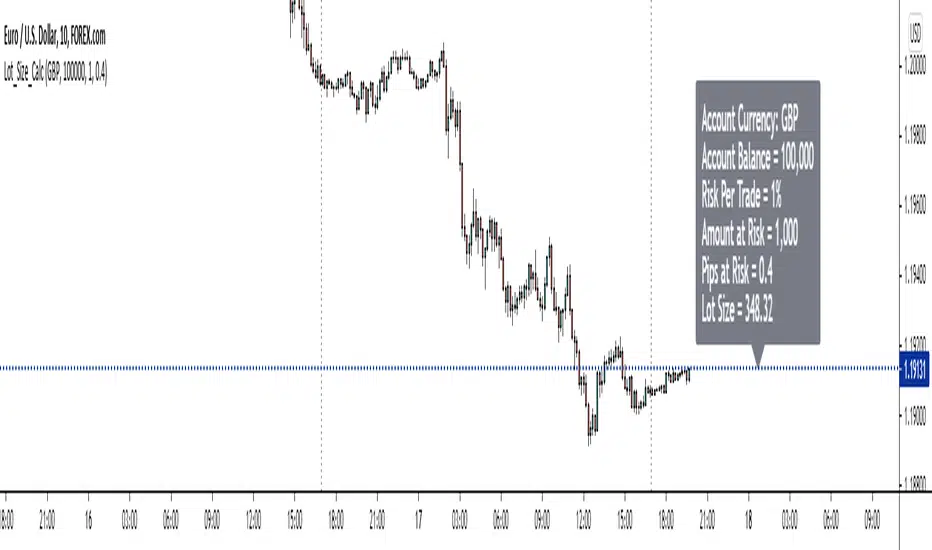
Forex Position Size CalculatorThe purpose of this position size calculator is to assist fellow traders in their position size calculations straight from tradingview without having to rely on other apps or websites.
Account balance in the 8 major currency pairs are also available as an input option (i.e. if the account balance is based in pounds, dollars, euros, it can be selected).
Right now this only works on the 28 forex cross currency pairs. At a later date, the indicator will be updated to handle exotic pairs, commodities, and gold.
Technical Analysis Consulting Table (TACT)Inspired by Tradingview's own "Technical Analysis Summary", I present to you a table with analogous logic.
You can track any ticker you want, no matter your chart. You can even have multiple tables to track multiple tickers. By default it tracks the Total Crypto Cap.
You can change the resolution you want to track. By default it is the same as the chart.
You can position the table to whichever corner of the chart you want. By default it draws in the bottom right corner.
Background colors and text size can be adjusted.
Indicators Used:
Oscillators
RSI(14)
STOCH(14, 3, 3)
CCI(20)
ADX(14)
AO
Momentum(10)
MACD(12, 26)
STOCH RSI(3, 3, 14, 14)
%R(14)
Bull Bear Power
UO(7,14,28)
Moving Averages
EMA(5)
SMA(5)
EMA(10)
SMA(10)
EMA(20)
SMA(20)
EMA(30)
SMA(30)
EMA(50)
SMA(50)
EMA(100)
SMA(100)
EMA(200)
SMA(200)
Ichimoku Cloud(9, 26, 52, 26)
VMWA(20)
HMA(9)
Pivots
Traditional
Fibonacci
Camarilla
Woodie
WARNING: I have observed up to a couple of seconds of signal jitter/delay, so use it with caution in very small resolutions (1s to 1m).
I hope you enjoy this and good luck with your trading. Suggestions and feedback are most welcome.

Crypto EMA Trend Reversal StrategyThis is an EMA crossover strategy which involves 5 EMAs to trigger trades. The strategy has two take profit settings and uses a stop loss.
TP1 and SL are based on ATR and TP2 is an EMA crossover.
The strategy goes both long and short and the default settings work particularly well as a scalping strategy for ETHUSDT on the 5M time frame.
I have also created another version with tweaked settings for scalping LINKUSDT on the 5M with very similar results.
There is an option to add a volume condition parameter within the script on lines 26-28 which can be added to the end of lines 34-35 in the following format: and vol_cond
I personally don't currently use the volume condition parameter.

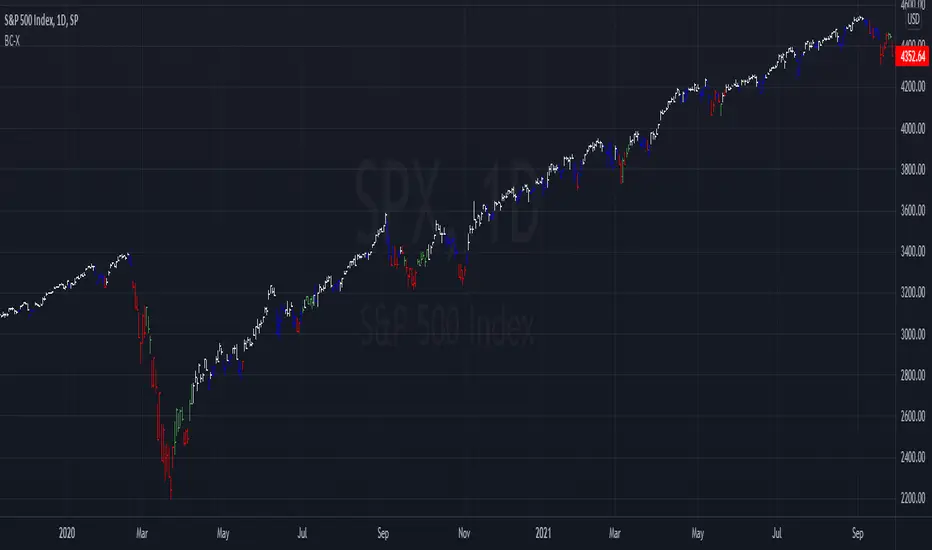
Simple way to BEAT the market [STRATEGY]This script has been created to demonstrate the effectiveness of using market regime filters in your trading strategy, and how they can improve your returns and lower your drawdowns
This strategy adds a simple filter (A historical volatility percentile filter, an implementation of which can be found on my trading profile) to a traditional buy and hold strategy of the index SPY.
Note, There are other filters that could also be added including a long-term moving average/percentile rank filter/ADX filter etc, to improve the returns further.
The filter closes our long position during periods of volatility that exceed the 95th percentile (or in the top 5% of volatile days) and buys back when the volatility is below 95% rank of the past 100 days
Have included the backtest results since 1993 which is 28 years of data at the time of writing. Comparison of traditional buy and hold with this modified strategy can be found below:
Traditional buy and hold:
Return per year: 7.95 % (ex Dividends)
Total return: 851.1 %
Max drawdown: 50.79 %
'Modified' buy and hold (this script):
Return per year: 9.92 % (ex Dividends)
Total return: 1412.2 %
Max drawdown: 31.57 %
Feel free to use some of the market filters in my trading profile to improve and refine your strategies further, or make a copy and play around with the code yourself. This is just a simple example for demo purposes.
