Demo GPT - Day Trading Scalping StrategyOverview:
This strategy is designed for day trading and scalping, utilizing a combination of technical indicators, candlestick patterns, and volume analysis to determine entry and exit points. It focuses on capturing short-term price movements while ensuring that trades are executed under specific market conditions.
Key Components:
Technical Indicators Used:
Exponential Moving Average (EMA): The strategy uses the 20-period EMA to identify the trend direction. The EMA smooths out price data, helping traders make more informed decisions about potential buy or sell signals.
Volume Weighted Average Price (VWAP): VWAP is used to measure the average price a security has traded at throughout the day, based on both volume and price. This indicator helps assess whether the current price is above or below the average trading price.
Camarilla Pivot Points: The strategy calculates four levels of Camarilla pivots (S2, S3, R2, R3) based on the highest and lowest prices over the last 14 daily candles. These levels act as potential support and resistance zones, guiding entry and exit decisions.
Candlestick Analysis:
Buy Condition: A buy signal is triggered when:
The first candle (previous candle) is green (close > open).
The second candle (current candle) is also green and opens above the first candle.
The volume of the current candle exceeds the 20-period moving average of volume, indicating strong buying interest.
Sell Condition: A sell signal is triggered when:
The first candle is red (close < open).
The second candle opens below the first red candle.
The volume of the current candle also exceeds the 20-period moving average of volume, indicating strong selling pressure.
Position Management:
The strategy enters a long position (buy) when the buy condition is met and closes the long position when the sell condition is met. This approach aims to capture upward momentum while avoiding extended exposure to downside risks.
Trading Settings:
Capital Management: The strategy uses 100% of available capital for each trade, allowing for maximum exposure to potential gains.
Commission and Slippage: The script includes settings for a commission rate of 0.1% and slippage of 3, accounting for trading costs and potential price changes during order execution.
Date Filtering: The strategy allows users to set a start date (January 1, 2018) and an end date (December 31, 2069) for trade execution, providing flexibility in backtesting and live trading.
Visualization:
The script plots the 20 EMA, VWAP, and the Camarilla pivot levels on the chart for visual reference.
Buy and sell signals are visually represented with shapes on the chart, making it easy to identify potential trade opportunities at a glance.
Volume is plotted in a separate pane to assess trading activity, and a horizontal line at zero provides a reference point.
Summary:
This Day Trading Scalping Strategy is designed to exploit short-term price movements by using a combination of EMAs, VWAP, and Camarilla pivot levels, alongside candlestick patterns and volume analysis. It is well-suited for traders looking to make quick trades based on real-time market conditions while maintaining a disciplined approach to entry and exit points. The strategy is highly visual, allowing traders to quickly assess market conditions and make informed trading decisions.
Feel free to modify or adjust any aspects of the strategy according to your specific trading goals or preferences!
Komut dosyalarını "20日线角度大于0的股票" için ara

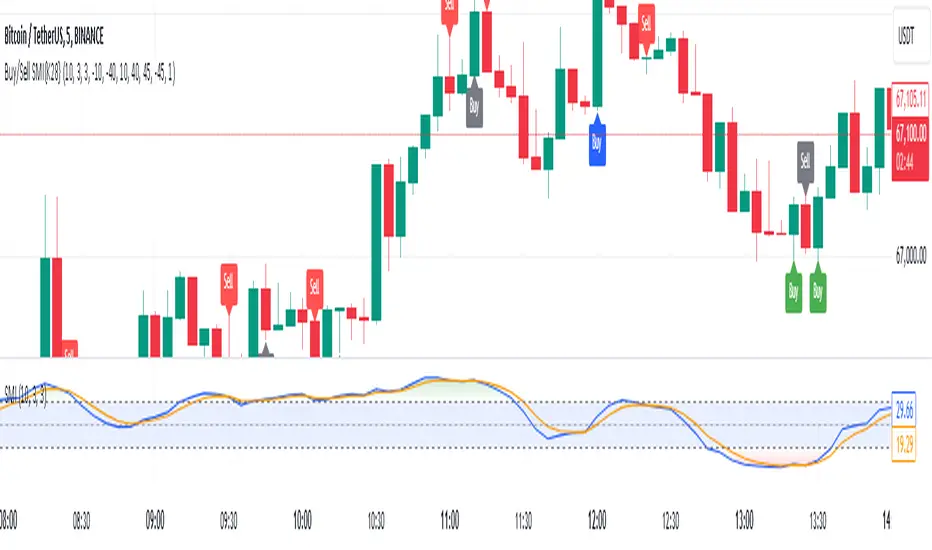
Buy and Sell Signals Based on SMI {K28}Buy/Sell Signals Based on SMI
This indicator provides buy and sell signals based on the Stochastic Momentum Index (SMI) to assist traders in identifying potential entry and exit points in the market. Here’s how to effectively use this indicator:
Usage Instructions:
Signal Interpretation:
No signal is 100% guaranteed
Green Labels: Indicate strong buy signals when the SMI crosses above its EMA, especially if the candle is green (closing price higher than opening price).
Red Labels: Indicate strong sell signals when the SMI crosses below its EMA.
Cautious Signals:
Blue Buy Labels: These buy signals appear when the SMI is in a cautious zone (between -20 and 20). They may not be as reliable, so confirm these signals with other indicators before acting.
Yellow Sell Labels: These buy signals appear when the SMI is in a cautious zone (between -20 and 20). They may not be as reliable, so confirm these signals with other indicators before acting.
Gray Buy and Sell Labels: Indicate potential false signals (when the SMI is overbought or oversold). Use other confirmation indicators to verify these signals.
Trade Strategy:
This indicator is designed for traders looking to make small, consistent profits. Focus on executing more trades rather than waiting for larger price movements.
Be mindful that the indicator may yield frequent signals, so it's essential to maintain discipline and only take trades that meet your criteria for confirmation.
Important Notes:
Caution with Signals: Always exercise caution when acting on blue or gray labels. These may indicate less reliable signals, so it's crucial to confirm with additional indicators.
No Perfect Indicator: Please remember that no trading indicator is perfect. Use this indicator at your own risk, and consider incorporating risk management strategies into your trading plan.
Conclusion:
By employing this SMI indicator, you can enhance your trading strategy focused on generating small, consistent profits through frequent trades. However, always verify signals and stay aware of market conditions to optimize your trading performance.
FuTech V-Spike & V-HighlighterFuTech V-Spike & V-Highlighter
In the context of trading and technical analysis, this volume spike & volume highlighter indicator is the perfect indicator used to assess market activity and make informed trading decisions.
Let's Understand in brief as below :
1) Volume Spike :
A volume spike refers to a sudden, significant increase in trading volume compared to the average volume over a specific period.
This spike can indicate heightened interest in a particular security, often preceding price movements.
Traders may look for volume spikes as signals for potential buy or sell opportunities because they can suggest that a stock is experiencing increased activity, possibly due to news, earnings releases, or other catalysts.
Characteristics of a Volume Spike:
Assess the sudden increase in trading volume.
It Can occur in both upward and downward price movements.
Often compared to the average volume over a defined period (e.g., the last 20 days).
2) Volume Highlighter:
A volume highlighter emphasizes significant changes in trading volume on a price chart. This indicator typically uses color coding to highlight periods of high volume, making it easier for traders to identify volume spikes at a glance.
How this indicator works:
a) Volume Spike will calculate the highest volume spike as per the user defined threshold multiplier. (Multiplier = when volume exceeds a certain threshold)
b) The threshold Multiplier can be set based on a fixed number or as a multiple of the Exponential Moving Average volume. Volume Spike Multiplier default is 1.5, means the EMA volume should cross 1.5 times the user defined lookback period
c) The result is derived from the user defined lookback candles by using its EMA instead of SMA, which will give us more precise results.
d) By default, last 10 candles EMA average is used to calculate the Volume Spike but you can choose your lookback period as many days, weeks, months, years of your choice !
e) In Volume Spike -
- Green candle will show Yellow color Bar as Bullish sentiments, whereas
- Red candle will show Black Bar as Bearish sentiments.
f) Volume Highlighter will highlight the candles background if the highest volume is crossing as per the the user defined lookback period
g) Default Lookback period is 20, Color coding (e.g., Blue for bullish spikes, Red for bearish spikes) helps traders quickly assess the volume context.
h) Volume Highlighter plotting shapes and positions can be modified
Illustration:
From the Above pic,
If last Volume Spike is 10 lookback candles, Spike multiplier is 1.5 and Highlighter lookback candles is 20,
Then yellow candle means the spike in volume which is 1.5 times higher than the last 10 candles
Highlighting color defines the highest volumes trading from the last 20 candles which is either Blue (Bullish) or Red (Bearish) sentiments
Conclusion :
Using FuTech V-Spike & V-Highlighter indicator - will help traders identify potential trading opportunities and better understand market dynamics.
By analyzing volume in conjunction with price movements, traders can make more informed decisions based on market sentiment.
Thank you !
Jai Swaminarayan Dasna Das !
He Hari ! Bas Ek Tu Raji Tha !

[3Commas] Signal BuilderSignal Builder is a tool designed to help traders create custom buy and sell signals by combining multiple technical indicators. Its flexibility allows traders to set conditions based on their specific strategy, whether they’re into scalping, swing trading, or long-term investing. Additionally, its integration with 3Commas bots makes it a powerful choice for those looking to automate their trades, though it’s also ideal for traders who prefer receiving alerts and making manual decisions.
🔵 How does Signal Builder work?
Signal Builder allows users to define custom conditions using popular technical indicators, which, when met, generate clear buy or sell signals. These signals can be used to trigger TradingView alerts, ensuring that you never miss a market opportunity. Additionally, all conditions are evaluated using "AND" logic, meaning signals are only activated when all user-defined conditions are met. This increases precision and helps avoid false signals.
🔵 Available indicators and recommended settings:
Signal Builder provides access to a wide range of technical indicators, each customizable to popular settings that maximize effectiveness:
RSI (Relative Strength Index): An oscillator that measures the relative strength of price over a specific period. Traders typically configure it with 14 periods, using levels of 30 (oversold) and 70 (overbought) to identify potential reversals.
MACD (Moving Average Convergence Divergence): A key indicator tracking the crossover between two moving averages. Common settings include 12 and 26 periods for the moving averages, with a 9-period signal line to detect trend changes.
Ultimate Oscillator: Combines three different time frames to offer a comprehensive view of buying and selling pressure. Popular settings are 7, 14, and 28 periods.
Bollinger Bands %B: Provides insight into where the price is relative to its upper and lower bands. Standard settings include a 20-period moving average and a standard deviation of 2.
ADX (Average Directional Index): Measures the strength of a trend. Values above 25 typically indicate a strong trend, while values below suggest weak or sideways movement.
Stochastic Oscillator: A momentum indicator comparing the closing price to its range over a defined period. Popular configurations include 14 periods for %K and 3 for %D smoothing.
Parabolic SAR: Ideal for identifying trend reversals and entry/exit points. Commonly configured with a 0.02 step and a 0.2 maximum.
Money Flow Index (MFI): Similar to RSI but incorporates volume into the calculation. Standard settings use 14 periods, with levels of 20 and 80 as oversold and overbought thresholds.
Commodity Channel Index (CCI): Measures the deviation of price from its average. Traders often use a 20-period setting with levels of +100 and -100 to identify extreme overbought or oversold conditions.
Heikin Ashi Candles: These candles smooth out price fluctuations to show clearer trends. Commonly used in trend-following strategies to filter market noise.
🔵 How to use Signal Builder:
Configure indicators: Select the indicators that best fit your strategy and adjust their settings as needed. You can combine multiple indicators to define precise entry and exit conditions.
Define custom signals: Create buy or sell conditions that trigger when your selected indicators meet the criteria you’ve set. For example, configure a buy signal when RSI crosses above 30 and MACD confirms with a bullish crossover.
TradingView alerts: Set up alerts in TradingView to receive real-time notifications when the conditions you’ve defined are met, allowing you to react quickly to market opportunities without constantly monitoring charts.
Monitor with the panel: Signal Builder includes a visual panel that shows active conditions for each indicator in real time, helping you keep track of signals without manually checking each indicator.
🔵 3Commas integration:
In addition to being a valuable tool for any trader, Signal Builder is optimized to work seamlessly with 3Commas bots through Webhooks. This allows you to automate your trades based on the signals you’ve configured, ensuring that no opportunity is missed when your defined conditions are met. If you prefer automation, Signal Builder can send buy or sell signals to your 3Commas bots, enhancing your trading process and helping you manage multiple trades more efficiently.
🔵 Example of use:
Imagine you trade in volatile markets and want to trigger a sell signal when:
Stochastic Oscillator indicates overbought conditions with the %K value crossing below 80.
Bollinger Bands %B shows the price has surpassed the upper band, suggesting a potential reversal.
ADX is below 20, indicating that the trend is weak and could be about to change.
With Signal Builder , you can configure these conditions to trigger a sell signal only when all are met simultaneously. Then, you can set up a TradingView alert to notify you as soon as the signal is activated, giving you the opportunity to react quickly and adjust your strategy accordingly.
👨🏻💻💭 If this tool helps your trading strategy, don’t forget to give it a boost! Feel free to share in the comments how you're using it or if you have any questions.
_________________________________________________________________
The information and publications within the 3Commas TradingView account are not meant to be and do not constitute financial, investment, trading, or other types of advice or recommendations supplied or endorsed by 3Commas and any of the parties acting on behalf of 3Commas, including its employees, contractors, ambassadors, etc.

Stochastics Confluences 4 in 1Description of the Pine Script:
This script plots the Full Stochastic indicator for four different time periods, and highlights conditions where potential buy or sell signals can be identified. The Stochastic indicator measures the position of the current closing price relative to the range of high and low prices over a defined period, helping traders identify overbought and oversold conditions.
Key Features:
Stochastic Calculation for 4 Different Periods:
The script calculates the Stochastic for four separate lookback periods: 9, 14, 40, and 60 bars.
Each Stochastic value is smoothed by a Simple Moving Average (SMA) to reduce noise and provide a clearer signal.
Visual Representation:
It plots each Stochastic value on the chart using different colors, allowing the user to see how the different periods of the indicator behave relative to each other.
Horizontal lines are drawn at 80 (Upper Bound) and 20 (Lower Bound), commonly used to identify overbought and oversold regions.
Highlighting Buy and Sell Conditions:
Green Highlight (Potential Buy Signal):
When all four Stochastic values (for the four different periods) are below 20, this suggests that the asset is in an oversold condition across multiple timeframes. The green background highlight appears when the Stochastic lines converge below 20, indicating a potential buy signal, as the price may be preparing to move upward from an oversold state.
Red Highlight (Potential Sell Signal):
When all four Stochastic values are above 80, the asset is in an overbought condition across multiple timeframes. The red background highlight appears when the Stochastic lines converge above 80, indicating a potential sell signal, as the price may soon reverse downward from an overbought state.
How to Interpret the Signals:
Buy Signals (Green Highlight):
When the chart is highlighted in green, it means the Stochastic indicators for all four periods are below 20, signaling that the asset is oversold and may be nearing a potential upward reversal. This condition suggests a possible buying opportunity, especially when other indicators confirm the potential for an upward trend.
Sell Signals (Red Highlight):
When the chart is highlighted in red, it indicates that the Stochastic indicators for all four periods are above 80, meaning the asset is overbought. This condition signals a possible downward reversal, suggesting a potential selling opportunity if the price begins to show signs of weakness.
By using this script, traders can visually identify periods of strong confluence across different timeframes when the Stochastic indicators are in extreme oversold or overbought conditions, which are traditionally seen as strong buy or sell signals.
This approach helps filter out weaker signals and focuses on moments when all timeframes align, increasing the probability of a successful trade.

M & W Checklistindicator to Validate & Grade M & W Patterns.
Indicator Inputs
Table Color Palette
• Position Valid : Positions the Valid Trade table on the chart.
• Position Grade : Positions the Grade table on the chart, hover over the Column 1 Row 1 for a description of the bands.
• Size: Text size for all tables.
• Text Color : Sets text color.
• Border Color : Sets the table border color for all tables.
• Background Color : Sets table backgroud color for all tables.
Valid Trade Table
Checkboxes to indicate if the trade is valid. Fail is displayed if unchecked, Pass if checked.
Grade Table
• S/R Level 1: distance between neckline and 1st resistance area in % of the total distance between neckline and take profit. This is not for road blocks but pivot points etc before the initial run up/down in price. I have this set to 30% , this means that if there is a pivot point between the neckline and 30% of the TP level I weight it negatively.
• S/R Level 2: distance between neckline and 1st resistance area in % of the total distance between neckline and take profit. This is not for road blocks but pivot points etc before the initial run up/down in price. I have this set to 50% , this means that if there is a pivot point between the neckline and 50% of the TP level 2 weight it negatively but less so than level 1.
• S/R Level 3: distance between neckline and 1st resistance area in % of the total distance between neckline and take profit. This is not for road blocks but pivot points etc before the initial run up/down in price. I have this set to 70% , this means that if there is a pivot point between the neckline and 70% of the TP level 3 weight it negatively but less so than level 1 & level 2.
• Checkboxes are self explanatory, they are binary options, all are weighted negatively if checked and are weighted positively if unchecked. Divergence values for weighting are neutral if unckecked & weighted positively if checked.
• The select options are neutral weighting if set to neutral , if set to For its weighted positive and set to Against weighted negatively.
Technical Specification of the Scoring and Band System
Overview
The scoring system is designed to evaluate a set of technical trade conditions, assigning weights to various criteria that influence the quality of the trade. The system calculates a total score based on both positive and negative conditions. Based on the final score, the system assigns a grade or band (A, B, or C) for positive scores, and a "Negative" label for negative scores.
Scoring System
The system calculates the score by evaluating a set of 12 conditions (gradeCondition1 to gradeCondition12). These conditions are manually input by the user via checkboxes or dropdowns in a technical indicator (written in Pine Script for TradingView). The score weights vary according to the relative importance of each condition.
Condition Breakdown and Weighting:
1. Divergences (GradeCondition1 & GradeCondition2):
◦ 1H Divergence: +5 points if condition is true.
◦ 4H Divergence: +10 points if condition is true (stronger weight than 1H).
2. Support/Resistance at Neckline (GradeCondition3):
◦ Negative if present: -15 points if true (carries significant negative weight).
3. RB near Entry (GradeCondition4):
◦ Very Negative: -20 points if true (this is a critical negative condition).
4. RB can Manage (GradeCondition5):
◦ Slightly Negative: -5 points if true.
5. Institutional Value Zones (GradeCondition6 to GradeCondition8):
◦ For the trade: +5 points.
◦ Against the trade: -5 points.
◦ Neutral: 0 points.
6. S/R between Neckline & Targets (GradeCondition9 to GradeCondition11):
◦ Level 1: -10 points if true, +7 points if false.
◦ Level 2: -7 points if true, +7 points if false.
◦ Level 3: -5 points if true, +7 points if false.
◦ Use fib tool or Gann Box to measure any S/R levels setup according to your preferences.
7. News Timing (GradeCondition12):
◦ News within 3 hours: -20 points if true (strong negative factor).
◦ No upcoming news: +10 points if false.
Scoring Calculation Formula:
totalScore = score1 + score2 + score3 + score4 + score5 + score6 + score7 + score8 + score9 + score10 + score11 + score12
Where:
• score1 to score12 represent the points derived from the conditions described above.
Coloring and Visual Feedback:
• Positive Scores: Displayed in green.
• Negative Scores: Displayed in red.
Band System
The Band System classifies the total score into different grades, depending on the final value of totalScore. This classification provides an intuitive ranking for trades, helping users quickly assess trade quality.
Band Classification:
• Band A: If the totalScore is 41 or more.
◦ Represents a highly favorable trade setup.
• Band B: If the totalScore is between 21 and 40.
◦ Represents a favorable trade setup with good potential.
• Band C: If the totalScore is between 1 and 20.
◦ Represents a trade setup that is acceptable but may have risks.
• Negative: If the totalScore is 0 or less.
◦ Represents a poor trade setup with significant risks or unfavorable conditions.
Band Calculation Logic (in Pine Script):
var string grade = ""
if (totalScore >= 41)
grade := "Band A"
else if (totalScore >= 21)
grade := "Band B"
else if (totalScore >= 1)
grade := "Band C"
else
grade := "Negative"
Technical Key Points:
• Highly Negative Conditions:
◦ The system penalizes certain conditions more heavily, especially those that suggest significant risks (e.g., News in less than 3 hours, RB near Entry).
• Positive Trade Conditions:
◦ Divergences, Institutional Value Zones in favor of the trade, and lack of significant nearby resistance all contribute positively to the score.
• Flexible System:
◦ The system can be adapted or fine-tuned by adjusting the weights of individual conditions according to trading preferences.
Use Case Example:
• If a trade has 1H and 4H Divergence, RB near Entry (negative), and no upcoming news:
◦ 1H Divergence: +5 points.
◦ 4H Divergence: +10 points.
◦ RB near Entry: -20 points.
◦ No news: +10 points.
◦ Total Score: 5 + 10 - 20 + 10 = 5 → Band C.
This modular and flexible scoring system allows traders to systematically evaluate trades and quickly gauge the trade's potential based on technical indicators
Summary:
Maximum Score: 61
Minimum Score: -97
These are the bounds of the score range based on the current logic of the script.

Aurous - Horizontal Rays Define Pip Size:
Since 1 pip for XAUUSD is usually considered as 0.1, the pip Size is set to 0.1. A 50-pip interval is therefore 50 * 0.1 = 5.0.
Nearest Pip Level Calculation:
We find the nearest 50-pip level based on the current price of XAUUSD. The formula nearestPipLevel = round(close / pipInterval) * pipInterval rounds the current price to the nearest multiple of the 50-pip interval.
Loop for Multiple Lines:
We use a loop that runs from -20 to 20 to plot horizontal ray lines 50 pips above and below the current price. The range (-20 to 20) ensures there are enough lines plotted both above and below the price.
Horizontal Ray Lines:
The line.new function is used to draw the horizontal rays, extending to the right.
Plot Current Price:
We also plot the closing price with a blue line to make it easier to track the price against the horizontal rays.

HMA Smoothed RSI [Pinescriptlabs]This indicator uses a modified version of the RSI (Relative Strength Index) weighted by volume. This means it not only takes into account the price but also the amount of volume supporting those price movements, making the indicator more sensitive to real market fluctuations.
Hull Moving Average (HMA) Applied to RSI: To smooth the volume-weighted RSI, a Hull Moving Average (HMA) is applied. The HMA is known for its ability to reduce market "noise" and quickly react to trend changes. This process helps better identify when an asset is overbought or oversold.
Overbought and Oversold Regions: The indicator sets clear overbought and oversold levels, which are adjustable. By default, the overbought level is set at 20 and the oversold level at -20, but you can customize these values. Additionally, there are extreme overbought and oversold levels to help identify more extreme market conditions where a price reversal is more likely.
Buy and Sell Signals:
Buy Signal: This is generated when the modified RSI crosses above the oversold level. This indicates that the price has dropped enough and may be about to rise.
Sell Signal: This occurs when the RSI crosses below the overbought level. This suggests that the price has risen too much and could be about to fall.
Dynamic Visualization and Colors: The indicator is displayed with different colors based on its behavior:
When the RSI is within normal levels, the color is neutral.
If it is above the overbought level, the color turns red (sell alert).
If it is below the oversold level, the color turns green (buy alert).
Alerts: This indicator also allows you to set up alerts. You will receive automatic notifications when buy or sell signals are generated, helping you make decisions without constantly monitoring the chart.
Español:
Este indicador utiliza una versión modificada del RSI (Índice de Fuerza Relativa), ponderado por volumen. Esto significa que no solo tiene en cuenta el precio, sino también la cantidad de volumen que respalda esos movimientos de precios, haciendo que el indicador sea más sensible a las fluctuaciones reales del mercado.
Media Móvil Hull (HMA) aplicada al RSI: Para suavizar el RSI ponderado por volumen, se le aplica una Media Móvil Hull (HMA). La HMA es conocida por su capacidad para reducir el "ruido" del mercado y reaccionar rápidamente a los cambios de tendencia. Este proceso ayuda a identificar mejor cuándo un activo está sobrecomprado o sobrevendido.
Regiones de sobrecompra y sobreventa: El indicador establece niveles claros de sobrecompra y sobreventa que son ajustables. Por defecto, el nivel de sobrecompra está en 20 y el de sobreventa en -20, pero puedes personalizar estos valores. Además, hay niveles extremos de sobrecompra y sobreventa que te ayudan a identificar condiciones más extremas del mercado, donde una reversión de precio es más probable.
Señales de compra y venta:
Señal de compra: Se genera cuando el RSI modificado cruza hacia arriba el nivel de sobreventa. Esto indica que el precio ha bajado lo suficiente y puede estar a punto de subir.
Señal de venta: Se produce cuando el RSI cruza hacia abajo el nivel de sobrecompra. Esto indica que el precio ha subido demasiado y podría estar a punto de bajar.
Visualización y colores dinámicos: El indicador se muestra con diferentes colores según su comportamiento:
Cuando el RSI está dentro de los niveles normales, el color es neutro.
Si está por encima del nivel de sobrecompra, el color se vuelve rojo (señal de alerta de venta).
Si está por debajo del nivel de sobreventa, el color se vuelve verde (señal de alerta de compra).
Alertas: Este indicador también te permite configurar alertas. Así, recibirás notificaciones automáticas cuando se generen señales de compra o venta, ayudándote a tomar decisiones sin estar constantemente monitoreando el gráfico.

Uptrick: Logarithmic Crypto Bands
Description :
Introduction
The `Uptrick: Logarithmic Crypto Bands` indicator introduces an innovative approach to technical analysis tailored specifically for the cryptocurrency markets. By leveraging logarithmic transformations combined with dynamic exponential bands, this indicator offers a sophisticated method for identifying critical support and resistance levels, assessing market trends, and evaluating volatility. Its unique approach stands out from traditional indicators by addressing the specific challenges of high volatility and erratic price movements inherent in cryptocurrency trading.
Originality and Usefulness
** 1. Unique Logarithmic Transformation: **
- Innovation : Unlike traditional indicators that often use raw price data, the Uptrick: Logarithmic Crypto Bands applies a logarithmic transformation to the closing prices: logPrice = math.log(close). This approach is original because it reduces the impact of extreme price fluctuations, providing a smoother and more stable price series. This transformation addresses a common issue in cryptocurrency markets where large price swings can obscure true market trends.
- Advantage : The logarithmic transformation compresses the price range, which allows traders to better identify long-term trends and reduce the noise caused by outlier price movements. This results in a more reliable basis for analysis and enhances the ability to detect meaningful market patterns.
**2. Dynamic Exponential Bands :**
- Innovation : The indicator employs exponential calculations to derive dynamic support and resistance levels based on a central base line : baseLine * math.pow(multiplier, n). Unlike static bands that remain fixed regardless of market conditions, these bands adjust dynamically according to market volatility.
- Advantage : The dynamic nature of the bands provides a more responsive and adaptive tool for traders. As market volatility changes, the bands widen or narrow accordingly, offering a more accurate reflection of potential support and resistance levels. This adaptability improves the tool's effectiveness in varying market conditions compared to static or traditional bands.
Detailed Description and Substantiation
**1. Logarithmic Price Calculation :**
- Code : ` logPrice = math.log(close)
- Description : This calculation converts the closing price into its logarithmic value. By compressing the price range, it minimizes the distortion caused by extreme price movements, which can be particularly pronounced in the volatile cryptocurrency markets.
- Purpose : To provide a stabilized price series that facilitates more accurate trend analysis and reduces the influence of erratic price fluctuations.
**2. Moving Averages of Logarithmic Prices :**
- ** Long-Term Moving Average :**
- Code : maLongLogPrice = ta.sma(logPrice, longLength)
longLength = 2000
- ** Description : A simple moving average of the logarithmic price over a long period. This average helps filter out short-term noise and provides insight into the long-term market trend.
- Purpose : To offer a perspective on the overall market direction, making it easier to identify enduring trends and distinguish them from short-term price movements.
- Short-Term Moving Average :
- Code : maShortLogPrice = ta.sma(logPrice, shortLength) shortLength = 900
- Description : A simple moving average of the logarithmic price over a shorter period. This component captures more immediate price trends and potential reversal points.
- Purpose : To detect short-term trends and changes in market direction, allowing traders to make timely trading decisions based on recent price action.
**3. Base Line Calculation :**
- Code : baseLine = math.exp(maShortLogPrice)
- Description : Converts the short-term moving average of the logarithmic price back to the original price scale. This base line serves as the central reference point for calculating the surrounding bands.
- Purpose : To establish a benchmark level from which the exponential bands are calculated, providing a central reference for assessing potential support and resistance levels.
**4. Band Calculation and Plotting :**
- ** Code :**
- Band 1: plot(baseLine * math.pow(multiplier, 1), color=color.new(color.yellow, 20), linewidth=1, title="Band 1")
- Band 2: plot(baseLine * math.pow(multiplier, 2), color=color.new(color.yellow, 20), linewidth=1, title="Band 2")
- Band 3: plot(baseLine * math.pow(multiplier, 3), color=color.new(color.yellow, 20), linewidth=1, title="Band 3")
- Band 4: plot(baseLine * math.pow(multiplier, 4), color=color.new(color.yellow, 20), linewidth=1, title="Band 4")
- Band 5: plot(baseLine * math.pow(multiplier, 5), color=color.new(color.yellow, 10), linewidth=1, title="Band 5")
- Band 6: plot(baseLine * math.pow(multiplier, 6), color=color.new(color.yellow, 0), linewidth=1, title="Band 6")
- * Multiplier : Set at 1.3, adjusts the spacing between bands to accommodate varying levels of market volatility.
- Description : Bands are plotted at exponential intervals from the base line. Each band represents a potential support or resistance level, with the spacing between them increasing exponentially. The color opacity of each band indicates its level of significance, with closer bands being more relevant for immediate trading decisions.
** How to Use the Indicator :**
**1. Identifying Support and Resistance Levels :**
- Support Levels : The lower bands, closer to the base line, can act as potential support levels. When the price approaches these bands from above, they may indicate areas where the price could stabilize or reverse direction.
- Resistance Levels : The upper bands, further from the base line, serve as resistance levels. When the price nears these bands from below, they can act as barriers to price movement, potentially leading to reversals or stalls.
**2. Confirming Trends :**
- Uptrend Confirmation : When the price consistently remains above the base line and moves towards higher bands, it signals a strong bullish trend. This confirmation helps traders capitalize on upward price movements.
- Downtrend Confirmation : When the price stays below the base line and approaches lower bands, it indicates a bearish trend. This confirmation assists traders in acting on downward price movements.
3. Analyzing Volatility :
- Wide Bands : Wider spacing between bands reflects higher market volatility. This indicates a more turbulent trading environment, where price movements are less predictable. Traders may need to adjust their strategies to handle increased volatility.
- Narrow Bands : Narrower bands suggest lower volatility and a more stable market environment. This can result in more predictable price movements and clearer trading signals.
**4. Entry and Exit Points :**
- Entry Points : Consider buying when the price bounces off the base line or a band, which could signal support in an uptrend.
- Exit Points : Evaluate selling or taking profits when the price nears upper bands or shows signs of reversal at these levels. This approach helps in locking in gains or minimizing losses during a downtrend.
**Chart Example:**
Here you can see how the price reacted getting closer to this level. All green circles show a bounce-off. So just from looking at the chart we can see a potential bounce again pretty soon.
** Disclosure :**
- ** Performance Claims :** The `Uptrick: Logarithmic Crypto Bands` indicator is designed to assist traders in analyzing price levels and trends. It is important to understand that this tool provides historical data analysis and does not guarantee future performance. The features and benefits described are based on historical market behavior and should not be seen as a prediction of future results. Traders should use this indicator as part of a broader trading strategy and consider other factors before making trading decisions.

EMA Crossover Buy/Sell IndicatorScript Overview
This script is a trading indicator designed to identify potential buy and sell signals based on the crossover of two Exponential Moving Averages (EMAs):
Indicator Title and Setup:
The script is named "EMA Crossover Buy/Sell Indicator" and is plotted directly on the price chart.
EMAs Calculation:
It calculates two EMAs: a 20-period EMA and a 50-period EMA. These are used to analyze the market trends over different time frames.
Plotting EMAs:
The 20-period EMA is shown on the chart in blue.
The 50-period EMA is shown in orange.
These lines help visualize the current trend and potential points of interest where the moving averages intersect.
Generating Signals:
A buy signal is triggered when the 20-period EMA crosses above the 50-period EMA.
A sell signal is triggered when the 20-period EMA crosses below the 50-period EMA.
These signals suggest potential buying or selling opportunities based on the crossover of the EMAs.
Displaying Signals:
Buy signals are marked with green labels below the bars on the chart.
Sell signals are marked with red labels above the bars on the chart.
This visual representation helps traders quickly identify potential trading opportunities.
Alerts:
Alerts are set up to notify the trader when a buy or sell signal occurs.
The alert messages specify whether the signal is a buying opportunity or a selling opportunity based on the EMA crossovers.

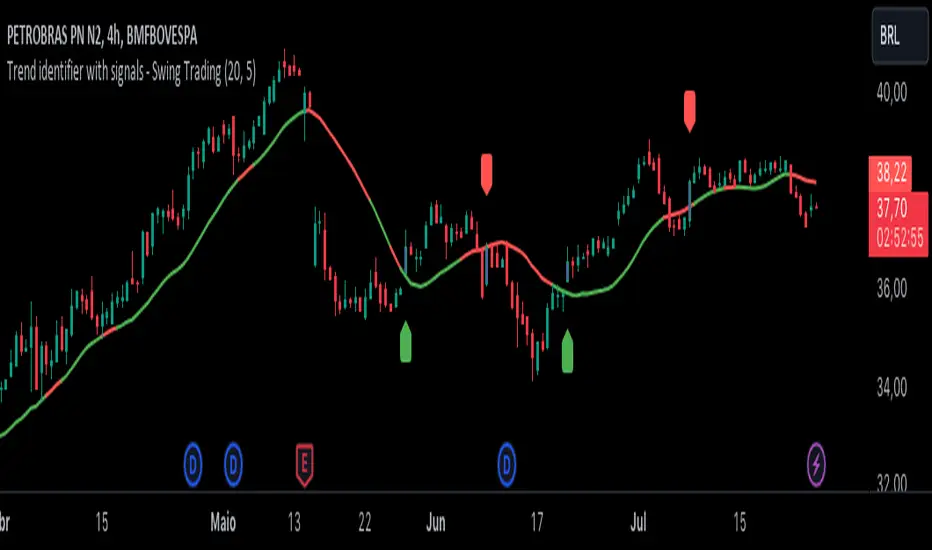
Trend identifier with signals - Swing TradingIndicator Objective
The "Trend identifier with signals - Swing Trading" indicator is designed to help traders identify market trends and provide clear visual signals for potential buy and sell points based on the interaction of price with the 20-period moving average.
How the Indicator Works
20-Period Moving Average:
The indicator calculates the 20-period simple moving average (SMA), which is a common tool for smoothing out price fluctuations and identifying the overall market direction.
The moving average is plotted on the chart, changing color according to the identified trend:
Green: Indicates an uptrend.
Red: Indicates a downtrend.
Gray: Indicates a neutral or undefined market condition.
Trend Identification on the Daily Chart:
The indicator checks the trend based on an adjustable period (default is 5 periods):
Uptrend: When the short-term moving average (5 periods) is above the long-term moving average (10 periods).
Downtrend: When the short-term moving average (5 periods) is below the long-term moving average (10 periods).
Signal for Touching the Moving Average:
When the price crosses the 20-period moving average, the candles are colored purple to indicate that there was a touch on the moving average.
This helps identify critical points where the price may reverse or continue its trend.
Trend Signal:
Green Flag: Appears below the candle when there is a touch on the moving average and the trend is up, suggesting a potential buy point.
Red Flag: Appears above the candle when there is a touch on the moving average and the trend is down, suggesting a potential sell point.
Lateral Zone Identification:
The indicator also checks if the price touched the moving average for 5 consecutive candles, indicating a possible consolidation or lateral zone.
If this occurs, a message "Possible Lateral Zone" is shown on the chart, helping the trader avoid trades in a market without a clear direction.
How the Indicator Helps Traders
Clear Trend Identification:
By changing the color of the moving average according to the trend (green for up, red for down), the indicator provides a clear visualization of market direction.
This allows traders to align their trades with the prevailing trend, increasing the probability of success.
Visual Buy and Sell Signals:
The green and red flags provide direct visual signals for potential entry and exit points, based on the interaction of price with the moving average.
This is particularly useful for novice traders who may struggle to identify these points on their own.
Risk Management and Trade Planning:
Identifying lateral zones helps traders avoid trading in trendless markets, where price movements are more unpredictable.
This improves risk management and allows traders to focus on more favorable opportunities.
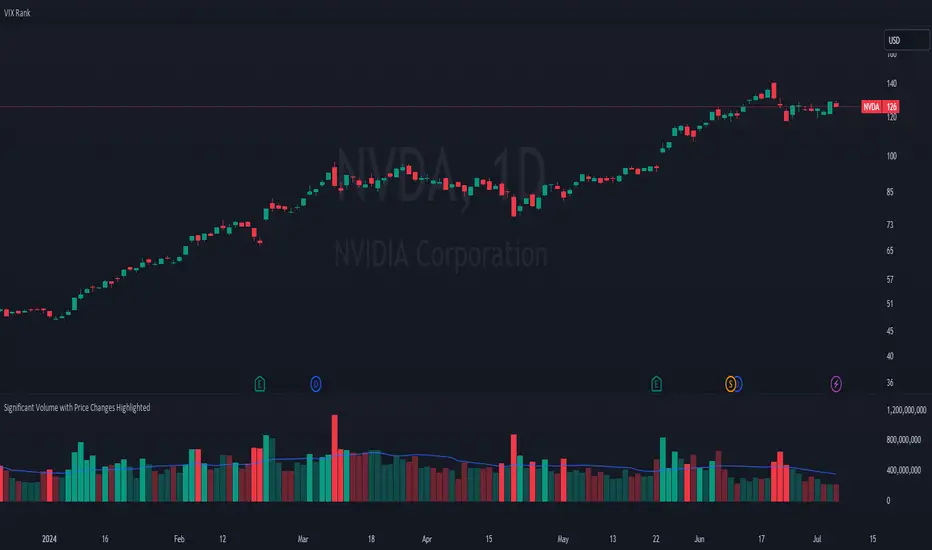
Significant Volume with Price Changes HighlightedSignificant Volume with Price Changes Highlighted
The "Significant Volume with Price Changes Highlighted" indicator by PappyTrading is a powerful tool designed to help traders identify significant volume spikes and price changes in the market. This indicator overlays the volume bars on the price chart and highlights them based on specific volume and price change conditions, providing a clear visual representation of market activity.
What It Does
This indicator calculates the moving average of the volume over a specified period and compares the current volume to this average. It also calculates the daily percentage change relative to the previous day's close and compares this to its moving average. The volume bars are then color-coded based on the following conditions:
Bright Green (#089981): Indicates a significant volume spike with an above-average price increase.
Bright Red (#f23645): Indicates a significant volume spike with an above-average price decrease.
Green with 60% transparency: Indicates a normal up day with a price increase but not a significant volume spike.
Red with 60% transparency: Indicates a normal down day with a price decrease but not a significant volume spike.
Additionally, the indicator plots a 20-period simple moving average (SMA) of the volume, providing a reference point to understand the general volume trend.
How It Works
Volume Calculation:
The indicator calculates the 20-period SMA of the volume and compares the current volume to this average to determine if there is a significant volume spike.
Price Change Calculation:
The indicator calculates the daily percentage change in price relative to the previous day's close and compares this to the 20-period SMA of the percentage change to identify significant price movements.
Color Coding:
The volume bars are color-coded based on the combination of the volume and price change conditions. This visual representation allows traders to quickly identify significant market activities.
How to Use It
Overlay on Chart:
Add the "Significant Volume with Price Changes Highlighted" indicator to your chart. The volume bars will be displayed at the bottom of the chart, color-coded based on the conditions described above.
Identify Market Activity:
Use the color-coded volume bars to identify significant market activities. Bright green bars indicate strong buying pressure, while bright red bars indicate strong selling pressure. Transparent green and red bars indicate normal market activity without significant volume spikes.
Volume Moving Average:
The blue line represents the 20-period SMA of the volume. Use this as a reference to understand the general volume trend and identify deviations from the average.
Concepts Underlying the Calculations
Volume Spikes: Significant volume spikes often precede or accompany major market moves. By highlighting these spikes, traders can gain insights into potential market turning points or continuation patterns.
Price Changes: Large price changes relative to the previous day's close indicate strong market momentum. By comparing these changes to their moving average, the indicator helps traders identify unusually strong buying or selling pressure.
This indicator is ideal for traders who want to gain a deeper understanding of market dynamics by analyzing volume and price changes together. It is suitable for various trading styles, including trend following, swing trading, and scalping.
Scalping System by Machine# Custom Trading System Indicator
This Pine Script indicator is designed to identify potential trading setups based on a specific set of rules. It's intended for use on lower timeframes (M1-M5) in the forex market, particularly during the New York-London overlap period.
## Key Features
1. **EMA Condition**: Uses a 20-period Exponential Moving Average (EMA) to determine trend direction.
2. **Candle Analysis**: Identifies strong bars and candle color changes.
3. **Volume Confirmation**: Checks for increasing volume.
4. **Volatility Filter**: Utilizes the Average True Range (ATR) to gauge market volatility.
5. **Time-based Filter**: Highlights the New York-London overlap period.
6. **Visual Aids**: Plots potential entry points, stop losses, and take profit levels.
## Trading Rules
1. **Buy Signal**:
- Price is above the 20 EMA
- Candle color changes from red to green
- Current candle is a strong bar (closing within 75% of its range)
- Volume is higher than the previous bar
- ATR(14) is above 4 pips OR it's during the NY-London overlap
2. **Sell Signal**:
- Price is below the 20 EMA
- Candle color changes from green to red
- Current candle is a strong bar (closing within 75% of its range)
- Volume is higher than the previous bar
- ATR(14) is above 4 pips OR it's during the NY-London overlap
3. **Stop Loss**: Placed near the low of the setup candle for buys, or near the high for sells.
4. **Take Profit**: Aimed at 1R (one times the range of the setup candle).
## Visual Elements
- **20 EMA**: Plotted as a blue line on the chart.
- **Buy Signals**: Green triangles below the candles.
- **Sell Signals**: Red triangles above the candles.
- **Stop Loss Levels**: Small red dots at the calculated stop loss prices.
- **Take Profit Levels**: Small green dots at the calculated take profit prices.
- **Information Table**: Displays current values for ATR, strong bar condition and volume condition.
## Usage Notes
1. This indicator is designed for manual trading, not automated execution.
2. It works best when combined with analysis of major trend lines, support, and resistance levels.
3. Exercise caution with very large setup candles.
4. Consider additional filters or money management rules for enhanced performance.
5. For higher timeframe bias validation, consider incorporating a 100-period break of structure (BOS) analysis.
## Customization
The indicator includes several input parameters that can be adjusted:
- EMA Length
- ATR Length and Threshold
- Volume Multiplier
- Strong Bar Percentage
Users can also toggle the visibility of stop loss and take profit markers.
Remember, while this indicator can identify potential setups, it should be used in conjunction with other forms of analysis and risk management strategies. Always consider the overall market context and your personal risk tolerance when making trading decisions.

RV - Relative Strength Index Buy/SellIntroduction
The RV - RSI B/S V1.2 indicator leverages the RSI to identify overbought and oversold conditions in the market. The RSI line color changes according to bullish, bearish, oversold, and overbought zones, helping users identify direction and avoid false trades. By plotting the RSI along with user-defined moving averages and Bollinger Bands, it offers a multi-faceted approach to analyzing market momentum.
Indicator Overview
The indicator RSI line color changes as per the bullish, bearish, oversold, and overbought zones. This helps users find out the direction and the zones. The oversold and overbought zones are colored to help users avoid false trades.
Trading Strategy
Long Trades (Bullish Setup):
Entry: A long trade is initiated when the RSI crosses from 60 up to 80.
Exit: Long trades are generally exited when the RSI is between 80 and 90.
Condition: No long trades are taken if the RSI exceeds 80.
Short Trades (Bearish Setup):
Entry: A short trade is initiated when the RSI crosses from 40 down to 20.
Exit: Short trades are generally exited when the RSI is between 20 and 10.
Condition: No short trades are taken if the RSI falls below 20.
RSI Color Coding and Interpretation
The RV - RSI B/S V1.2 indicator uses color coding to provide a visual representation of RSI values, making it easier to identify critical levels at a glance:
Green (RSI 60-80): Indicates a bullish zone where long trades can be considered.
Red (RSI > 80): Signals an overbought condition where long trades should be avoided.
Orange (RSI 20-40): Indicates a bearish zone where short trades can be considered.
Pink (RSI < 20): Signals an oversold condition where short trades should be avoided.
RSI Settings and Their Importance
RSI Length: The default length is set to 12, which is the standard period for RSI calculation. This setting can be adjusted to increase or decrease sensitivity.
Source: The source of the data for the RSI calculation is typically the closing price.
MA Type: Various moving averages can be applied to the RSI, including SMA, EMA, SMMA (RMA), WMA, and VWMA. Each type offers different smoothing properties and can be selected based on
trading preferences.
MA Length: The default length is set to 20, aligning with the RSI length for consistency.
Bollinger Bands: When using Bollinger Bands, the standard deviation multiplier is set to 2.0 by default, but it can be adjusted to suit different volatility conditions.
Disclaimer
This indicator provides valuable signals for potential trading opportunities based on RSI levels and moving averages. However, it is crucial to incorporate directional price action analysis to confirm signals and improve trading accuracy. The RV - RSI B/S V1.2 should be used as part of a broader trading strategy, considering other technical and fundamental factors.

HMA Crossover 1H with RSI, Stochastic RSI, and Trailing StopThe strategy script provided is a trading algorithm designed to help traders make informed buy and sell decisions based on certain technical indicators. Here’s a breakdown of what each part of the script does and how the strategy works:
Key Components:
Hull Moving Averages (HMA):
HMA 5: This is a Hull Moving Average calculated over 5 periods. HMAs are used to smooth out price data and identify trends more quickly than traditional moving averages.
HMA 20: This is another HMA but calculated over 20 periods, providing a broader view of the trend.
Relative Strength Index (RSI):
RSI 14: This is a momentum oscillator that measures the speed and change of price movements over a 14-period timeframe. It helps identify overbought or oversold conditions in the market.
Stochastic RSI:
%K: This is the main line of the Stochastic RSI, which combines the RSI and the Stochastic Oscillator to provide a more sensitive measure of overbought and oversold conditions. It is smoothed with a 3-period simple moving average.
Trading Signals:
Buy Signal:
Generated when the 5-period HMA crosses above the 20-period HMA, indicating a potential upward trend.
Additionally, the RSI must be below 45, suggesting that the market is not overbought.
The Stochastic RSI %K must also be below 39, confirming the oversold condition.
Sell Signal:
Generated when the 5-period HMA crosses below the 20-period HMA, indicating a potential downward trend.
The RSI must be above 60, suggesting that the market is not oversold.
The Stochastic RSI %K must also be above 63, confirming the overbought condition.
Trailing Stop Loss:
This feature helps protect profits by automatically selling the position if the price moves against the trade by 5%.
For sell positions, an additional trailing stop of 100 points is included.

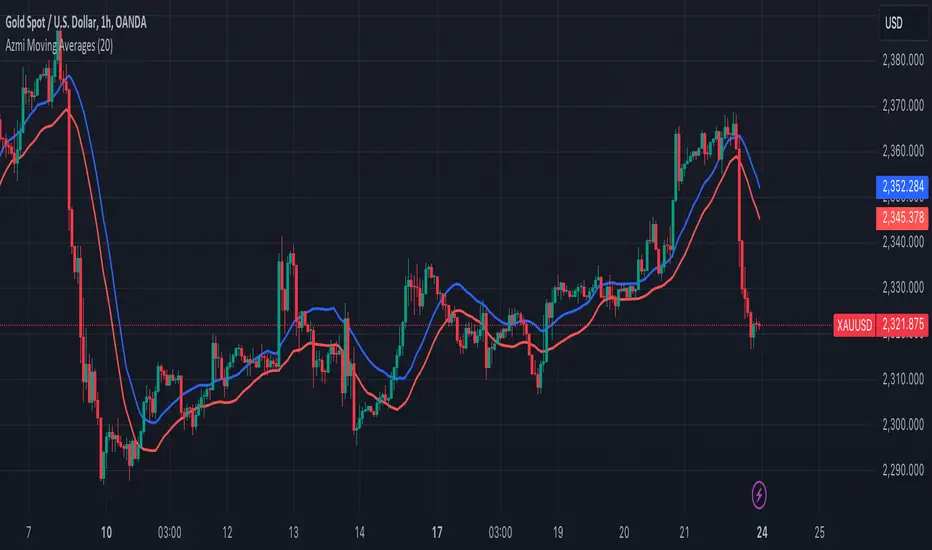
Azmi Moving AveragesThis trading indicator, designed using Pine Script, incorporates two simple moving averages (SMAs) with the same length but different data sources. Here's a detailed description of the indicator:
### Indicator Overview
**Name:** Two Moving Averages
### Inputs
1. **Length (20):** The period over which the moving averages are calculated. Both moving averages use a length of 20 periods.
2. **Source:**
- **High:** The first moving average is calculated using the high prices of the candles.
- **Low:** The second moving average is calculated using the low prices of the candles.
### Calculations
1. **MA High (maHigh):** This is the simple moving average of the high prices over the specified length (20 periods). It smooths the high prices over time, showing the average high price trend.
2. **MA Low (maLow):** This is the simple moving average of the low prices over the same length (20 periods). It smooths the low prices over time, showing the average low price trend.
### Plotting
- **MA High (Blue Line):** This line represents the moving average of the high prices. It is plotted in blue with a line width of 2.
- **MA Low (Red Line):** This line represents the moving average of the low prices. It is plotted in red with a line width of 2.
### Interpretation
1. **Trend Identification:**
- **Bullish Trend:** When the MA High is above the MA Low, it generally indicates a bullish trend, as the average high prices are higher than the average low prices.
- **Bearish Trend:** When the MA High is below the MA Low, it suggests a bearish trend, as the average high prices are lower than the average low prices.
2. **Support and Resistance:**
- The MA High can act as a dynamic resistance level, where the price may face selling pressure.
- The MA Low can act as a dynamic support level, where the price may find buying interest.
3. **Price Channels:**
- The area between the MA High and MA Low creates a channel that can help traders visualize the range within which the price is fluctuating. This channel can be used to identify potential breakout or breakdown points.
### Example Usage
- **Buy Signal:** A potential buy signal may occur when the price crosses above both the MA High and MA Low, indicating a possible upward trend.
- **Sell Signal:** A potential sell signal may occur when the price crosses below both the MA High and MA Low, indicating a possible downward trend.
This indicator provides a visual representation of the average high and low prices, helping traders identify trends, potential support and resistance levels, and price channels for better trading decisions.
Williams %R OB/OS Candle Coloring### Description for TradingView Publication
**Title:** Williams %R OB/OS Candle Coloring
**Description:**
This Pine Script indicator enhances the visibility of market conditions by changing the color of the candlesticks based on the Williams %R values. It helps traders quickly identify overbought and oversold conditions without the need to display the Williams %R line or any additional bands.
**How It Works:**
- The script calculates the Williams %R value using a specified lookback period (default is 14 days).
- It then compares the Williams %R value against predefined overbought and oversold levels.
- **Overbought Condition:** When the Williams %R value is greater than the upper band level (-20 by default), the candlestick color changes to blue.
- **Oversold Condition:** When the Williams %R value is less than the lower band level (-80 by default), the candlestick color changes to yellow.
**How to Use:**
1. **Input Parameters:**
- **Length:** The lookback period for calculating Williams %R (default is 14).
- **Upper Band Level:** The threshold for overbought conditions (default is -20).
- **Lower Band Level:** The threshold for oversold conditions (default is -80).
2. **Candlestick Coloring:**
- Blue candles indicate potential overbought conditions.
- Yellow candles indicate potential oversold conditions.
This indicator is designed to provide a visual cue directly on the price chart, making it easier for traders to spot extreme market conditions at a glance.
**Concepts Underlying the Calculation:**
Williams %R, developed by Larry Williams, is a momentum indicator that measures overbought and oversold levels. It compares the current closing price to the highest high and lowest low over a specified period. By using color-coded candles, traders can quickly assess market conditions and make informed decisions without the need to interpret an additional indicator line.
This script is particularly useful for traders who prefer a clean chart but still want to leverage the insights provided by the Williams %R indicator.
---
### ภาษาไทย:
**คำอธิบาย:**
สคริปต์ Pine Script ตัวนี้ช่วยเพิ่มการมองเห็นสภาวะตลาดโดยการเปลี่ยนสีของแท่งเทียนตามค่าของ Williams %R ช่วยให้เทรดเดอร์สามารถระบุสภาวะการซื้อเกินและขายเกินได้อย่างรวดเร็วโดยไม่ต้องแสดงเส้น Williams %R หรือเส้นระดับเพิ่มเติมใดๆ
**วิธีการทำงาน:**
- สคริปต์คำนวณค่าของ Williams %R โดยใช้ช่วงเวลาที่กำหนด (เริ่มต้นที่ 14 วัน)
- จากนั้นเปรียบเทียบค่าของ Williams %R กับระดับการซื้อเกินและขายเกินที่กำหนดไว้
- **สภาวะการซื้อเกิน:** เมื่อค่าของ Williams %R มากกว่าระดับ Upper Band (-20 เริ่มต้น) สีของแท่งเทียนจะเปลี่ยนเป็นสีน้ำเงิน
- **สภาวะการขายเกิน:** เมื่อค่าของ Williams %R น้อยกว่าระดับ Lower Band (-80 เริ่มต้น) สีของแท่งเทียนจะเปลี่ยนเป็นสีเหลือง
**วิธีการใช้งาน:**
1. **ค่าพารามิเตอร์:**
- **Length:** ช่วงเวลาที่ใช้คำนวณ Williams %R (เริ่มต้นที่ 14)
- **Upper Band Level:** ระดับการซื้อเกิน (เริ่มต้นที่ -20)
- **Lower Band Level:** ระดับการขายเกิน (เริ่มต้นที่ -80)
2. **การเปลี่ยนสีแท่งเทียน:**
- แท่งเทียนสีน้ำเงินระบุถึงสภาวะการซื้อเกิน
- แท่งเทียนสีเหลืองระบุถึงสภาวะการขายเกิน
อินดิเคเตอร์นี้ถูกออกแบบมาเพื่อให้สัญญาณภาพตรงบนกราฟราคาช่วยให้เทรดเดอร์สามารถมองเห็นสภาวะตลาดได้อย่างชัดเจนและทำการตัดสินใจได้ง่ายขึ้น
**แนวคิดที่อยู่เบื้องหลังการคำนวณ:**
Williams %R ที่พัฒนาโดย Larry Williams เป็นอินดิเคเตอร์โมเมนตัมที่วัดระดับการซื้อเกินและขายเกิน มันเปรียบเทียบราคาปิดปัจจุบันกับราคาสูงสุดและต่ำสุดในช่วงเวลาที่กำหนด โดยใช้แท่งเทียนที่มีการเปลี่ยนสี เทรดเดอร์สามารถประเมินสภาวะตลาดและทำการตัดสินใจได้อย่างรวดเร็วโดยไม่ต้องตีความเส้นอินดิเคเตอร์เพิ่มเติม
สคริปต์นี้มีประโยชน์โดยเฉพาะสำหรับเทรดเดอร์ที่ต้องการกราฟที่สะอาดแต่ยังต้องการใช้ข้อมูลเชิงลึกจากอินดิเคเตอร์ Williams %R

BEC (Bearish Elephant Candle)Description:
The Bearish Elephant Candle Indicator is designed to identify and signal potential short entry points based on the Bearish Elephant Candle pattern. This pattern is characterized by a large bearish candle, where the body (difference between open and close) is more than 70% of the entire range (difference between high and low), and the total range is greater than the average true range over a specified period. The indicator also plots a 20-period Exponential Moving Average (EMA) to help visualize the trend.
How It Works:
Bearish Elephant Candle Identification:
The indicator calculates the true range and the average true range (ATR) over a specified period (default is 20 periods).
A candle is identified as a Bearish Elephant Candle if the body is more than 70% of the entire range, and the total range exceeds the average true range.
Short Entry Signal:
When a Bearish Elephant Candle is identified, a short entry signal is plotted on the chart as a red downward label.
Exponential Moving Average (EMA):
A 20-period EMA is plotted on the chart to help users visualize the overall trend. The EMA can serve as an additional filter or exit point for trades.
Pros:
Simplicity: The Bearish Elephant Candle pattern is straightforward to understand and identify.
Visual Signals: The indicator provides clear visual signals for potential short entries, making it easy for traders to spot opportunities.
Trend Visualization: The inclusion of the EMA helps traders stay aligned with the overall trend, potentially improving the effectiveness of the signals.
Cons:
False Signals: Like any pattern-based indicator, it can generate false signals, especially in choppy or sideways markets.
No Confirmation: This version of the indicator does not include additional confirmation signals (e.g., from other indicators like MACD), which may reduce its reliability.
Limited Scope: The indicator focuses solely on bearish signals and does not provide long entry signals.
Best Way to Use It:
Trend Alignment: Use the 20-period EMA to ensure you are trading in the direction of the overall trend. For example, prioritize short signals when the price is below the EMA.
Combine with Other Indicators: Enhance the reliability of the signals by combining this indicator with other technical indicators (e.g., MACD, RSI) for additional confirmation.
Risk Management: Always use proper risk management techniques, such as stop-loss orders, to protect against adverse market movements. Consider placing stop-loss orders above the high of the Bearish Elephant Candle.
Market Context: Be mindful of the broader market context and avoid using the indicator in highly volatile or news-driven environments where patterns may be less reliable.

Uptrick: Trend Analysis 1 Trend Identification:
• The indicator primarily aims to identify trends in the market. It does this by computing two EMAs (fast and slow) and deriving the MACD line, which is the difference between these two EMAs. The MACD line is a momentum indicator that shows the relationship between two moving averages. When the MACD line is above the signal line, it suggests bullish momentum, while below indicates bearish momentum.
2 Entry and Exit Signals:
• The indicator generates potential entry and exit signals based on several conditions:
• Price vs. 20-period EMA: It checks whether the price is above or below the 20-period Exponential Moving Average. This is a common technique used to determine the overall direction of the trend. If the price is above the 20-period EMA, it suggests a bullish trend, and if it's below, it indicates a bearish trend.
• MACD Slope: It calculates the slope of the MACD line over a specified number of bars. A positive slope suggests increasing bullish momentum, while a negative slope indicates increasing bearish momentum.
• Signal Line Crossings: Traders often look for crossovers between the MACD line and the signal line as potential buy or sell signals. When the MACD line crosses above the signal line, it's considered a bullish signal (buy), and when it crosses below, it's seen as a bearish signal (sell).
3 Visual Representation:
• The indicator provides a visual representation of these conditions by plotting the MACD line with different colors depending on the market conditions (bullish, bearish, or neutral). Additionally, it draws vertical lines at the start of negative MACD slopes to highlight potential shifts in momentum.
4 Volume Analysis:
• It incorporates volume analysis by coloring the volume histogram differently based on whether the price is above or below the 20-period EMA. This can provide additional confirmation of trend strength. Higher volumes during price movements above the EMA may confirm bullish trends, while higher volumes during price movements below the EMA may confirm bearish trends.
5 Customization:
• Traders can customize the input parameters such as the fast and slow EMA periods according to their trading strategies and the specific market they're analyzing.

Bitcoin Momentum StrategyThis is a very simple long-only strategy I've used since December 2022 to manage my Bitcoin position.
I'm sharing it as an open-source script for other traders to learn from the code and adapt it to their liking if they find the system concept interesting.
General Overview
Always do your own research and backtesting - this script is not intended to be traded blindly (no script should be) and I've done limited testing on other markets beyond Ethereum and BTC, it's just a template to tweak and play with and make into one's own.
The results shown in the strategy tester are from Bitcoin's inception so as to get a large sample size of trades, and potential returns have diminished significantly as BTC has grown to become a mega cap asset, but the script includes a date filter for backtesting and it has still performed solidly in recent years (speaking from personal experience using it myself - DYOR with the date filter).
The main advantage of this system in my opinion is in limiting the max drawdown significantly versus buy & hodl. Theoretically much better returns can be made by just holding, but that's also a good way to lose 70%+ of your capital in the inevitable bear markets (also speaking from experience).
In saying all of that, the future is fundamentally unknowable and past results in no way guarantee future performance.
System Concept:
Capture as much Bitcoin upside volatility as possible while side-stepping downside volatility as quickly as possible.
The system uses a simple but clever momentum-style trailing stop technique I learned from one of my trading mentors who uses this approach on momentum/trend-following stock market systems.
Basically, the system "ratchets" up the stop-loss to be much tighter during high bearish volatility to protect open profits from downside moves, but loosens the stop loss during sustained bullish momentum to let the position ride.
It is invested most of the time, unless BTC is trading below its 20-week EMA in which case it stays in cash/USDT to avoid holding through bear markets. It only trades one position (no pyramiding) and does not trade short, but can easily be tweaked to do whatever you like if you know what you're doing in Pine.
Default parameters:
HTF: Weekly Chart
EMA: 20-Period
ATR: 5-period
Bar Lookback: 7
Entry Rule #1:
Bitcoin's current price must be trading above its higher-timeframe EMA (Weekly 20 EMA).
Entry Rule #2:
Bitcoin must not be in 'caution' condition (no large bearish volatility swings recently).
Enter at next bar's open if conditions are met and we are not already involved in a trade.
"Caution" Condition:
Defined as true if BTC's recent 7-bar swing high minus current bar's low is > 1.5x ATR, or Daily close < Daily 20-EMA.
Trailing Stop:
Stop is trailed 1 ATR from recent swing high, or 20% of ATR if in caution condition (ie. 0.2 ATR).
Exit on next bar open upon a close below stop loss.
I typically use a limit order to open & exit trades as close to the open price as possible to reduce slippage, but the strategy script uses market orders.
I've never had any issues getting filled on limit orders close to the market price with BTC on the Daily timeframe, but if the exchange has relatively low slippage I've found market orders work fine too without much impact on the results particularly since BTC has consistently remained above $20k and highly liquid.
Cost of Trading:
The script uses no leverage and a default total round-trip commission of 0.3% which is what I pay on my exchange based on their tier structure, but this can vary widely from exchange to exchange and higher commission fees will have a significantly negative impact on realized gains so make sure to always input the correct theoretical commission cost when backtesting any script.
Static slippage is difficult to estimate in the strategy tester given the wide range of prices & liquidity BTC has experienced over the years and it largely depends on position size, I set it to 150 points per buy or sell as BTC is currently very liquid on the exchange I trade and I use limit orders where possible to enter/exit positions as close as possible to the market's open price as it significantly limits my slippage.
But again, this can vary a lot from exchange to exchange (for better or worse) and if BTC volatility is high at the time of execution this can have a negative impact on slippage and therefore real performance, so make sure to adjust it according to your exchange's tendencies.
Tax considerations should also be made based on short-term trade frequency if crypto profits are treated as a CGT event in your region.
Summary:
A simple, but effective and fairly robust system that achieves the goals I set for it.
From my preliminary testing it appears it may also work on altcoins but it might need a bit of tweaking/loosening with the trailing stop distance as the default parameters are designed to work with Bitcoin which obviously behaves very differently to smaller cap assets.
Good luck out there!

Turtle Trading Strategy@lihexieThe full implementation of the Turtle Trading Rules (as distinct from the various truncated versions circulating within the community) is now ready.
This trading strategy script distinguishes itself from all currently publicly available Turtle trading systems on Tradingview by comprehensively embodying the rules for entries, exits, position management, and profit and loss controls.
Market Selection:
Trade in highly liquid markets such as forex, commodity futures, and stock index futures.
Entry Strategies:
Model 1: Buy when the price breaks above the highest point of the last 20 trading days; Sell when the price drops below the lowest point of the last 20 trading days. When an entry opportunity arises, if the previous trade was profitable, skip the current breakout opportunity and refrain from entering.
Model 2: Buy when the price breaks above the highest point of the last 55 trading days; Sell when the price drops below the lowest point of the last 55 trading days.
Position Sizing:
Determine the size of each position based on the price volatility (ATR) to ensure that the risk of each trade does not exceed 2% of the account balance.
Exit Strategies:
1. Use a fixed stop-loss point to limit losses: Close long positions when the price falls below the lowest point of the last 10 trading days.
2. Trailing stop-loss: Once a position is profitable, adjust the stop-loss point to protect profits.
Pyramiding Rules:
Unit Doubling: Increase position size by one unit every time the price moves forward by n (default is 0.5) units of ATR, up to a maximum of 4 units, while also raising the stop-loss point to below the ATR value at the level of additional entries.
海龟交易法则的完整实现(区别于当前社区各种有阉割海龟交易系统代码)
本策略脚本区别于Tradingview目前公开的所有的海龟交易系统,完整的实现了海龟交易法则中入场、出场、仓位管理,止盈止损的规则。
市场选择:
选择流动性高的市场进行交易,如外汇、商品期货和股指期货等。
入市策略:
模式1:当价格突破过去20个交易日的高点时,买入;当价格跌破过去20个交易日的低点时,卖出。当出现入场机会时,如果上一笔交易是盈利的,那么跳过当前突破的机会,不进行入场。
模式2:当价格突破过去55个交易日的高点时,买入;当价格跌破过去55个交易日的低点时,卖出。
头寸规模:
根据价格波动性(ATR)来确定每个头寸的大小, 使每笔交易的风险不超过账户余额的2%。
退出策略:
1. 使用一个固定的止损点来限制损失:当多头头寸的价格跌破过去10个交易日的低点时,平仓止损。
2. 跟踪止损:一旦头寸盈利,移动止损点以保护利润。
加仓规则:
单位加倍:每当价格向前n(默认是0.5)个单位的ATR移动时,就增加一个单位的头寸大小(默认最大头寸数量是4个),同时将止损点提升至加仓点位的ATR值以下。

ottlibLibrary "ottlib"
█ OVERVIEW
This library contains functions for the calculation of the OTT (Optimized Trend Tracker) and its variants, originally created by Anıl Özekşi (Anil_Ozeksi). Special thanks to him for the concept and to Kıvanç Özbilgiç (KivancOzbilgic) and dg_factor (dg_factor) for adapting them to Pine Script.
█ WHAT IS "OTT"
The OTT (Optimized Trend Tracker) is a highly customizable and very effective trend-following indicator that relies on moving averages and a trailing stop at its core. Moving averages help reduce noise by smoothing out sudden price movements in the markets, while trailing stops assist in detecting trend reversals with precision. Initially developed as a noise-free trailing stop, the current variants of OTT range from rapid trend reversal detection to long-term trend confirmation, thanks to its extensive customizability.
It's well-known variants are:
OTT (Optimized Trend Tracker).
TOTT (Twin OTT).
OTT Channels.
RISOTTO (RSI OTT).
SOTT (Stochastic OTT).
HOTT & LOTT (Highest & Lowest OTT)
ROTT (Relative OTT)
FT (Original name is Fırsatçı Trend in Turkish which translates to Opportunist Trend)
█ LIBRARY FEATURES
This library has been prepared in accordance with the style, coding, and annotation standards of Pine Script version 5. As a result, explanations and examples will appear when users hover over functions or enter function parameters in the editor.
█ USAGE
Usage of this library is very simple. Just import it to your script with the code below and use its functions.
import ismailcarlik/ottlib/1 as ottlib
█ FUNCTIONS
• f_vidya(source, length, cmoLength)
Short Definition: Chande's Variable Index Dynamic Average (VIDYA).
Details: This function computes Chande's Variable Index Dynamic Average (VIDYA), which serves as the original moving average for OTT. The 'length' parameter determines the number of bars used to calculate the average of the given source. Lower values result in less smoothing of prices, while higher values lead to greater smoothing. While primarily used internally in this library, it has been made available for users who wish to utilize it as a moving average or use in custom OTT implementations.
Parameters:
source (float) : (series float) Series of values to process.
length (simple int) : (simple int) Number of bars to lookback.
cmoLength (simple int) : (simple int) Number of bars to lookback for calculating CMO. Default value is `9`.
Returns: (float) Calculated average of `source` for `length` bars back.
Example:
vidyaValue = ottlib.f_vidya(source = close, length = 20)
plot(vidyaValue, color = color.blue)
• f_mostTrail(source, multiplier)
Short Definition: Calculates trailing stop value.
Details: This function calculates the trailing stop value for a given source and the percentage. The 'multiplier' parameter defines the percentage of the trailing stop. Lower values are beneficial for catching short-term reversals, while higher values aid in identifying long-term trends. Although only used once internally in this library, it has been made available for users who wish to utilize it as a traditional trailing stop or use in custom OTT implementations.
Parameters:
source (float) : (series int/float) Series of values to process.
multiplier (simple float) : (simple float) Percent of trailing stop.
Returns: (float) Calculated value of trailing stop.
Example:
emaValue = ta.ema(source = close, length = 14)
mostValue = ottlib.f_mostTrail(source = emaValue, multiplier = 2.0)
plot(mostValue, color = emaValue >= mostValue ? color.green : color.red)
• f_ottTrail(source, multiplier)
Short Definition: Calculates OTT-specific trailing stop value.
Details: This function calculates the trailing stop value for a given source in the manner used in OTT. Unlike a traditional trailing stop, this function modifies the traditional trailing stop value from two bars prior by adjusting it further with half the specified percentage. The 'multiplier' parameter defines the percentage of the trailing stop. Lower values are beneficial for catching short-term reversals, while higher values aid in identifying long-term trends. Although primarily used internally in this library, it has been made available for users who wish to utilize it as a trailing stop or use in custom OTT implementations.
Parameters:
source (float) : (series int/float) Series of values to process.
multiplier (simple float) : (simple float) Percent of trailing stop.
Returns: (float) Calculated value of OTT-specific trailing stop.
Example:
vidyaValue = ottlib.f_vidya(source = close, length = 20)
ottValue = ottlib.f_ottTrail(source = vidyaValue, multiplier = 1.5)
plot(ottValue, color = vidyaValue >= ottValue ? color.green : color.red)
• ott(source, length, multiplier)
Short Definition: Calculates OTT (Optimized Trend Tracker).
Details: The OTT consists of two lines. The first, known as the "Support Line", is the VIDYA of the given source. The second, called the "OTT Line", is the trailing stop based on the Support Line. The market is considered to be in an uptrend when the Support Line is above the OTT Line, and in a downtrend when it is below.
Parameters:
source (float) : (series float) Series of values to process. Default value is `close`.
length (simple int) : (simple int) Number of bars to lookback. Default value is `2`.
multiplier (simple float) : (simple float) Percent of trailing stop. Default value is `1.4`.
Returns: ( [ float, float ]) Tuple of `supportLine` and `ottLine`.
Example:
= ottlib.ott(source = close, length = 2, multiplier = 1.4)
longCondition = ta.crossover(supportLine, ottLine)
shortCondition = ta.crossunder(supportLine, ottLine)
• tott(source, length, multiplier, bandsMultiplier)
Short Definition: Calculates TOTT (Twin OTT).
Details: TOTT consists of three lines: the "Support Line," which is the VIDYA of the given source; the "Upper Line," a trailing stop of the Support Line adjusted with an added multiplier; and the "Lower Line," another trailing stop of the Support Line, adjusted with a reduced multiplier. The market is considered in an uptrend if the Support Line is above the Upper Line and in a downtrend if it is below the Lower Line.
Parameters:
source (float) : (series float) Series of values to process. Default value is `close`.
length (simple int) : (simple int) Number of bars to lookback. Default value is `40`.
multiplier (simple float) : (simple float) Percent of trailing stop. Default value is `0.6`.
bandsMultiplier (simple float) : Multiplier for bands. Default value is `0.0006`.
Returns: ( [ float, float, float ]) Tuple of `supportLine`, `upperLine` and `lowerLine`.
Example:
= ottlib.tott(source = close, length = 40, multiplier = 0.6, bandsMultiplier = 0.0006)
longCondition = ta.crossover(supportLine, upperLine)
shortCondition = ta.crossunder(supportLine, lowerLine)
• ott_channel(source, length, multiplier, ulMultiplier, llMultiplier)
Short Definition: Calculates OTT Channels.
Details: OTT Channels comprise nine lines. The central line, known as the "Mid Line," is the OTT of the given source's VIDYA. The remaining lines are positioned above and below the Mid Line, shifted by specified multipliers.
Parameters:
source (float) : (series float) Series of values to process. Default value is `close`
length (simple int) : (simple int) Number of bars to lookback. Default value is `2`
multiplier (simple float) : (simple float) Percent of trailing stop. Default value is `1.4`
ulMultiplier (simple float) : (simple float) Multiplier for upper line. Default value is `0.01`
llMultiplier (simple float) : (simple float) Multiplier for lower line. Default value is `0.01`
Returns: ( [ float, float, float, float, float, float, float, float, float ]) Tuple of `ul4`, `ul3`, `ul2`, `ul1`, `midLine`, `ll1`, `ll2`, `ll3`, `ll4`.
Example:
= ottlib.ott_channel(source = close, length = 2, multiplier = 1.4, ulMultiplier = 0.01, llMultiplier = 0.01)
• risotto(source, length, rsiLength, multiplier)
Short Definition: Calculates RISOTTO (RSI OTT).
Details: RISOTTO comprised of two lines: the "Support Line," which is the VIDYA of the given source's RSI value, calculated based on the length parameter, and the "RISOTTO Line," a trailing stop of the Support Line. The market is considered in an uptrend when the Support Line is above the RISOTTO Line, and in a downtrend if it is below.
Parameters:
source (float) : (series float) Series of values to process. Default value is `close`.
length (simple int) : (simple int) Number of bars to lookback. Default value is `50`.
rsiLength (simple int) : (simple int) Number of bars used for RSI calculation. Default value is `100`.
multiplier (simple float) : (simple float) Percent of trailing stop. Default value is `0.2`.
Returns: ( [ float, float ]) Tuple of `supportLine` and `risottoLine`.
Example:
= ottlib.risotto(source = close, length = 50, rsiLength = 100, multiplier = 0.2)
longCondition = ta.crossover(supportLine, risottoLine)
shortCondition = ta.crossunder(supportLine, risottoLine)
• sott(source, kLength, dLength, multiplier)
Short Definition: Calculates SOTT (Stochastic OTT).
Details: SOTT is comprised of two lines: the "Support Line," which is the VIDYA of the given source's Stochastic value, based on the %K and %D lengths, and the "SOTT Line," serving as the trailing stop of the Support Line. The market is considered in an uptrend when the Support Line is above the SOTT Line, and in a downtrend when it is below.
Parameters:
source (float) : (series float) Series of values to process. Default value is `close`.
kLength (simple int) : (simple int) Stochastic %K length. Default value is `500`.
dLength (simple int) : (simple int) Stochastic %D length. Default value is `200`.
multiplier (simple float) : (simple float) Percent of trailing stop. Default value is `0.5`.
Returns: ( [ float, float ]) Tuple of `supportLine` and `sottLine`.
Example:
= ottlib.sott(source = close, kLength = 500, dLength = 200, multiplier = 0.5)
longCondition = ta.crossover(supportLine, sottLine)
shortCondition = ta.crossunder(supportLine, sottLine)
• hottlott(length, multiplier)
Short Definition: Calculates HOTT & LOTT (Highest & Lowest OTT).
Details: HOTT & LOTT are composed of two lines: the "HOTT Line", which is the OTT of the highest price's VIDYA, and the "LOTT Line", the OTT of the lowest price's VIDYA. A high price surpassing the HOTT Line can be considered a long signal, while a low price dropping below the LOTT Line may indicate a short signal.
Parameters:
length (simple int) : (simple int) Number of bars to lookback. Default value is `20`.
multiplier (simple float) : (simple float) Percent of trailing stop. Default value is `0.6`.
Returns: ( [ float, float ]) Tuple of `hottLine` and `lottLine`.
Example:
= ottlib.hottlott(length = 20, multiplier = 0.6)
longCondition = ta.crossover(high, hottLine)
shortCondition = ta.crossunder(low, lottLine)
• rott(source, length, multiplier)
Short Definition: Calculates ROTT (Relative OTT).
Details: ROTT comprises two lines: the "Support Line", which is the VIDYA of the given source, and the "ROTT Line", the OTT of the Support Line's VIDYA. The market is considered in an uptrend if the Support Line is above the ROTT Line, and in a downtrend if it is below. ROTT is similar to OTT, but the key difference is that the ROTT Line is derived from the VIDYA of two bars of Support Line, not directly from it.
Parameters:
source (float) : (series float) Series of values to process. Default value is `close`.
length (simple int) : (simple int) Number of bars to lookback. Default value is `200`.
multiplier (simple float) : (simple float) Percent of trailing stop. Default value is `0.1`.
Returns: ( [ float, float ]) Tuple of `supportLine` and `rottLine`.
Example:
= ottlib.rott(source = close, length = 200, multiplier = 0.1)
isUpTrend = supportLine > rottLine
isDownTrend = supportLine < rottLine
• ft(source, length, majorMultiplier, minorMultiplier)
Short Definition: Calculates Fırsatçı Trend (Opportunist Trend).
Details: FT is comprised of two lines: the "Support Line", which is the VIDYA of the given source, and the "FT Line", a trailing stop of the Support Line calculated using both minor and major trend values. The market is considered in an uptrend when the Support Line is above the FT Line, and in a downtrend when it is below.
Parameters:
source (float) : (series float) Series of values to process. Default value is `close`.
length (simple int) : (simple int) Number of bars to lookback. Default value is `30`.
majorMultiplier (simple float) : (simple float) Percent of major trend. Default value is `3.6`.
minorMultiplier (simple float) : (simple float) Percent of minor trend. Default value is `1.8`.
Returns: ( [ float, float ]) Tuple of `supportLine` and `ftLine`.
Example:
= ottlib.ft(source = close, length = 30, majorMultiplier = 3.6, minorMultiplier = 1.8)
longCondition = ta.crossover(supportLine, ftLine)
shortCondition = ta.crossunder(supportLine, ftLine)
█ CUSTOM OTT CREATION
Users can create custom OTT implementations using f_ottTrail function in this library. The example code which uses EMA of 7 period as moving average and calculates OTT based of it is below.
Source Code:
//@version=5
indicator("Custom OTT", shorttitle = "COTT", overlay = true)
import ismailcarlik/ottlib/1 as ottlib
src = input.source(close, title = "Source")
length = input.int(7, title = "Length", minval = 1)
multiplier = input.float(2.0, title = "Multiplier", minval = 0.1)
support = ta.ema(source = src, length = length)
ott = ottlib.f_ottTrail(source = support, multiplier = multiplier)
pSupport = plot(support, title = "Moving Average Line (Support)", color = color.blue)
pOtt = plot(ott, title = "Custom OTT Line", color = color.orange)
fillColor = support >= ott ? color.new(color.green, 60) : color.new(color.red, 60)
fill(pSupport, pOtt, color = fillColor, title = "Direction")
Result:
█ DISCLAIMER
Trading is risky and most of the day traders lose money eventually. This library and its functions are only for educational purposes and should not be construed as financial advice. Past performances does not guarantee future results.
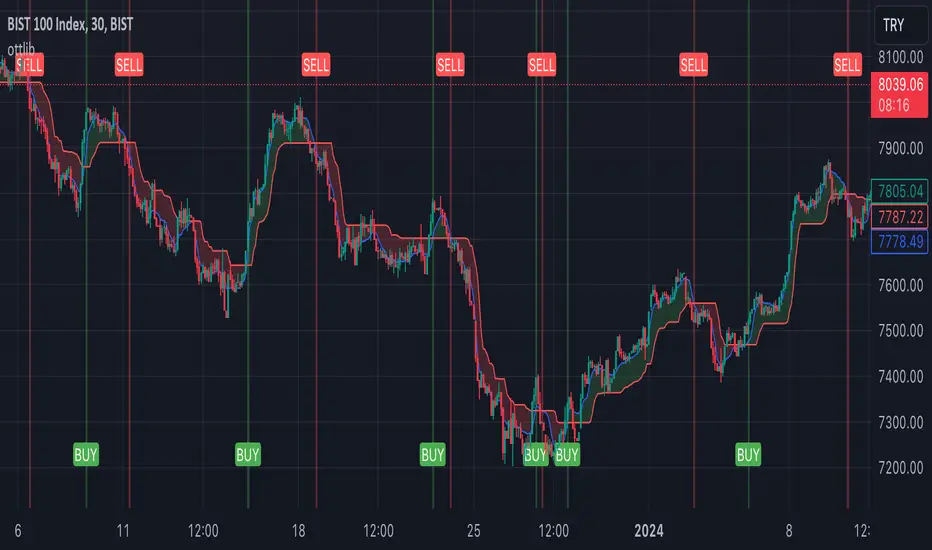
Catching Trend Reversals by shorting tops and buying bottomsHOLP (High of the low period) and LOHP (Low of the high period)
Catching Trend Reversals by shorting tops and buying bottoms
using this Swing High/Low Indicator
Trading Strategy comes from Mastering the Trade, by John Carter pg 300.
Trading Rules for Sells, Buys are reversed
1. Identifying a trending market, where today's price is making a 20-day high (17-18 day highs are also fine)
Note this is configurable by setting the trending period variable (defaults to 20)
For example if price is making a 20 period high or 20 period low, it will show a triangle up/down above the candle.
2. Identify the high bar in the uptrend
3. Go short once the price action closes below the low of this high bar
4. The initial stop is the high of the high bar.
5. If you are in the trade on the third day or period, use a 2 bar trailing stop.
You can check 2-bar trailing stop to draw the line, defaults to off.
Stop is indicated by the white dot.
Code Converted from TradeStation EasyLanguage
I can't find the original source anymore for the swing high/low plots, but if someone knows,
let me know and I'll credit here.
