Dynamic Open Levels# Dynamic Open Levels Indicator v1.0
Release Date: November 5, 2024
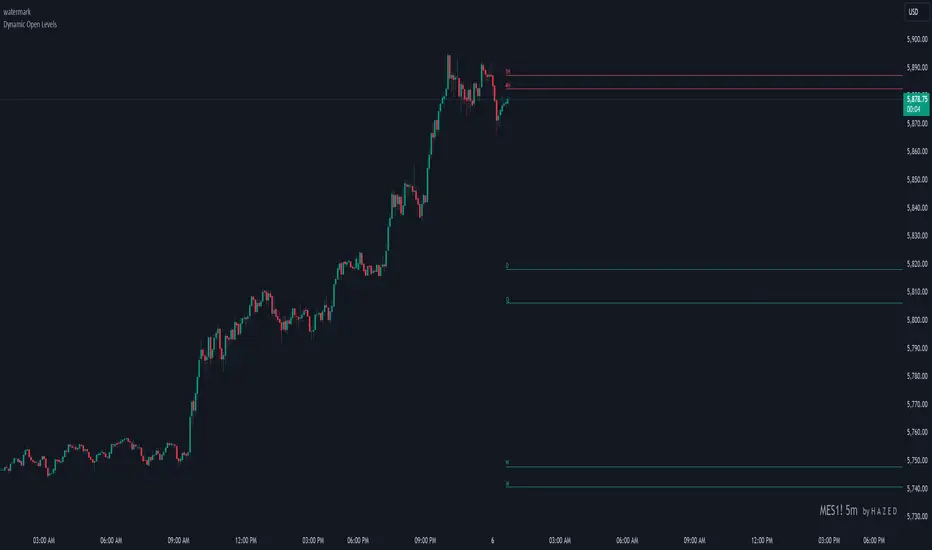
Introducing the Dynamic Open Levels indicator on TradingView! This tool helps traders visualize and analyze key opening price levels across multiple timeframes, making your market analysis more effective.
---
### Key Features
- Multiple Timeframes : Yearly, Quarterly, Monthly, Weekly, Daily, 4H, and 1H levels available.
- Visibility Controls : Easily toggle visibility for each timeframe to suit your trading style.
- Line Customization : Set custom thickness and colors for lines, making charts easy to interpret.
- Monthly: Purple
- Weekly: Blue
- Daily: Green
- 4H: Red
- 1H: Orange
- Dynamic Coloring : Lines adjust color based on market conditions—teal for bullish (`rgb(34, 171, 148)`) and coral for bearish (`rgb(247, 82, 95)`).
### Labels & Customization
- Real-Time Labels : Each level is labeled for easy identification (e.g., Y for Yearly, Q for Quarterly).
- Label Settings : Customize opacity, text color, size, and position for clarity without cluttering your chart.
- Sizes : Choose from tiny, small, normal, large, to huge.
- Offset : Set labels from 1 to 10 to position them precisely.
- Color Management : Organize all colors under a dedicated Line Colors group for easy adjustments.
### Advanced Plotting & Performance
- Real-Time Updates : Levels are updated dynamically with the latest open prices.
- Extended Lines : Lines extend to the right, offering a consistent reference for future price movement.
- Optimized Performance : Handles up to 500 lines efficiently to maintain smooth performance.
---
### Installation Instructions
1. Add to Chart :
- Go to the Indicators section in TradingView.
- Search for Dynamic Open Levels and add it to your chart.
2. Customize Settings :
- Line Thickness : Adjust to suit your preference.
- Visibility : Toggle timeframes like Yearly, Monthly, Weekly, etc., as needed.
- Labels : Configure opacity, text color, size, and offset under the Label Settings group.
---
### Documentation & Support
For guidance on using the Dynamic Open Levels indicator, visit our Documentation (#). If you need assistance, check out our Support Channel (#).
---
Thank you for choosing Dynamic Open Levels . Stay tuned for future updates that will continue to improve your trading experience!
H A Z E D
Komut dosyalarını "2024年5月2日+深交所+股票成交额+新浪财经" için ara
Pulse DPO: Major Cycle Tops and Bottoms█ OVERVIEW
Pulse DPO is an oscillator designed to highlight Major Cycle Tops and Bottoms .
It works on any market driven by cycles. It operates by removing the short-term noise from the price action and focuses on the market's cyclical nature.
This indicator uses a Normalized version of the Detrended Price Oscillator (DPO) on a 0-100 scale, making it easier to identify major tops and bottoms.
Credit: The DPO was first developed by William Blau in 1991.
█ HOW TO READ IT
Pulse DPO oscillates in the range between 0 and 100. A value in the upper section signals an OverBought (OB) condition, while a value in the lower section signals an OverSold (OS) condition.
Generally, the triggering of OB and OS conditions don't necessarily translate into swing tops and bottoms, but rather suggest caution on approaching a market that might be overextended.
Nevertheless, this indicator has been customized to trigger the signal only during remarkable top and bottom events.
I suggest using it on the Daily Time Frame , but you're free to experiment with this indicator on other time frames.
The indicator has Built-in Alerts to signal the crossing of the Thresholds. Please don't act on an isolated signal, but rather integrate it to work in conjunction with the indicators present in your Trading Plan.
█ OB SIGNAL ON: ENTERING OVERBOUGHT CONDITION
When Pulse DPO crosses Above the Top Threshold it Triggers ON the OB signal. At this point the oscillator line shifts to OB color.
When Pulse DPO enters the OB Zone, please beware! In this Area the Major Players usually become Active Sellers to the Public. While the OB signal is On, it might be wise to Consider Selling a portion or the whole Long Position.
Please note that even though this indicator aims to focus on major tops and bottoms, a strong trending market might trigger the OB signal and stay with it for a long time. That's especially true on young markets and on bubble-mode markets.
█ OB SIGNAL OFF: EXITING OVERBOUGHT CONDITION
When Pulse DPO crosses Below the Top Threshold it Triggers OFF the OB signal. At this point the oscillator line shifts to its normal color.
When Pulse DPO exits the OB Zone, please beware because a Major Top might just have occurred. In this Area the Major Players usually become Aggressive Sellers. They might wind up any remaining Long Positions and Open new Short Positions.
This might be a good area to Open Shorts or to Close/Reverse any remaining Long Position. Whatever you choose to do, it's usually best to act quickly because the market is prone to enter into panic mode.
█ OS SIGNAL ON: ENTERING OVERSOLD CONDITION
When Pulse DPO crosses Below the Bottom Threshold it Triggers ON the OS signal. At this point the oscillator line shifts to OS color.
When Pulse DPO enters the OS Zone, please beware because in this Area the Major Players usually become Active Buyers accumulating Long Positions from the desperate Public.
While the OS signal is On, it might be wise to Consider becoming a Buyer or to implement a Dollar-Cost Averaging (DCA) Strategy to build a Long Position towards the next Cycle. In contrast to the tops, the OS state usually takes longer to resolve a major bottom.
█ OS SIGNAL OFF: EXITING OVERSOLD CONDITION
When Pulse DPO crosses Above the Bottom Threshold it Triggers OFF the OS signal. At this point the oscillator line shifts to its normal color.
When Pulse DPO exits the OS Zone, please beware because a Major Bottom might already be in place. In this Area the Major Players become Aggresive Buyers. They might wind up any remaining Short Positions and Open new Long Positions.
This might be a good area to Open Longs or to Close/Reverse any remaining Short Positions.
█ WHY WOULD YOU BE INTERESTED IN THIS INDICATOR?
This indicator is built over a solid foundation capable of signaling Major Cycle Tops and Bottoms across many markets. Let's see some examples:
Early Bitcoin Years: From 0 to 1242
This chart is in logarithmic mode in order to properly display various exponential cycles. Pulse DPO is properly signaling the major early highs from 9-Jun-2011 at 31.50, to the next one on 9-Apr-2013 at 240 and the epic top from 29-Nov-2013 at 1242.
Due to the massive price movements, the OB condition stays pinned during most of the exponential price action. But as you can see, the OB condition quickly vanishes once the Cycle Top has been reached. As the market matures, the OB condition becomes more exceptional and triggers much closer from the Cycle Top.
With regards to Cycle Bottoms, the early bottom of 2 after having peaked at 31.50 doesn’t get captured by the indicator. That is the only cycle bottom that escapes the Pulse DPO when the bottom threshold is set at a value of 5. In that event, the oscillator low reached 6.95.
Bitcoin Adoption Spreading: From 257 to 73k
This chart is in logarithmic mode in order to properly display various exponential cycles. Pulse DPO is properly signaling all the major highs from 17-Dec-2017 at 19k, to the next one on 14-Apr-2021 at 64k and the most recent top from 9-Nov-2021 at 68k.
During the massive run of 2017, the OB condition still stayed triggered for a few weeks on each swing top. But on the next cycles it started to signal only for a few days before each swing top actually happened. The OB condition during the last cycle top triggered only for 3 days. Therefore the signal grows in focus as the market matures.
At the time of publishing this indicator, Bitcoin printed a new All Time High (ATH) on 13-Mar-2024 at 73k. That run didn’t trigger the OB condition. Therefore, if the indicator is correct the Bitcoin market still has some way to grow during the next months.
With regards to Cycle Bottoms, the bottom of 3k after having peaked at19k got captured within the wide OS zone. The bottom of 15k after having peaked at 68k got captured too within the OS accumulation area.
Gold
Pulse DPO behaves surprisingly well on a long standing market such as Gold. Moving back to the 197x years it’s been signaling most Cycle Tops and Bottoms with precision. During the last cycle, it shows topping at 2k and bottoming at 1.6k.
The current price action is signaling OB condition in the range of 2.5k to 2.7k. Looking at past cycles, it tends to trigger on and off at multiple swing tops until reaching the final cycle top. Therefore this might indicate the first wave within a potential gold run.
Oil
On the Oil market, we can see that most of the cycle tops and bottoms since the 80s got signaled. The only exception being the low from 2020 which didn’t trigger.
EURUSD
On Forex markets the Pulse DPO also behaves as expected. Looking back at EURUSD we can see the marketing triggering OB and OS conditions during major cycle tops and bottoms from recent times until the 80s.
S&P 500
On the S&P 500 the Pulse DPO catched the lows from 2016 and 2020. Looking at present price action, the recent ATH didn’t trigger the OB condition. Therefore, the indicator is allowing room for another leg up during the next months.
Amazon
On the Amazon chart the Pulse DPO is mirroring pretty accurately the major swings. Scrolling back to the early 2000s, this chart resembles early exponential swings in the crypto space.
Tesla
Moving onto a younger tech stock, Pulse DPO captures pretty accurately the major tops and bottoms. The chart is shown in logarithmic scale to better display the magnitude of the moves.
█ SETTINGS
This indicator is ideal for identifying major market turning points while filtering out short-term noise. You are free to adjust the parameters to align with your preferred trading style.
Parameters : This section allows you to customize any of the Parameters that shape the Oscillator.
Oscillator Length: Defines the period for calculating the Oscillator.
Offset: Shifts the oscillator calculation by a certain number of periods, which is typically half the Oscillator Length.
Lookback Period: Specifies how many bars to look back to find tops and bottoms for normalization.
Smoothing Length: Determines the length of the moving average used to smooth the oscillator.
Thresholds : This section allows you to customize the Thresholds that trigger the OB and OS conditions.
Top: Defines the value of the Top Threshold.
Bottom: Defines the value of the Bottom Threshold.

Previous Highs + Lows by HAZED📈 Introducing: Previous Highs + Lows by H A Z E D 📉
✨ Overview
Get a clear view of market levels with Previous Highs + Lows v1.0! This indicator lets you track critical previous highs and lows across multiple timeframes, marking them directly on your chart for an intuitive view of support and resistance zones. Whether you’re analyzing breakouts or looking for reversal levels, these indicators provide essential context to refine your trades.
🛠️ Key Features
Multiple Timeframes Supported
Toggle on previous highs and lows for daily, weekly, monthly, 4-hour, and 1-hour charts to match your analysis style.
Customizable Labels
Choose label sizes from “tiny” to “huge,” adjust the opacity to blend seamlessly with your chart, and customize text color for optimal readability.
Label Position Control
Avoid overlap with a flexible label offset feature, allowing for 10 adjustable increments to fit your preference and chart layout.
Clear Visual Cues
Labels use icons to differentiate high (⬆️) and low (⬇️) levels at a glance, providing a straightforward way to interpret key price areas.
Instant Alerts for Key Levels
Receive alerts when the price crosses over previous high levels, keeping you informed about potential breakout zones without constant chart-watching.
🚀 How to Use
Identify Key Levels: Quickly locate significant highs and lows from previous periods to define your support and resistance zones.
Set Alerts: Stay updated on market moves with built-in alerts when prices cross these critical levels.
Customize Your View: Use the various options to make this indicator uniquely yours – adjust label size, color, opacity, and position.
🔔 Why Use Previous Highs + Lows v1.0?
Enhanced visibility of critical levels saves you time by giving you a structured view of price action.
Customization features let you adapt the indicator to your personal style and chart setup.
Flexible alerts mean you can focus on other tasks without missing important price movements.
🔗 License: Mozilla Public License 2.0
© H A Z E D, 11/4/2024

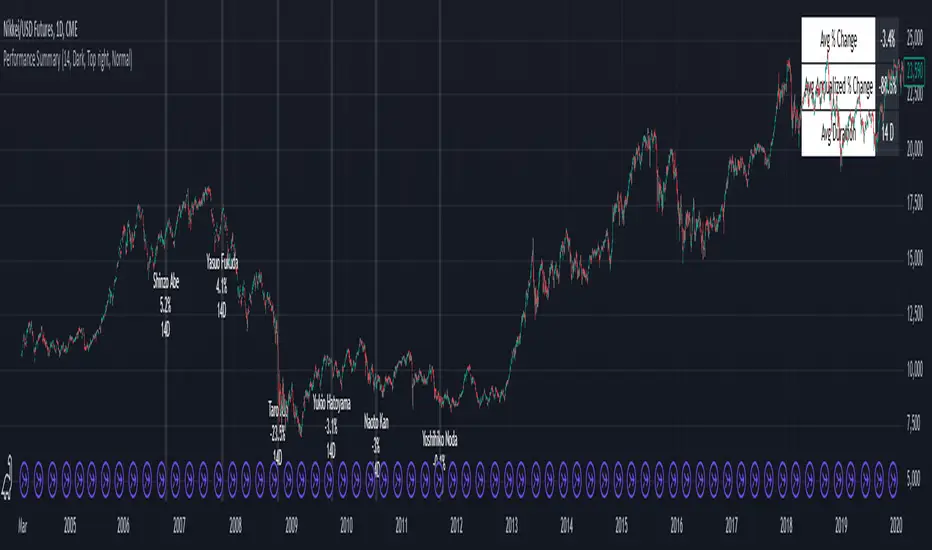
Performance Summary and Shading (Offset Version)Modified "Recession and Crisis Shading" Indicator by @haribotagada (Original Link: )
The updated indicator accepts a days offset (positive or negative) to calculate performance between the offset date and the input date.
Potential uses include identifying performance one week after company earnings or an FOMC meeting.
This feature simplifies input by enabling standardized offset dates, while still allowing flexibility to adjust ranges by overriding inputs as needed.
Summary of added features and indicator notes:
Inputs both positive and negative offset.
By default, the script calculates performance from the close of the input date to the close of the date at (input date + offset) for positive offsets, and from the close of (input date - offset) to the close of the input date for negative offsets. For example, with an input date of November 1, 2024, an offset of 7 calculates performance from the close on November 1 to the close on November 8, while an offset of -7 calculates from the close on October 25 to the close on November 1.
Allows user to perform the calculation using the open price on the input date instead of close price
The input format has been modified to allow overrides for the default duration, while retaining the original capabilities of the indicator.
The calculation shows both the average change and the average annualized change. For bar-wise calculations, annualization assumes 252 trading days per year. For date-wise calculations, it assumes 365 days for annualization.
Carries over all previous inputs to retain functionality of the previous script. Changes a few small settings:
Calculates start to end date performance by default instead of peak to trough performance.
Updates visuals of label text to make it easier to read and less transparent.
Changed stat box color scheme to make the text easier to read
Updated default input data to new format of input with offsets
Changed default duration statistic to number of days instead of number of bars with an option to select number of bars.
Potential Features to Add:
Import dataset from CSV files or by plugging into TradingView calendar
Example Input Datasets:
Recessions:
2020-02-01,COVID-19,59
2007-12-01,Subprime mortgages,547
2001-03-01,Dot-com,243
1990-07-01,Oil shock,243
1981-07-01,US unemployment,788
1980-01-01,Volker,182
1973-11-01,OPEC,485
Japan Revolving Door Elections
2006-09-26, Shinzo Abe
2007-09-26, Yasuo Fukuda
2008-09-24, Taro Aso
2009-09-16, Yukio Hatoyama
2010-07-08, Naoto Kan
2011-09-02, Yoshihiko Noda
Hope you find the modified indicator useful and let me know if you would like any features to be added!
ICT Open Range Gap & 1st FVG (fadi)In his 2024 mentorship program, ICT detailed how price action interacts with Open Range Gaps and the initial 1-minute Fair Value Gap following the market open at 9:30 AM.
What is an Open Range Gap?
An Open Range Gap occurs when the market opens at 9:30 AM at a higher or lower level compared to the previous day's close at 4:14 PM, primarily relevant in futures trading. According to ICT, there is a statistical probability of 70% that the price action will close 50% or more of the Open Range Gap within the first 30 minutes of trading (9:30 AM to 10:00 AM).
What is the First 1-Minute Fair Value Gap?
ICT places significant emphasis on the first 1-minute Fair Value Gap (FVG) that forms after the market opens at 9:30 AM. The FVG must occur at 9:31 AM or later to be considered valid. This gap often presents key opportunities for traders, as it represents a temporary imbalance between supply and demand that the market seeks to correct.
Understanding and leveraging these patterns can enhance trading strategies by offering insights into potential price movements shortly after market open.
ICT Open Range Gap & 1st FVG
This indicator is engineered to identify and highlight the Open Range Gaps and the first 1-minute Fair Value Gap. Furthermore, it functions across multiple timeframes, from seconds to hours, catering to various trading preferences. This flexibility is particularly beneficial for traders who favor higher timeframes or wish to observe these patterns' application at broader intervals.
Settings
The Open Range Gap indicator offers flexible display settings. It identifies the quadrants and provides optional color coding to distinguish them. Additionally, it tracks the "fill" level to visualize how far the price action has progressed into the gap, enhancing traders' ability to monitor and analyze price movements effectively. By default, the Open Range Gap will stop extending at 10:00 AM; however, there is an option to continue extending until the end of the trading day.
The 1st Fair Value Gap (FVG) can be viewed on any timeframe the indicator is active on, offering various styling options to match each trader's preferences. While the 1st FVG is particularly relevant to the day it is created, previous 1st FVGs within the same week may provide additional value. This indicator allows traders to extend Monday's 1st FVG, marking the first FVG of the week, or to extend all 1st FVGs throughout the week.

Indicator SELL UBScript Name: UB Sell Indicator based on 10Y Volume and Trend
Description: This indicator uses the 10-year interest rate (10Y1!) volume and price data to generate sell signals on the UB contract. When the 10Y1! volume exceeds a fixed threshold and the 10Y1! price is rising, a sell signal is issued to help traders anticipate bearish moves on the UB.
Features:
10Y1! Volume: Identifies periods of high volume.
10Y1! Price: Detects bullish trends in the 10Y1!.
Sell Signals: Displays red arrows to indicate selling opportunities on UB when conditions are met.
Visual Indicators: Colors and arrows for easy signal interpretation.
Parameters:
Fixed Volume Threshold: 114 (modifiable as needed).
Moving Average Period: 10 (to calculate the 10Y1! price trend).
Usage:
Watch for red arrows to identify selling opportunities on UB.
Combine with other analyses and indicators for a complete trading strategy.
Author: Jm Smeers
Publication Date: 26/10/2024

Supply and demandHi all!
This is my take on supply/demand. The gist is that it creates a zone if there is a big enough reaction. This is configurable in settings as "Minimum range (ATR factor)" (the Average True Length of length 14) that is the distance that the price must travel and "Reaction bars" that is the maximum number of bars that price must travel this distance. The zones that are shown are the ones that have a retest, break and retest or is unmitigated (untouched). If a zone is mitigated (entered) or broken it is temporarily hidden. For a zone to be created it needs to have this reaction and the previous bar does not.
So this script will show you zones that are fresh (unmitigated), retested or broken and retested. This means that the zones that are shown have "proven" that they are good zones through this. Basically it means that the script creates a bunch of zones and then picks the good once. This makes the script have some latency, but will hopefully give you good zones. A zone is completely removed if it's broken twice (it's okay if it's broken once and can still have a retest after it has flipped from previous supply (or resistance) into demand (or support)).
Here is a zone (the one that has the lowest opacity) that is broken and retested that could have resulted in a good long trade (the settings are default but has a stop in the beginning of 2024):
You have a setting to remove zones that are pierced (broken by price wicks). The following zone is pierced by price (in the beginning of May) that will not be shown after the start of May if you have "Pierced" checked (the indicator has default settings but a stop in the middle of April):
You have a trend section. Zones that create a reaction upwards can only be created if the trend is considered to be up, and vice versa. The options here are "SMA50" (the current price needs to be over the Simple Moving Average of length 50) and "SMA50, SMA200" (price needs to be over the Simple Moving Average of length 50 and the Simple Moving Average of length 50 needs to be over the Simple Moving Average of length 200). If these conditions are met the trend is considered to be up, otherwise it's down. You can disable this by choosing "No detection".
The zones that are shown also need to be within a limit (of the current price). This limit is 10 (factor of the Average True Range if length 14) by default. Set this to 0 to deactivate. This is useful for not showing zones that are far away from current price and therefore unlikely to be interacted with.
You can stop the calculation of zones (through the "Stop" value in the settings). This is useful to see if previous zones were any good. I used it in my testing of the script but left it because it can be nice to have.
The zones created by the script have different transparency based upon the zone's interaction. The clearest zones are the ones that are unmitigated, the second clearest ones are the ones having a retest and lastly the zones which are most unclear are the ones having a break and then a retest.
You can see the concept of this script to be a mix of supply/demand and support/resistance, having zones being unmitigated (untouched) as the most important but also show the zones having an interaction (in the form of a retest or a break and retest).
This is from a previous supply (or resistance) zone that has flipped into demand (or support) and has shown to be a good zone through a retest followed by a rally (default settings):
This zone has multiple retest and then rallies that could have given a good long trades (it has the default settings but a "Stop" time at 2022-01-14):
TODO:
- Create zones based on pivots
- Handle overlapping zones
- Incorporate volume in the creation and/or interaction with zones
- Add alerts
- Add ability to set maximum zone width
- Add ability to set the maximum number of retest bars
- ...?
The example for this publication has the default settings bit a "Stop" and a tighter "Limit" of 4.
I hope this explanation makes sense, let me know otherwise. Also let me know if you have any suggestions on improvements.
Best of trading luck!

ATR Trailing Stop by tactical trade 22 Oct 2024Description:
The ATR Dual Trailing Stop indicator is a versatile and powerful tool designed to help traders visualize dynamic support and resistance levels based on the Average True Range (ATR). This indicator plots two separate ATR-based trailing stops with customizable settings, providing a comprehensive view of potential market reversals and trend strength.
Key features:
Two ATR Trailing Stops: The first stop uses customizable ATR settings (default: 10-period ATR with a 3x multiplier), while the second stop uses an alternate configuration (default: 21-period ATR with a 7x multiplier).
Multi-Timeframe ATR Calculation: Regardless of the chart's time frame, the ATR is calculated based on a user-selected time frame (e.g., daily), allowing for consistent stop-loss levels even in lower time frames like 5-minute or 15-minute charts.
Visual Cues: The indicator clearly plots two trailing stop lines in different colors, making it easy to track the market’s volatility-based support and resistance areas.
No Buy/Sell Signals: This is purely a trailing stop indicator with no embedded buy/sell signals, giving traders the flexibility to use it with their preferred entry/exit strategies.
This indicator is especially useful in highly volatile markets where precise trailing stop levels are essential for managing risk and maximizing profit potential. The dual ATR configuration helps traders adapt to changing market conditions by providing two levels of stop placement: a shorter-term and a longer-term trailing stop.

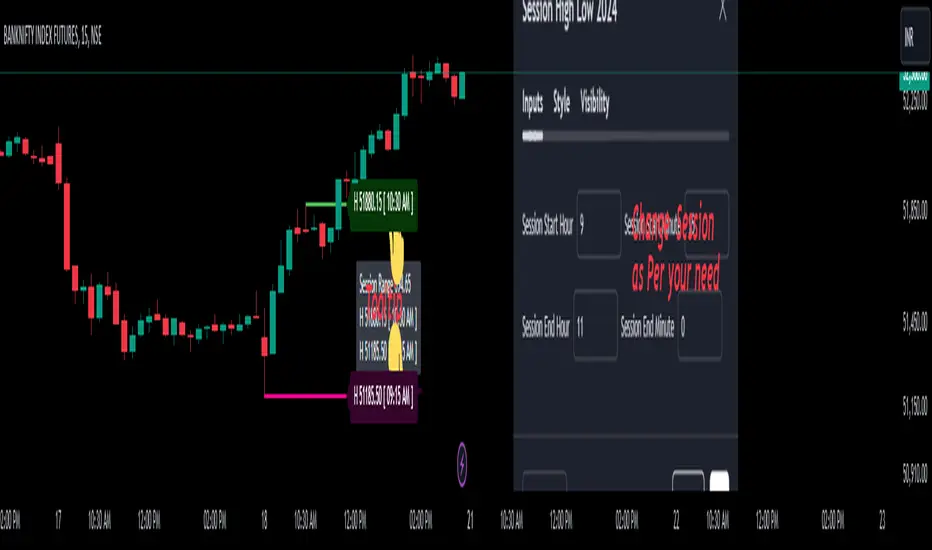
Session High Low 2024
Overview of the Code:
Input for Session Times:
You set up inputs for the start and end times of the trading session, allowing you to customize them as needed.
Time Range Function:
A function isTimeInRange checks whether the current time falls within the specified session start and end times.
initialize High and Low:
indicator initialize session high, low, and their corresponding labels and lines.
Tracking Session High and Low:
Within the specified time range, continuously update session1High and session1Low based on the highest and lowest prices encountered.
Time of Session High/Low:
The High_Time and Low_Time are tracked using the ta.valuewhen() function to capture the exact times when the session high and low occur.
Notes Creation:
You format the high and low values along with their timestamps to create notes that will be displayed alongside the lines.
Drawing Lines and Labels:
After the session ends, you check if there is a new session high or low and draw lines and labels accordingly. If a line or label already exists, you delete it before drawing a new one.
Resetting for Next Session:
At the end of the session, the high and low values are reset for the next session.
Suggestions for Improvement:
Dynamic Line Extensions:
Clear Variable Names Used in Code:
Consider using more descriptive names for variables like Entry_Point and SL_Point to make the code easier to understand.
Commenting:
Although the code is well-commented, always ensure the comments explain the "why" behind the code rather than just the "what."
Example Output:
The output will show the highest and lowest prices during the specified session times and the times they occurred formatted correctly. This output is useful for quick reference during trading and aids in making informed decisions.
Added functionality tool tip Note:
Added a tooltip Note to Get All information of Session High Low & Range.
If you need further modifications, enhancements, or specific functionalities added to this script, please let me know!
Commitment of Trader %R StrategyThis Pine Script strategy utilizes the Commitment of Traders (COT) data to inform trading decisions based on the Williams %R indicator. The script operates in TradingView and includes various functionalities that allow users to customize their trading parameters.
Here’s a breakdown of its key components:
COT Data Import:
The script imports the COT library from TradingView to access historical COT data related to different trader groups (commercial hedgers, large traders, and small traders).
User Inputs:
COT data selection mode (e.g., Auto, Root, Base currency).
Whether to include futures, options, or both.
The trader group to analyze.
The lookback period for calculating the Williams %R.
Upper and lower thresholds for triggering trades.
An option to enable or disable a Simple Moving Average (SMA) filter.
Williams %R Calculation: The script calculates the Williams %R value, which is a momentum indicator that measures overbought or oversold levels based on the highest and lowest prices over a specified period.
SMA Filter: An optional SMA filter allows users to limit trades to conditions where the price is above or below the SMA, depending on the configuration.
Trade Logic: The strategy enters long positions when the Williams %R value exceeds the upper threshold and exits when the value falls below it. Conversely, it enters short positions when the Williams %R value is below the lower threshold and exits when the value rises above it.
Visual Elements: The script visually indicates the Williams %R values and thresholds on the chart, with the option to plot the SMA if enabled.
Commitment of Traders (COT) Data
The COT report is a weekly publication by the Commodity Futures Trading Commission (CFTC) that provides a breakdown of open interest positions held by different types of traders in the U.S. futures markets. It is widely used by traders and analysts to gauge market sentiment and potential price movements.
Data Collection: The COT data is collected from futures commission merchants and is published every Friday, reflecting positions as of the previous Tuesday. The report categorizes traders into three main groups:
Commercial Traders: These are typically hedgers (like producers and processors) who use futures to mitigate risk.
Non-Commercial Traders: Often referred to as speculators, these traders do not have a commercial interest in the underlying commodity but seek to profit from price changes.
Non-reportable Positions: Small traders who do not meet the reporting threshold set by the CFTC.
Interpretation:
Market Sentiment: By analyzing the positions of different trader groups, market participants can gauge sentiment. For instance, if commercial traders are heavily short, it may suggest they expect prices to decline.
Extreme Positions: Some traders look for extreme positions among non-commercial traders as potential reversal signals. For example, if speculators are overwhelmingly long, it might indicate an overbought condition.
Statistical Insights: COT data is often used in conjunction with technical analysis to inform trading decisions. Studies have shown that analyzing COT data can provide valuable insights into future price movements (Lund, 2018; Hurst et al., 2017).
Scientific References
Lund, J. (2018). Understanding the COT Report: An Analysis of Speculative Trading Strategies.
Journal of Derivatives and Hedge Funds, 24(1), 41-52. DOI:10.1057/s41260-018-00107-3
Hurst, B., O'Neill, R., & Roulston, M. (2017). The Impact of COT Reports on Futures Market Prices: An Empirical Analysis. Journal of Futures Markets, 37(8), 763-785.
DOI:10.1002/fut.21849
Commodity Futures Trading Commission (CFTC). (2024). Commitment of Traders. Retrieved from CFTC Official Website.

Pivot-based Swing Highs and LowsRelease Notes for Pivot-based Swing Highs and Lows Indicator with HH, HL, LH, LL and Labels
Version 1.0.0
Release Date: 29th Sept 2024
Overview:
This Pine Script version 5 indicator is designed to identify and display Swing Highs and Swing Lows based on pivot points. The indicator visually marks Higher Highs (HH), Lower Highs (LH), Higher Lows (HL), and Lower Lows (LL) on the chart. The release introduces an improved visual representation with dotted lines and colored labels for easy identification of market structure, using plotshape() and line.new().
Key Features:
1. Pivot-Based Swing Identification:
The indicator uses ta.pivothigh() and ta.pivotlow() to detect significant pivot points on the chart.
The length of the pivot can be adjusted through the pivot_length parameter, allowing users to customize the sensitivity of swing identification.
2. Swing Highs and Lows with Labels:
Higher High (HH) and Lower High (LH) points are marked with green downward triangles.
Higher Low (HL) and Lower Low (LL) points are marked with red upward triangles.
The plotshape() function is used to provide clear visual markers, making it easy to spot the changes in market structure.
3. Dotted Line Visuals:
Green Dotted Lines: Connect Higher Highs (HH) and Higher Lows (HL) to their corresponding previous swings.
Red Dotted Lines: Connect Lower Highs (LH) and Lower Lows (LL) to their corresponding previous swings.
The use of color-coded dotted lines ensures better visual understanding of the trend continuation or reversal patterns.
4. Customizable Input:
The user can adjust the pivot_length parameter to fine-tune the detection of pivot highs and lows according to different timeframes or trading strategies.
Usage:
Higher High (HH): Green downward triangle, indicating a new high compared to the previous pivot high.
Lower High (LH): Green downward triangle, indicating a lower high compared to the previous pivot high.
Higher Low (HL): Red upward triangle, indicating a higher low compared to the previous pivot low.
Lower Low (LL): Red upward triangle, indicating a new lower low compared to the previous pivot low.
Dotted Lines: Connect previous swing points, helping users visualize the trend and potential market structure changes.
Improvements:
Label Substitution: In place of label.new() (which might cause issues in some environments), the indicator now uses plotshape() to provide a reliable and visually effective solution for marking swings.
Streamlined Performance: The logic for determining higher highs, lower highs, higher lows, and lower lows has been optimized for smooth performance across multiple timeframes.
Known Limitations:
No Direct Text Labels: Due to the constraints of plotshape(), text labels like "HH", "LH", "HL", and "LL" are not directly displayed. Instead, color-coded shapes are used for easy identification.
How to Use:
Apply the script to your chart via the TradingView Pine Editor.
Customize the pivot_length to suit your trading style or the timeframe you are analyzing.
Monitor the chart for marked Higher Highs, Lower Highs, Higher Lows, and Lower Lows for potential trend continuation or reversal opportunities.
Use the dotted lines to trace the evolution of market structure.
Please share your comments, thoughts. Also please follow me for more scripts in future. Mean time Happy Trading :)

Pivot Points LIVE [CHE]Title:
Pivot Points LIVE Indicator
Subtitle:
Advanced Pivot Point Analysis for Real-Time Trading
Presented by:
Chervolino
Date:
September 24, 2024
Introduction
What are Pivot Points?
Definition:
Pivot Points are technical analysis indicators used to determine potential support and resistance levels in financial markets.
Purpose:
They help traders identify possible price reversal points and make informed trading decisions.
Overview of Pivot Points LIVE :
A comprehensive indicator designed for real-time pivot point analysis.
Offers advanced features for enhanced trading strategies.
Key Features
Pivot Points LIVE Includes:
Dynamic Pivot Highs and Lows:
Automatically detects and plots pivot high (HH, LH) and pivot low (HL, LL) points.
Customizable Visualization:
Multiple options to display markers, price labels, and support/resistance levels.
Fractal Breakouts:
Identifies and marks breakout and breakdown events with symbols.
Line Connection Modes:
Choose between "All Separate" or "Sequential" modes for connecting pivot points.
Pivot Extension Lines:
Extends lines from the latest pivot point to the current bar for trend analysis.
Alerts:
Configurable alerts for breakout and breakdown events.
Inputs and Configuration
Grouping Inputs for Easy Customization:
Source / Length Left / Length Right:
Pivot High Source: High price by default.
Pivot Low Source: Low price by default.
Left and Right Lengths: Define the number of bars to the left and right for pivot detection.
Colors: Customizable colors for pivot high and low markers.
Options:
Display Settings:
Show HH, LL, LH, HL markers and price labels.
Display support/resistance level extensions.
Option to show levels as a fractal chaos channel.
Enable fractal breakout/down symbols.
Line Connection Mode:
Choose between "All Separate" or "Sequential" for connecting lines.
Line Management:
Set maximum number of lines to display.
Customize line colors, widths, and styles.
Pivot Extension Line:
Visibility: Toggle the display of the last pivot extension line.
Customization: Colors, styles, and width for extension lines.
How It Works - Calculating Pivot Points
Pivot High and Pivot Low Detection:
Pivot High (PH):
Identified when a high price is higher than a specified number of bars to its left and right.
Pivot Low (PL):
Identified when a low price is lower than a specified number of bars to its left and right.
Higher Highs, Lower Highs, Higher Lows, Lower Lows:
Higher High (HH): Current PH is higher than the previous PH.
Lower High (LH): Current PH is lower than the previous PH.
Higher Low (HL): Current PL is higher than the previous PL.
Lower Low (LL): Current PL is lower than the previous PL.
Visual Elements
Markers and Labels:
Shapes:
HH and LH: Downward triangles above the bar.
HL and LL: Upward triangles below the bar.
Labels:
Optionally display the price levels of HH, LH, HL, and LL on the chart.
Support and Resistance Levels:
Extensions:
Lines extending from pivot points to indicate potential support and resistance zones.
Chaos Channels:
Display levels as a fractal chaos channel for enhanced trend analysis.
Fractal Breakout Symbols:
Buy Signals: Upward triangles below the bar.
Sell Signals: Downward triangles above the bar.
Slide 7: Line Connection Modes
All Separate Mode:
Description:
Connects pivot highs with pivot highs and pivot lows with pivot lows separately.
Use Case:
Ideal for traders who want to analyze highs and lows independently.
Sequential Mode:
Description:
Connects all pivot points in the order they occur, regardless of being high or low.
Use Case:
Suitable for identifying overall trend direction and momentum.
Pivot Extension Lines
Purpose:
Trend Continuation:
Visualize the continuation of the latest pivot point's price level.
Customization:
Colors:
Differentiate between bullish and bearish extensions.
Styles:
Solid, dashed, or dotted lines based on user preference.
Width:
Adjustable line thickness for better visibility.
Dynamic Updates:
The extension line updates in real-time as new bars form, providing ongoing trend insights.
Alerts and Notifications
Configurable Alerts:
Fractal Break Arrow:
Triggered when a breakout or breakdown occurs.
Long and Short Signals:
Specific alerts for bullish breakouts (Long) and bearish breakdowns (Short).
Benefits:
Timely Notifications:
Stay informed of critical market movements without constant monitoring.
Automated Trading Strategies:
Integrate with trading bots or automated systems for executing trades based on alerts.
Customization and Optimization
User-Friendly Inputs:
Adjustable Parameters:
Tailor pivot detection sensitivity with left and right lengths.
Color and Style Settings:
Match the indicator aesthetics to personal or platform preferences.
Line Management:
Maximum Lines Displayed:
Prevent chart clutter by limiting the number of lines.
Dynamic Line Handling:
Automatically manage and delete old lines to maintain chart clarity.
Flexibility:
Adapt to Different Markets:
Suitable for various financial instruments including stocks, forex, and cryptocurrencies.
Scalability:
Efficiently handles up to 500 labels and 100 lines for comprehensive analysis.
Practical Use Cases
Identifying Key Support and Resistance:
Entry and Exit Points:
Use pivot levels to determine optimal trade entry and exit points.
Trend Confirmation:
Validate market trends through the connection of pivot points.
Breakout and Breakdown Strategies:
Trading Breakouts:
Enter long positions when price breaks above pivot highs.
Trading Breakdowns:
Enter short positions when price breaks below pivot lows.
Risk Management:
Setting Stop-Loss and Take-Profit Levels:
Utilize pivot levels to place strategic stop-loss and take-profit orders.
Slide 12: Benefits for Traders
Real-Time Analysis:
Provides up-to-date pivot points for timely decision-making.
Enhanced Visualization:
Clear markers and lines improve chart readability and analysis efficiency.
Customizable and Flexible:
Adapt the indicator to fit various trading styles and strategies.
Automated Alerts:
Stay ahead with instant notifications on key market events.
Comprehensive Toolset:
Combines pivot points with fractal analysis for deeper market insights.
Conclusion
Pivot Points LIVE is a robust and versatile indicator designed to enhance your trading strategy through real-time pivot point analysis. With its advanced features, customizable settings, and automated alerts, it equips traders with the tools needed to identify key market levels, execute timely trades, and manage risks effectively.
Ready to Elevate Your Trading?
Explore Pivot Points LIVE and integrate it into your trading toolkit today!
Q&A
Questions?
Feel free to ask any questions or request further demonstrations of the Pivot Points LIVE indicator.

Interest Rate Trading (Manually Added Rate Decisions) [TANHEF]Interest Rate Trading: How Interest Rates Can Guide Your Next Move.
How were interest rate decisions added?
All interest rate decision dates were manually retrieved from the 'Record of Policy Actions' and 'Minutes of Actions' on the Federal Reserve's website due to inconsistent dates from other sources. These were manually added as Pine Script currently only identifies rate changes, not pauses.
█ Simple Explanation:
This script is designed for analyzing and backtesting trading strategies based on U.S. interest rate decisions which occur during Federal Open Market Committee (FOMC) meetings, to make trading decisions. No trading strategy is perfect, and it's important to understand that expectations won't always play out. The script leverages historical interest rate changes, including increases, decreases, and pauses, across multiple economic time periods from 1971 to the present. The tool integrates two key data sources for interest rates—USINTR and FEDFUNDS—to support decision-making around rate-based trades. The focus is on identifying opportunities and tracking trades driven by interest rate movements.
█ Interest Rate Decision Sources:
As noted above, each decision date has been manually added from the 'Record of Policy Actions' and 'Minutes of Actions' documents on the Federal Reserve's website. This includes +50 years of more than 600 rate decisions.
█ Interest Rate Data Sources:
USINTR: Reflects broader U.S. interest rate trends, including Treasury yields and various benchmarks. This is the preferred option as it corresponds well to the rate decision dates.
FEDFUNDS: Tracks the Federal Funds Rate, which is a more specific rate targeted by the Federal Reserve. This does not change on the exact same days as the rate decisions that occur at FOMC meetings.
█ Trade Criteria:
A variety of trading conditions are predefined to suit different trading strategies. These conditions include:
Increase/Decrease: Standard rate increases or decreases.
Double/Triple Increase/Decrease: A series of consecutive changes.
Aggressive Increase/Decrease: Rate changes that exceed recent movements.
Pause: Identification of no changes (pauses) between rate decisions, including double or triple pauses.
Complex Patterns: Combinations of pauses, increases, or decreases, such as "Pause after Increase" or "Pause or Increase."
█ Trade Execution and Exit:
The script allows automated trade execution based on selected criteria:
Auto-Entry: Option to enter trades automatically at the first valid period.
Max Trade Duration: Optional exit of trades after a specified number of bars (candles).
Pause Days: Minimum duration (in days) to validate rate pauses as entry conditions. This is especially useful for earlier periods (prior to the 2000s), where rate decisions often seemed random compared to the consistency we see today.
█ Visualization:
Several visual elements enhance the backtesting experience:
Time Period Highlighting: Economic time periods are visually segmented on the chart, each with a unique color. These periods include historical phases such as "Stagflation (1971-1982)" and "Post-Pandemic Recovery (2021-Present)".
Trade and Holding Results: Displays the profit and loss of trades and holding results directly on the chart.
Interest Rate Plot: Plots the interest rate movements on the chart, allowing for real-time tracking of rate changes.
Trade Status: Highlights active long or short positions on the chart.
█ Statistics and Criteria Display:
Stats Table: Summarizes trade results, including wins, losses, and draw percentages for both long and short trades.
Criteria Table: Lists the selected entry and exit criteria for both long and short positions.
█ Economic Time Periods:
The script organizes interest rate decisions into well-defined economic periods, allowing traders to backtest strategies specific to historical contexts like:
(1971-1982) Stagflation
(1983-1990) Reaganomics and Deregulation
(1991-1994) Early 1990s (Recession and Recovery)
(1995-2001) Dot-Com Bubble
(2001-2006) Housing Boom
(2007-2009) Global Financial Crisis
(2009-2015) Great Recession Recovery
(2015-2019) Normalization Period
(2019-2021) COVID-19 Pandemic
(2021-Present) Post-Pandemic Recovery
█ User-Configurable Inputs:
Rate Source Selection: Choose between USINTR or FEDFUNDS as the primary interest rate source.
Trade Criteria Customization: Users can select the criteria for long and short trades, specifying when to enter or exit based on changes in the interest rate.
Time Period: Select the time period that you want to isolate testing a strategy with.
Auto-Entry and Pause Settings: Options to automatically enter trades and specify the number of days to confirm a rate pause.
Max Trade Duration: Limits how long trades can remain open, defined by the number of bars.
█ Trade Logic:
The script manages entries and exits for both long and short trades. It calculates the profit or loss percentage based on the entry and exit prices. The script tracks ongoing trades, dynamically updating the profit or loss as price changes.
█ Examples:
One of the most popular opinions is that when rate starts begin you should sell, then buy back in when rate cuts stop dropping. However, this can be easily proven to be a difficult task. Predicting the end of a rate cut is very difficult to do with the the exception that assumes rates will not fall below 0.25%.
2001-2009
Trade Result: +29.85%
Holding Result: -27.74%
1971-2024
Trade Result: +533%
Holding Result: +5901%
█ Backtest and Real-Time Use:
This backtester is useful for historical analysis and real-time trading. By setting up various entry and exit rules tied to interest rate movements, traders can test and refine strategies based on real historical data and rate decision trends.
This powerful tool allows traders to customize strategies, backtest them through different economic periods, and get visual feedback on their trading performance, helping to make more informed decisions based on interest rate dynamics. The main goal of this indicator is to challenge the belief that future events must mirror the 2001 and 2007 rate cuts. If everyone expects something to happen, it usually doesn’t.

ETH Signal 15m
This strategy uses the Supertrend indicator combined with RSI to generate buy and sell signals, with stop loss (SL) and take profit (TP) conditions based on ATR (Average True Range). Below is a detailed explanation of each part:
1. General Information BINANCE:ETHUSDT.P
Strategy Name: "ETH Signal 15m"
Designed for use on the 15-minute time frame for the ETH pair.
Default capital allocation is 15% of total equity for each trade.
2. Backtest Period
start_time and end_time: Define the start and end time of the backtest period.
start_time = 2024-08-01: Start date of the backtest.
end_time = 2054-01-01: End date of the backtest.
The strategy will only run when the current time falls within this specified range.
3. Supertrend Indicator
Supertrend is a trend-following indicator that provides buy or sell signals based on the direction of price changes.
factor = 2.76: The multiplier used in the Supertrend calculation (increasing this value makes the Supertrend less sensitive to price movements).
atrPeriod = 12: Number of periods used to calculate ATR.
Output:
direction: Determines the buy/sell direction based on Supertrend.
If direction decreases, it signals a buy (Long).
If direction increases, it signals a sell (Short).
4. RSI Indicator
RSI (Relative Strength Index) is a momentum indicator, often used to identify overbought or oversold conditions.
rsiLength = 12: Number of periods used to calculate RSI.
rsiOverbought = 70: RSI level considered overbought.
rsiOversold = 30: RSI level considered oversold.
5. Entry Conditions
Long Entry:
Supertrend gives a buy signal (ta.change(direction) < 0).
RSI must be below the overbought level (rsi < rsiOverbought).
Short Entry:
Supertrend gives a sell signal (ta.change(direction) > 0).
RSI must be above the oversold level (rsi > rsiOversold).
The strategy will only execute trades if the current time is within the backtest period (in_date_range).
6. Stop Loss (SL) and Take Profit (TP) Conditions
ATR (Average True Range) is used to calculate the distance for Stop Loss and Take Profit based on price volatility.
atr = ta.atr(atrPeriod): ATR is calculated using 12 periods.
Stop Loss and Take Profit are calculated as follows:
Long Trade:
Stop Loss: Set at close - 4 * atr (current price minus 4 times the ATR).
Take Profit: Set at close + 2 * atr (current price plus 2 times the ATR).
Short Trade:
Stop Loss: Set at close + 4 * atr (current price plus 4 times the ATR).
Take Profit: Set at close - 2.237 * atr (current price minus 2.237 times the ATR).
Summary:
This strategy enters a Long trade when the Supertrend indicates an upward trend and RSI is not in the overbought region. Conversely, a Short trade is entered when Supertrend signals a downtrend, and RSI is not oversold.
The trade is exited when the price reaches the Stop Loss or Take Profit levels, which are determined based on price volatility (ATR).
Disclaimer:
The content provided in this strategy is for informational and educational purposes only. It is not intended as financial, investment, or trading advice. Trading in cryptocurrency, stocks, or any financial markets involves significant risk, and you may lose more than your initial investment. Past performance is not indicative of future results, and no guarantee of profit can be made. You should consult with a professional financial advisor before making any investment decisions. The creator of this strategy is not responsible for any financial losses or damages incurred as a result of following this strategy. All trades are executed at your own risk.

DP-OCR MTF & MA 2024This script developed is designed for multi-timeframe analysis of previous open, close, and range, with additional signal plots based on various percentage extension levels. It also incorporates EMA calculations for crossover strategies. Here's a quick breakdown of what the script does:
Key Features:
1. Timeframes:
o Two separate timeframes (TF1 and TF2), which can be set by the user (e.g., 15 mins, 30 mins, daily, etc.). The script computes price actions and extensions for both timeframes. For better analysis, use Daily in TF1 and Weekly in TF2
2. Extension Levels:
o Calculates and plots 10%, 21%, 31%, 51%, and 61% extensions (both positive and negative) for each timeframe.
o The most commonly used extension levels are 61%, 31%, -61%, and -21%.
o These extension levels can be turned on or off by the user.
3. Open/Close/Range:
o Tracks the high, low, open, and close for both timeframes.
o Highlights open/close gaps.
o Plots the previous high/low range for both timeframes with a fill and different colors based on price movement.
How to Use:
• You can toggle specific extension levels on or off in the script’s settings.
• For example, when price hits a +61% extension, it could signal a breakout, and when it hits a -61% extension, it may indicate a potential retracement.
• Use these levels in conjunction with your price action analysis to set entry/exit points or stop-loss levels.
4. Today’s Open:
o Plots today’s opening price for both timeframes.
How to Use:
• Use today’s open as a key reference point to determine the day’s price action.
• Compare today’s open with the previous high/low or extension levels to evaluate possible trends or reversals.
5. EMA Calculations:
o The script calculates 5, 15, and 20 period EMAs and plots them on the chart.
o Additional EMA crossover signals can be included for strategy optimization.
How to Use:
• Observe the EMAs for potential crossover signals. For example, a 5-period EMA crossing above a 15-period or 20-period EMA may signal a buy opportunity, while a crossover in the opposite direction may signal a sell.
• Combine the EMA crossovers with extension levels or previous price data to refine your entries and exits.
Customizations Available:
• Users can select whether to display extension levels for either timeframe.
• The script allows automatic adaptation to intraday, daily, weekly, or monthly timeframes based on the current chart settings.
Moreover, the extension levels are calculated based on the previous period’s range, with the most commonly usable extension levels being 61, 31, -61, and -21. These levels are often used for identifying potential price retracements, breakouts, or reversal points in technical analysis.

Optimized Heikin Ashi Strategy with Buy/Sell OptionsStrategy Name:
Optimized Heikin Ashi Strategy with Buy/Sell Options
Description:
The Optimized Heikin Ashi Strategy is a trend-following strategy designed to capitalize on market trends by utilizing the smoothness of Heikin Ashi candles. This strategy provides flexible options for trading, allowing users to choose between Buy Only (long-only), Sell Only (short-only), or using both in alternating conditions based on the Heikin Ashi candle signals. The strategy works on any market, but it performs especially well in markets where trends are prevalent, such as cryptocurrency or Forex.
This script offers customizable parameters for the backtest period, Heikin Ashi timeframe, stop loss, and take profit levels, allowing traders to optimize the strategy for their preferred markets or assets.
Key Features:
Trade Type Options:
Buy Only: Enter a long position when a green Heikin Ashi candle appears and exit when a red candle appears.
Sell Only: Enter a short position when a red Heikin Ashi candle appears and exit when a green candle appears.
Stop Loss and Take Profit:
Customizable stop loss and take profit percentages allow for flexible risk management.
The default stop loss is set to 2%, and the default take profit is set to 4%, maintaining a favorable risk/reward ratio.
Heikin Ashi Timeframe:
Traders can select the desired timeframe for Heikin Ashi candle calculation (e.g., 4-hour Heikin Ashi candles for a 1-hour chart).
The strategy smooths out price action and reduces noise, providing clearer signals for entry and exit.
Inputs:
Backtest Start Date / End Date: Specify the period for testing the strategy’s performance.
Heikin Ashi Timeframe: Select the timeframe for Heikin Ashi candle generation. A higher timeframe helps smooth the trend, which is beneficial for trading lower timeframes.
Stop Loss (in %) and Take Profit (in %): Enable or disable stop loss and take profit, and adjust the levels based on market conditions.
Trade Type: Choose between Buy Only or Sell Only based on your market outlook and strategy preference.
Strategy Performance:
In testing with BTC/USD, this strategy performed well in a 4-hour Heikin Ashi timeframe applied on a 1-hour chart over a period from January 1, 2024, to September 12, 2024. The results were as follows:
Initial Capital: 1 USD
Order Size: 100% of equity
Net Profit: +30.74 USD (3,073.52% return)
Percent Profitable: 78.28% of trades were winners.
Profit Factor: 15.825, indicating that the strategy's profitable trades far outweighed its losses.
Max Drawdown: 4.21%, showing low risk exposure relative to the large profit potential.
This strategy is ideal for both beginner and advanced traders who are looking to follow trends and avoid market noise by using Heikin Ashi candles. It is also well-suited for traders who prefer automated risk management through the use of stop loss and take profit levels.
Recommended Use:
Best Markets: This strategy works well on trending markets like cryptocurrency, Forex, or indices.
Timeframes: Works best when applied to lower timeframes (e.g., 1-hour chart) with a higher Heikin Ashi timeframe (e.g., 4-hour candles) to smooth out price action.
Leverage: The strategy performs well with leverage, but users should consider using 2x to 3x leverage to avoid excessive risk and potential liquidation. The strategy's low drawdown allows for moderate leverage use while maintaining risk control.
Customization: Traders can adjust the stop loss and take profit percentages based on their risk appetite and market conditions. A default setting of a 2% stop loss and 4% take profit provides a balanced risk/reward ratio.
Notes:
Risk Management: Traders should enable stop loss and take profit settings to maintain effective risk management and prevent large drawdowns during volatile market conditions.
Optimization: This strategy can be further optimized by adjusting the Heikin Ashi timeframe and risk parameters based on specific market conditions and assets.
Backtesting: The built-in backtesting functionality allows traders to test the strategy across different market conditions and historical data to ensure robustness before applying it to live trading.
How to Apply:
Select your preferred market and chart.
Choose the appropriate Heikin Ashi timeframe based on the chart's timeframe. (e.g., use 4-hour Heikin Ashi candles for 1-hour chart trends).
Adjust stop loss and take profit based on your risk management preference.
Run backtesting to evaluate its performance before applying it in live trading.
This strategy can be further modified and optimized based on personal trading style and market conditions. It’s important to monitor performance regularly and adjust settings as needed to align with market behavior.

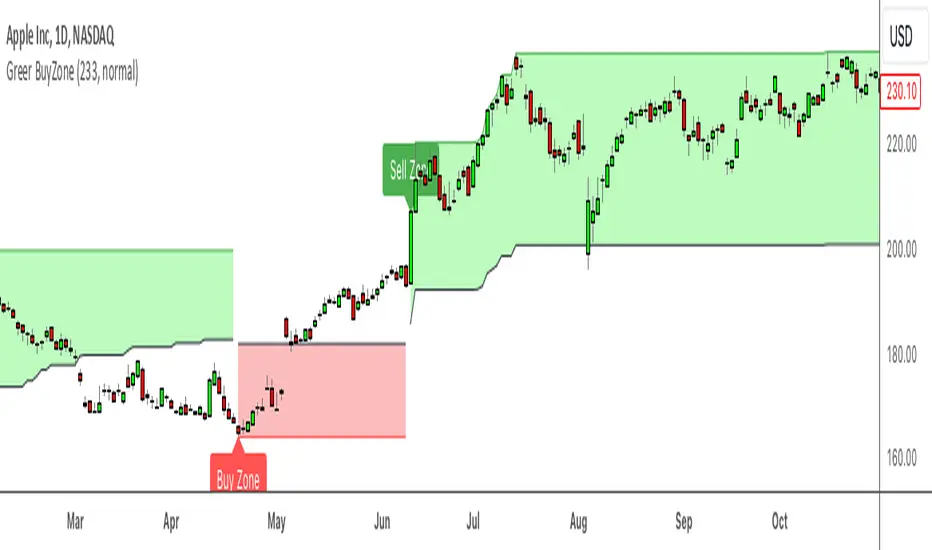
Greer BuyZone toolGreer BuyZone Tool
Description:
The Greer BuyZone Tool is a custom Pine Script indicator designed to help identify potential long-term investment opportunities by marking BuyZones on the chart. This tool utilizes the Aroon indicator in combination with Fibonacci numbers to define periods where the asset might be a good candidate for dollar-cost averaging.
Features:
BuyZone Detection: The script identifies and marks the beginning and end of a BuyZone with vertical lines and labels.
Visual Markers: A red vertical line and label indicate the start of a BuyZone, while a green vertical line and label mark the end of a BuyZone.
Aroon Indicator Calculation: Utilizes the Aroon indicator with a Fibonacci length (233) to determine key price levels.
How to Use:
Setup: Add the Greer BuyZone Tool to your TradingView chart. It will display vertical lines and labels marking the BuyZone periods.
BuyZone Identification: Use the red lines and labels ("BZ Begins ->>") to identify the start of a BuyZone, and the green lines and labels ("<<- BZ Ends") to determine when the BuyZone ends.
Long-Term Investment: This tool is intended for long-term investing and dollar-cost averaging strategies, not for day trading.
Disclaimer:
This script is provided for informational purposes only and is not intended as financial advice. The Greer BuyZone Tool is designed to assist in identifying potential long-term investment opportunities and is not suitable for day trading. The use of this tool involves risk, and there is no guarantee of profitability. Users are advised to conduct their own research and consult with a qualified financial advisor before making any investment decisions. The creator of this script assumes no liability for any losses or damages resulting from the use of this indicator.
Author: Sean Lee Greer
Date: 9/1/2024
BTC Top Indicator - Extension from 20 Week SMA (Normalized)This Indicator calculates the logarithmic deviation of the BTCUSD price from its 20-week SMA and dynamically normalizes it between a lower signal line (-0.57) and an upper trendline defined by two historical points (May 30, 2011, at 1.75 and March 4, 2024, at 0.45).
The indicator line color changes dynamically:
green below 0
blue at 0.5
red above 1
Ideal for analyzing BTCUSD on the Index chart to identify potential overbought or oversold levels. It's better suited for identifying tops, than bottoms.

Linear and Logarithmic Fibonacci Levels and (Price&Time) FansIntroduction
The Fibonacci Retracement tool is a go-to for traders looking to spot potential support and resistance levels. By measuring the distance between swing highs and lows, you can apply Fibonacci ratios like 0.236, 0.382, and 0.618 to predict key market levels.
Traditionally, these levels are set by dividing this distance into equal parts—known as Linear Levels. A more refined approach, Logarithmic Price and Time Levels, divides the distance into proportionally equal segments. Plus, this indicator now includes Fibonacci fans, adding another layer of analysis by projecting potential price levels using trendlines based on Fibonacci ratios.
This tool makes it easier to identify both Linear and Logarithmic levels while also leveraging Fibonacci fans for a more complete market view.
Applications
Logarithmic Levels and Fibonacci fans are ideal for volatile markets. In crypto, they’re especially effective for BTCUSDT (check out the wick from January 23, 2024). They also help spot accumulation and distribution patterns in high-volume altcoins like FETUSDT . In traditional markets, they’re useful for tracking stocks like TSLA and NVDA with extreme price swings, as well as indices in inflation-affected markets like XU100 , or recession-hit currency pairs like JPYUSD .
How to Use
This indicator is intuitive and similar to TradingView’s Fibonacci Tool. Select your reference levels (Level 1 and Level 0), then tweak the settings to customize your analysis, including adding Fibonacci fans for extra insights.
Why It’s Different
Unlike TradingView’s tool, which forces you to switch to a logarithmic scale (messing with other indicators and trend lines), this indicator lets you view both Linear and Logarithmic levels—and Fibonacci fans on Price and Time Series—without changing your chart’s scale. The original Fibonacci Code was derived from zekicanozkanli, modified and upgraded to plot fib front and back fans as well. Due to TV Max Plot restrictions I need to publish just Front and Back and Front Fibs separately.
Linear and Logarithmic Fibonacci Levels and FansIntroduction
The Fibonacci Retracement tool is a go-to for traders looking to spot potential support and resistance levels. By measuring the distance between swing highs and lows, you can apply Fibonacci ratios like 0.236, 0.382, and 0.618 to predict key market levels.
Traditionally, these levels are set by dividing this distance into equal parts—known as Linear Levels. A more refined approach, Logarithmic Levels, divides the distance into proportionally equal segments. Plus, this indicator now includes Fibonacci fans, adding another layer of analysis by projecting potential price levels using trendlines based on Fibonacci ratios.
This tool makes it easier to identify both Linear and Logarithmic levels while also leveraging Fibonacci fans for a more complete market view.
Applications
Logarithmic Levels and Fibonacci fans are ideal for volatile markets. In crypto, they’re especially effective for BTCUSDT (check out the wick from January 23, 2024). They also help spot accumulation and distribution patterns in high-volume altcoins like FETUSDT . In traditional markets, they’re useful for tracking stocks like TSLA and NVDA with extreme price swings, as well as indices in inflation-affected markets like XU100 , or recession-hit currency pairs like JPYUSD .
How to Use
This indicator is intuitive and similar to TradingView’s Fibonacci Tool. Select your reference levels (Level 1 and Level 0), then tweak the settings to customize your analysis, including adding Fibonacci fans for extra insights.
Why It’s Different
Unlike TradingView’s tool, which forces you to switch to a logarithmic scale (messing with other indicators and trend lines), this indicator lets you view both Linear and Logarithmic levels—and Fibonacci fans—without changing your chart’s scale. The original Fibonacci Code was derived from zekicanozkanli, modified and upgraded to plot fib fans as well.

Logarithmic and Linear Fibonacci LevelsIntroduction
Fibonacci levels are a technical analysis tool used by some traders to identify potential support and resistance levels. The principle for determining these levels is to take the distance between selected reference high and low points (swing high and swing low in general) as 1 unit and mark the ratios derived from the Fibonacci sequence, such as 0.236, 0.382, 0.618, etc., over this 1 unit. In the conventional method of level determination, the 1 unit is divided into equal distances within itself, and Fibonacci levels are determined based on these equal distances. These types of levels are called Linear Levels . A relatively less common method involves dividing the 1 unit into progressively smaller, more accurately described as proportionally equal, distances and determining Fibonacci levels based on these distances. These types are called Logarithmic Levels . The purpose of this indicator is to provide ease of use in determining both Linear and Logarithmic levels.
Where can it be Used?
Logarithmic Levels can be used in any instrument where volatility is high for any reason. Specifically in crypto, Logarithmic Levels work very well for BINANCE:BTCUSDT (to observe this, please study the wick from January 23, 2024). As another example, Logarithmic Levels can be used to identify potential accumulation and distribution schemes in altcoins with relatively high volume and market capitalization (refer to the chart provided above BINANCE:FETUSDT ). Additionally, when analyzing traditional markets, Logarithmic Levels can be beneficial for stocks with highly inflated or deflated prices (e.g., NASDAQ:TSLA , NASDAQ:NVDA ), in stock markets of countries battling high inflation (e.g., BIST:XU100 ), or in currency pairs of countries experiencing a recession (e.g., FX_IDC:JPYUSD ).
How can it be Used?
It is designed similarly to the Fibonacci Tool provided by Trading View to ensure users feel familiar with it. When you start the indicator, select the reference levels (Level 1 and Level 0), then click on the indicator settings to choose specific levels and customize them according to your preferences.
What Makes it Unique?
Indeed, in the Fibonacci Tool provided by Trading View, we can see both linear and logarithmic levels. However, to view logarithmic levels, it is necessary to switch the relevant instrument's Super Chart to a logarithmic scale. This causes the levels we want to remain 'linear' to also be displayed in their logarithmic form, potentially leading to errors in other indicators we use, incorrect functioning of trend lines drawn in linear scaling, and so on. Additionally, when the Super Chart is scaled logarithmically, it prevents the ability to set alerts for prices and trend lines. This indicator was created to avoid these problems without needing to change the chart's scaling method and to allow the simultaneous viewing of both Linear and Logarithmic levels.

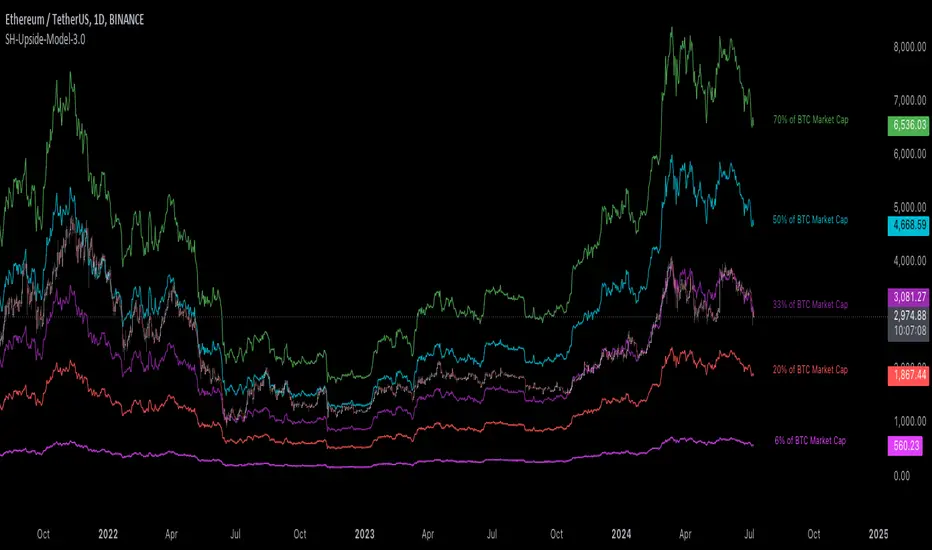
[Suitable Hope] Crypto Upside Model 3.0The "Crypto Upside Model 3.0" indicator dynamically calculates the potential price of any cryptocurrency based on various percentages of Ethereum or Bitcoin's market capitalization.
By fetching and analyzing marketcap data from TradingView sources, it allows traders to visualize potential price targets if their chosen cryptocurrency reaches specific market dominance levels. This tool is designed for daily timeframe analysis and can be used to set informed price expectations and strategic investment goals, providing valuable insights for long-term investment planning.
Why using the Crypto Upside Model 3.0?
Strategic Planning: Helps traders and investors set realistic price targets and investment goals by visualizing potential market cap scenarios.
Informed Decision-Making: Provides a data-driven approach to understanding how a cryptocurrency might perform relative to major assets like Bitcoin and Ethereum.
Customizable Analysis: Allows users to choose different comparison assets (ETH or BTC) and visualize various market cap dominance percentages, offering tailored insights.
Daily Timeframe Focus: Ideal for swing traders and long-term investors who operate on a daily analysis timeframe, providing relevant and actionable data.
Bull Markets: Identify potential price targets if your cryptocurrency's market cap increases significantly.
Bear Markets: Assess how much value could be retained relative to major cryptocurrencies.
Strategic Entry/Exit Points: Use the visualized targets to plan entry or exit points in your trading strategy.
Comparative Advantage
Dynamic Adaptation: Unlike fixed indicators, this tool adapts to any active chart, making it versatile for multiple cryptocurrencies.
Market Cap Insights: Provides a unique perspective by linking price targets to market cap dominance, a critical factor in the crypto market.
User Instructions
Setup: Add the " Upside Model 3.0" indicator to your TradingView chart.
Configuration: Use the input settings to select the comparison cryptocurrency (ETH or BTC) and enable the desired market cap percentage plots.
Analysis: The indicator will display potential price targets based on the selected market cap percentages, providing a visual guide for setting price expectations.
Limitations
Marketcap Data Availability: The indicator relies on marketcap data from TradingView, which may not be available for all cryptocurrencies. If the data is unavailable, the indicator will not function for that asset. This tool is more likely to work with older, established cryptocurrencies, as marketcap data for newer cryptocurrencies may not yet be available.
Daily Timeframe Restriction: The indicator is designed to work exclusively on the daily timeframe, limiting its applicability for intraday trading.
Assumptions of Market Dynamics: The calculations assume a direct correlation between market dominance and price, which may not account for other market dynamics and external factors influencing prices.
Data Accuracy: The accuracy of the indicator depends on the reliability of the data provided by TradingView, which may sometimes experience delays or inaccuracies.
Currently available cryptocurrencies: Bitcoin, Ethereum, Solana, Binance Coin, Cardano, Ripple, Polkadot, Avalanche, Chainlink, Litecoin, Dogecoin, Terra, Uniswap, VeChain, Stellar, Internet Computer, Hedera, Filecoin, Monero, Aave, TRON, NEAR Protocol, Compound, Maker,... For all compatible cryptocurrencies, please consult CRYPTOCAP's documentation.
Final notes
Although various sources ask a payment or user data for similar kind of private indicators, this one is entirely free and open source. "Uncanny" isn't it? I hope this indicator will provide you value. Feel free to leave a message if you have any questions or constructive feedback.
Examples of how I use this indicator
When using ETH's historical price as a reference compared to Bitcoin's marketcap, we can notice that price generally has been held between the +-30% and 50% lines of BTC's marketcap. If history is repeating again, we can expect major resistances around the 50% looking ahead into the future. This for me would be a great area to potentially reduce my ETH spot position.
When using SOL's historical price action, we can notice that the 15% line of ETH's marketcap has been a top in the previous cycle. Today SOL (July 2024), is back at this level. Could this be a top again or could price break this 15% level and head perhaps towards 30% which currently sits around $260? Time will tell.
These are 2 simple example of how I interpret the data. I'm keen to hear what other findings with other pairs you can find.
[Pandora] Vast Volatility Treasure TroveINTRODUCTION:
Volatility enthusiasts, prepare for VICTORY on this day of July 4th, 2024! This is my "Vast Volatility Treasure Trove," intended mostly for educational purposes, yet these functions will also exhibit versatility when combined with other algorithms to garner statistical excellence. Once again, I am now ripping the lid off of Pandora's box... of volatility. Inside this script is a 'vast' collection of volatility estimators, reflecting the indicators name. Whether you are a seasoned trader destined to navigate financial strife or an eagerly curious learner, this script offers a comprehensive toolkit for a broad spectrum of volatility analysis. Enjoy your journey through the realm of market volatility with this code!
WHAT IS MARKET VOLATILITY?:
Market volatility refers to various fluctuations in the value of a financial market or asset over a period of time, often characterized by occasional rapid and significant deviations in price. During periods of greater market volatility, evolving conditions of prices can move rapidly in either direction, creating uncertainty for investors with results of sharp declines as well as rapid gains. However, market volatility is a typical aspect expected in financial markets that can also present opportunities for informed decision-making and potential benefits from the price flux.
SCRIPT INTENTION:
Volatility is assuredly omnipresent, waxing and waning in magnitude, and some readers have every intention of studying and/or measuring it. This script serves as an all-in-one armada of volatility estimators for TradingView members. I set out to provide a diverse set of tools to analyze and interpret market volatility, offering volatile insights, and aid with the development of robust trading indicators and strategies.
In today's fast-paced financial markets, understanding and quantifying volatility is informative for both seasoned traders and novice investors. This script is designed to empower users by equipping them with a comprehensive suite of volatility estimators. Each function within this script has been meticulously crafted to address various aspects of volatility, from traditional methods like Garman-Klass and Parkinson to more advanced techniques like Yang-Zhang and my custom experimental algorithms.
Ultimately, this script is more than just a collection of functions. It is a gateway to a deeper understanding of market volatility and a valuable resource for anyone committed to mastering the complexities of financial markets.
SCRIPT CONTENTS:
This script includes a variety of functions designed to measure and analyze market volatility. Where applicable, an input checkbox option provides an unbiased/biased estimate. Below is a brief description of each function in the original order they appear as code upon first publish:
Parkinson Volatility - Estimates volatility emphasizing the high and low range movements.
Alternate Parkinson Volatility - Simpler version of the original Parkinson Volatility that I realized.
Garman-Klass Volatility - Estimates volatility based on high, low, open, and close prices using a formula that adjusts for biases in price dynamics.
Rogers-Satchell-Yoon Volatility #1 - Estimates volatility based on logarithmic differences between high, low, open, and close values.
Rogers-Satchell-Yoon Volatility #2 - Similar estimate to Rogers-Satchell with the same result via an alternate formulation of volatility.
Yang-Zhang Volatility - An advanced volatility estimate combining both strengths of the Garman-Klass and Rogers-Satchell estimators, with weights determined by an alpha parameter.
Yang-Zhang (Modified) Volatility - My experimental modification slightly different from the Yang-Zhang formula with improved computational efficiency.
Selectable Volatility - Basic customizable volatility calculation based on the logarithmic difference between selected numerator and denominator prices (e.g., open, high, low, close).
Close-to-Close Volatility - Estimates volatility using the logarithmic difference between consecutive closing prices. Specifically applicable to data sources without open, high, and low prices.
Open-to-Close Volatility - (Overnight Volatility): Estimates volatility based on the logarithmic difference between the opening price and the last closing price emphasizing overnight gaps.
Hilo Volatility - Estimates volatility using a method similar to Parkinson's method, which considers the logarithm of the high and low prices.
Vantage Volatility - My experimental custom 'vantage' method to estimate volatility similar to Yang-Zhang, which incorporates various factors (Alpha, Beta, Gamma) to generate a weighted logarithmic calculation. This may be a volatility advantage or disadvantage, hence it's name.
Schwert Volatility - Estimates volatility based on arithmetic returns.
Historical Volatility - Estimates volatility considering logarithmic returns.
Annualized Historical Volatility - Estimates annualized volatility using logarithmic returns, adjusted for the number of trading days in a year.
If I omitted any other known varieties, detailed requests for future consideration can be made below for their inclusion into this script within future versions...
BONUS ALGORITHMS:
This script also includes several experimental and bonus functions that push the boundaries of volatility analysis as I understand it. These functions are designed to provide additional insights and also are my ideal notions for traders looking to explore other methods of volatility measurement.
VOLATILITY APPLICATIONS:
Volatility estimators serve a common role across various facets of trading and financial analysis, offering insights into market behavior. These tools are already in instrumental with enhancing risk management practices by providing a deeper understanding of market dynamics and the inherent uncertainty in asset prices. With volatility estimators, traders can effectively quantifying market risk and adjust their strategies accordingly, optimizing portfolio performance and mitigating potential losses. Additionally, volatility estimations may serve as indication for detecting overbought or oversold market conditions, offering probabilistic insights that could inform strategic decisions at turning points. This script
distinctly offers a variety of volatility estimators to navigate intricate financial terrains with informed judgment to address challenges of strategic planning.
CODE REUSE:
You don't have to ask for my permission to use/reuse these functions in your published scripts, simply because I have better things to do than answer requests for the reuse of these functions.
Notice: Unfortunately, I will not provide any integration support into member's projects at all. I have my own projects that require way too much of my day already.
